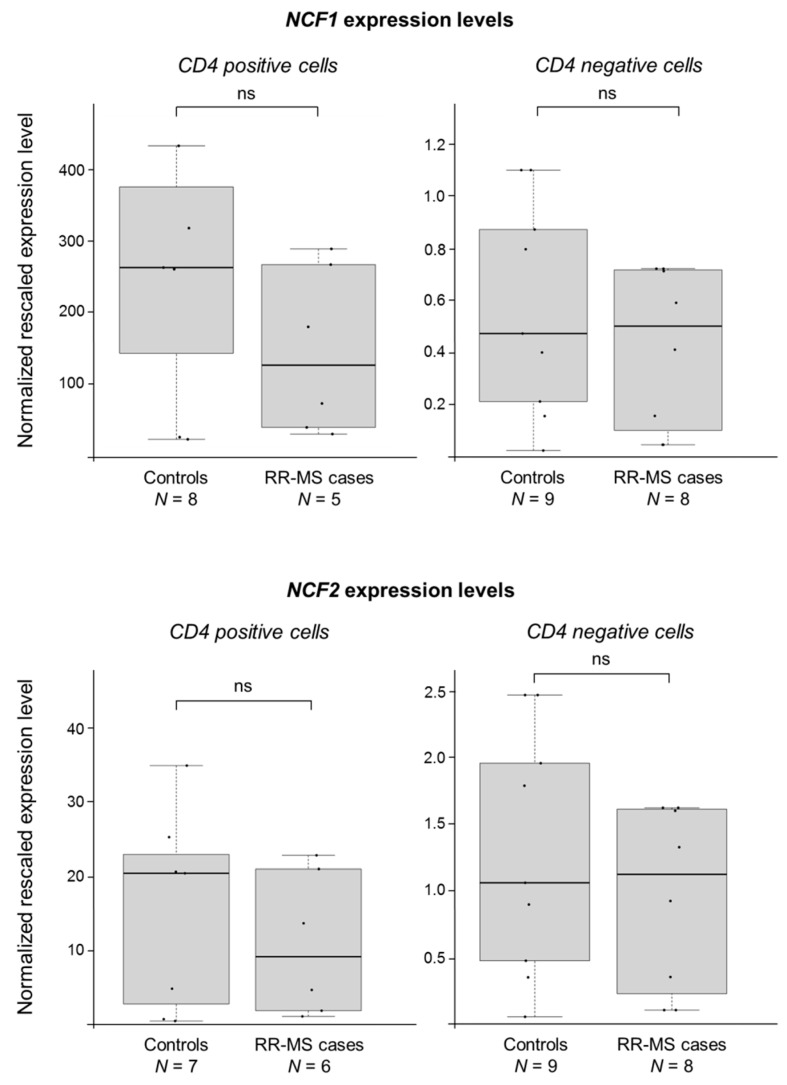
Figure 1.
NCF1 and NCF2 do not show any significant difference between MS cases and controls. Boxplots show the expression levels of the NCF1 and NCF2 genes measured by semi-quantitative real-time RT-PCR in CD4+ and CD4− cells (prepared from peripheral blood mononuclear cells, PBMCs). MS cases and controls belong to five multiplex Finnish families (comprising both male and female individuals). Boxes define the interquartile range; the thick line refers to the median. Results were normalized to expression levels of the HMBS and ACTB housekeeping genes and are presented as rescaled values. The number of subjects belonging to each group is indicated (N). The significance level of t-tests was in all cases not significant (ns).

