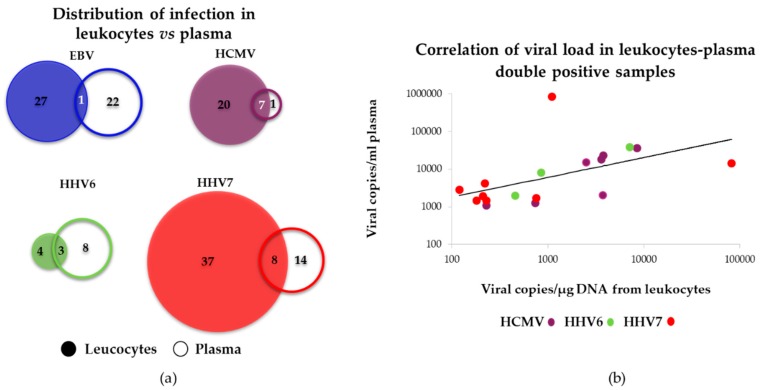
Figure 7.
Comparison between viral loads found in leukocytes vs. plasma blood fractions. (a) Venn diagrams showing the distribution of the different viruses. For each virus the filled circle indicates the number of positive samples detected in leukocytes, while the empty circle indicates the number of positive samples detected in plasma. Circles are scaled according to the number of positive samples. (b) Correlation of viral loads in leukocytes and plasma for samples with viruses detected in both fractions. Coefficient of correlation (R) were the following: HCMV (N = 7): R = 0.8648, p = 0.012; HHV6 (N = 3): R = 0.994, p = 0002; HHV7 (N = 7): R = 0.8192, p = 0.0495. For HHV7 one sample did not show correlation and was not considered for the analysis. EBV was not estimated.

