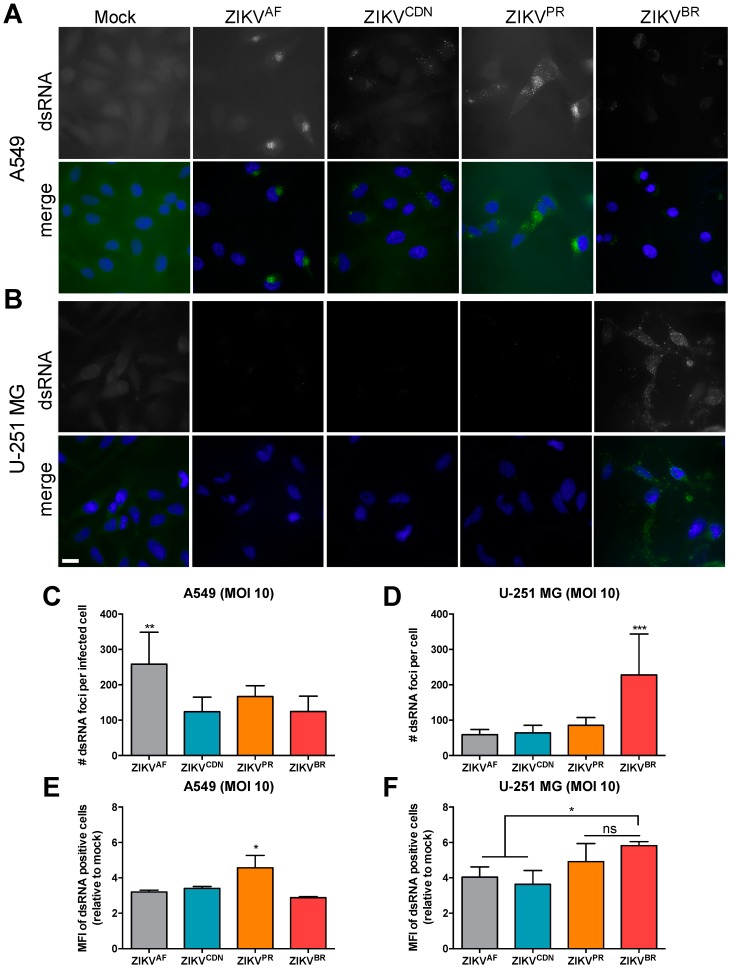
Figure 4.
Isolate-specific differences are observed in number and fluorescence intensity of dsRNA foci in infected cell. (A) A549 and (B) U-251 MG cells were infected with ZIKV at MOI = 10 and 24 h post-infection dsRNA expression was analyzed by immunofluorescence microscopy. Scale bar, 20 μm. The number of dsRNA foci per cell in (C) A549 and (D) U-251 MG cells was quantified using Imaris software (>100 cells/condition). (E) A549 and (F) U-251 MG cells were infected with ZIKV at MOI = 10 and 24 h post-infection the mean fluorescence intensity (MFI) of dsRNA-positive cells was determined by flow cytometry. Values represent mean ± SEM of at least three independent experiments. Asterisks indicate significant differences: * p < 0.05, ** p < 0.01, *** p < 0.001.

