

Abstract
Tumour budding predicts survival of stage II colorectal cancer (CRC) and has been suggested to be associated with epithelial‐to‐mesenchymal transition (EMT). However, the underlying molecular changes of tumour budding remain poorly understood. Here, we performed multiplex immunohistochemistry (mIHC) to phenotypically profile tumours using known EMT‐associated markers: E‐cadherin (adherence junctions), integrin β4 (ITGB4; basement membrane), ZO‐1 (tight junctions), and pan‐cytokeratin. A subpopulation of patients showed high ITGB4 expression in tumour buds, and this coincided with a switch of ITGB4 localisation from the basal membrane of intact epithelium to the cytoplasm of budding cells. Digital image analysis demonstrated that tumour budding with high ITGB4 expression in tissue microarray (TMA) cores correlated with tumour budding assessed from haematoxylin and eosin (H&E) whole sections and independently predicted poor disease‐specific survival in two independent stage II CRC cohorts (hazard ratio [HR] = 4.50 (95% confidence interval [CI] = 1.50–13.5), n = 232; HR = 3.52 (95% CI = 1.30–9.53), n = 72). Furthermore, digitally obtained ITGB4‐high bud count in random TMA cores was better associated with survival outcome than visual tumour bud count in corresponding H&E‐stained samples. In summary, the mIHC‐based phenotypic profiling of human tumour tissue shows strong potential for the molecular characterisation of tumour biology and for the discovery of novel prognostic biomarkers.
Keywords: tumour budding, colorectal cancer, multiplex immunohistochemistry, digital pathology, integrin β4, epithelial‐to‐mesenchymal transition, prognostics
Introduction
The management of stage II colorectal cancer (CRC) remains a major challenge as the currently used clinical factors and prognostic biomarkers do not provide sufficient information for risk assessment and therapy stratification. Tumour budding has been shown to independently predict the survival of stage II CRC patients 1, 2 and could potentially be used as a marker for selecting high‐risk stage II CRC patients for adjuvant chemotherapy. Tumour budding is defined as single cells or cell clusters of up to four or five cells at the invasive margin of colorectal cancer 3, 4, 5. It has also been shown to associate with KRAS (G12D) 6, 7 and BRAF 8 mutations and mismatch repair‐proficient disease 9, 10, as well as lymphovascular invasion 5. Visual evaluation of haematoxylin and eosin (H&E) stains is the standard method for the assessment of tumour budding, a method subject to inter‐ and intra‐observer variation 3, 11. Some studies have suggested improved accuracy by applying cytokeratin immunohistochemistry (IHC) in the assessment of tumour budding in CRC 11, 12, 13, 14, 15. Tumour budding is also linked to epithelial‐to‐mesenchymal transition (EMT), as evidenced by decreased or aberrant expression of E‐cadherin 16, 17. However, the molecular mechanisms and biology driving the high‐grade budding in CRC are still poorly defined. Thus, molecular characterisation and phenotypic classification of tumour budding with association to patient outcome prediction would be highly valuable.
The β4 integrin (ITGB4) subunit was initially termed as a tumour‐associated antigen (TSP180) associated with metastasis 18, 19. The ITGB4 subunit binds exclusively to the α6 integrin subunit, forming a heterodimer of α6β4 integrin 20. This heterodimer is a receptor for laminin‐5 (laminin‐322) and mediates the formation of adhesive structures called hemidesmosomes on the epithelium basal surface 21. In CRC, the expression of ITGB4 has been shown to be stronger in less differentiated areas, with isolated clusters of tumour cells at the tumour–stroma interface compared to well‐differentiated carcinomas with a cohesive growth pattern 22. In a recent study, higher expression of ITGB4 (74% of total of 68 patients) was shown to stratify CRC patients into a higher‐risk group (overall survival [OS]) 23. Furthermore, a ligand for α6β4 integrin, laminin‐5 γ2 subunit, is strongly expressed at the invasive front and associates with tumour budding and poor survival in pT3 CRC 24. Altogether, these studies suggest that ITGB4 could associate with tumour budding in CRC, but this has not been addressed before.
Here, we have used multiplex IHC (mIHC) 25 and automated digital image analysis to quantitatively analyse not only ITGB4 expression but also the expression of E‐cadherin, ZO‐1, and pan‐cytokeratin (PanCk) in total epithelial clusters and in smaller tumour clusters representing a promising surrogate marker for routine histologically analysed tumour budding in stage II CRC. The results demonstrate that the number of tumour buds with high expression of ITGB4 correlates with the visual assessment of tumour budding from H&E whole sections, and it independently predicts the survival of stage II CRC patients. The power of fluorescence mIHC and high‐content quantitative image analysis is demonstrated by the detailed molecular analysis of tumour budding.
Materials and methods
This study was implemented according to the REMARK guidelines for reporting biomarker studies 26.
Study population
Discovery cohort
Archived paraffin‐embedded tumour tissue was collected from 232 consecutive stage II CRC patients operated on at Turku University Hospital from 2005 to 2012. The collection of clinical patient data was approved by the administration of Turku University Hospital, Hospital District of Southwest Finland (T52/2014). The use of tissue material was approved by the Scientific Steering Group of Auria Biobank (AB15‐8108, 25 May 2012) as well as the National Authority for Medico‐Legal affairs (Dnro 4423/32/300/02). The study was conducted in accordance with the Declaration of Helsinki. Only patients with stage II CRC were included in the current study. For tumour staging, TNM7 classification of malignant tumours was used 27. The patient characteristics are given in Table 1.
Table 1.
Patient characteristics. Stage II CRC discovery cohort
| Number of patients | 232 |
| 5‐year OS | 80.1% |
| 5‐year DFS | 86.9% |
| 5‐year DSS | 91.1% |
| Age | |
| Median | 74 |
| Range | 34–96 |
| ≤70 | 92 |
| >70 | 140 |
| Gender | |
| Female | 117 |
| Male | 115 |
| Tumour side | |
| Right side | 112 |
| Left side | 120 |
| pT‐status | |
| T3N0 | 190 |
| T4aN0 | 21 |
| T4bN0 | 21 |
| Grade | |
| G1 | 26 |
| G2 | 154 |
| G3 | 51 |
| n.d. | 1 |
| Histology | |
| Conventional | 205 |
| Mucinous | 26 |
| n.d. | 1 |
| Preoperative obstruction | |
| No | 196 |
| Yes | 36 |
| Tumour perforation | |
| No | 212 |
| Yes | 19 |
| n.d. | 1 |
| Radicality | |
| R0 | 214 |
| R1 | 15 |
| R2 | 3 |
| LN count | |
| ≥12 LNs collected | 185 |
| <12 LNs collected | 47 |
| Vascular invasion | |
| No | 39 |
| Yes | 179 |
| n.d. | 14 |
| Adjuvant chemotherapy | |
| Yes | 163 |
| No | 68 |
| n.d. | 1 |
| MSI status | |
| MSS | 171 |
| MSI high | 43 |
| n.d. | 18 |
| BRAF status | |
| WT | 183 |
| V600E | 28 |
| n.d. | 21 |
MSI, microsatellite instability; MSS, microsatellite stable; n.d., not determined; WT, wild type.
Validation cohort
The cohort consisted of 72 consecutive stage II (Dukes B) CRC patients operated between 1998 and 2000 at the Department of Surgery, Helsinki University Hospital. Archived formalin‐fixed and paraffin‐embedded tumour samples were collected from the archives of the Department of Pathology, Helsinki University Central Hospital. The Finnish Population Register Centre provided follow‐up vital status data, and Statistics Finland provided cause of death for those deceased. This cohort study was approved by the local Ethics Committee (Dnro HUS 226/E6/06, extension TMK02 §66 17.4.2013) and the National Supervisory Authority of Welfare and Health (Valvira Dnro 10041/06.01.03.01/2012).
Tissue microarrays
Tissue microarrays (TMA) of the discovery cohort were constructed and analysed using the next‐generation TMA technique 28 as described in Slik et al 2017 29. The validation TMA construction has been described earlier in 30.
Visual scoring of H&E tumour budding
Tumour budding was analysed as previously recommended by the International Tumour Budding Consensus Conference (ITBCC) 2016 3. The invasive front was screened with a ×10 objective in order to find the ‘hot‐spot’ area. The tumour buds in the selected ‘hot‐spot’ area were counted using a ×20 objective. The bud counts were divided by the normalisation factor to adjust the tumour bud count per 0.785 mm2. Tumour budding was scored blinded to clinical data independently by two pathologists (KS and JS). A consensus was formed from discrepant results, leading to different budding categories. For visual tumour budding, 220 patients with evaluable high‐quality tissue cores were scored.
Multiplex immunohistochemistry and imaging
The mIHC was carried out as described in Blom et al (2017) 25. The method is based on secondary antibody detection of fluorescent labels. Five‐channel fluorescent images were acquired using the Metafer 5 scanning and imaging platform (MetaSystems, Germany), applying a ×20 objective (NA 0.8). Further details can be found in the supplementary material, Supplementary materials and methods.
Image analysis pipeline
For image analysis, exported TIFF images were downscaled to 1:4 from the original resolution (final resolution 0.88 μm/pixel). The image analysis was carried out using cell image analysis software (CellProfiler version 2.2.0 31). The pipeline consisted of four major steps: (1) spot detection, (2) epithelial cluster and bud detection, (3) measurement of channel intensities, and (4) data export. Further details are given in the supplementary material, Supplementary materials and methods.
Statistics
For the association analysis of variables, the two‐sided χ2 association test (Chi‐square) or Fisher's exact test was used. Normality of the data was tested using the Kolmogorov–Smirnov test. Correlations were calculated using the non‐parametric two‐tailed Spearman rho test. P values for mean and median comparisons were calculated using either the Student's t‐test (normal distribution) or the Mann–Whitney U test (non‐normal distribution). Correlation and association analyses were performed using IBM SPSS 24 (SPSS Inc., Armonk, NY, USA). The Cox proportional hazard regression model and Kaplan–Meier analysis with log‐rank test for survival analysis were performed using R version 3.4.3 (Foundation for Statistical Computing, Vienna, Austria) and RStudio 1.1.383 (RStudio Inc. Boston, MA, USA) with survival package 2.41‐3. Proportional hazard assumption was tested for each variable using the Schoenfeld test. The P values in Cox regression analysis were calculated using a Wald test.
Results
Visually assessed tumour budding is predictive for survival end‐points
Tumour budding predicts survival of stage II CRC 3. To validate our stage II cohort of 232 patients in this regard, we performed scoring of H&E sections for tumour budding according to the guidelines set by the ITBCC 3. In brief, a ‘hot‐spot’ region, obtained with ×20 objective and adjusted to represent an area of 0.785 mm2 (equivalent to approximately one ×20 field of view) in the tumour front region of a whole section, was selected for manual counting. A three‐tier scoring system was used in the following manner: Bd 1 = 0–4 buds, Bd 2 = 5–9 buds, Bd 3 = ≥ 10 buds. Using the three‐tier scoring, 84.8% of patients (n=220) scored as Bd 1, 7.8% as Bd 2, and 7.4% as Bd 3.
Univariate Cox regression and Kaplan–Meier plots demonstrated a significantly shorter disease‐specific survival (DSS) for the Bd 2 (hazard ratio [HR] = 6.95; 95% confidence interval [CI] = 2.64–18.28) and Bd 3 (HR = 5.55; 95% CI = 2.00–15.44) patient groups compared to the Bd 1 group (Figure 1A). As the Bd 2 and Bd 3 patient groups showed similar risk, we also dichotomised the cohort using optimal separation cut‐off values with seven or more buds in the high‐grade budding group (HR = 7.55; 95% CI = 2.64–18.28) (Figure 1B). Disease‐free survival (DFS) and OS were also analysed as end‐points, showing similar results (see supplementary material, Figure S1A,B).
Figure 1.
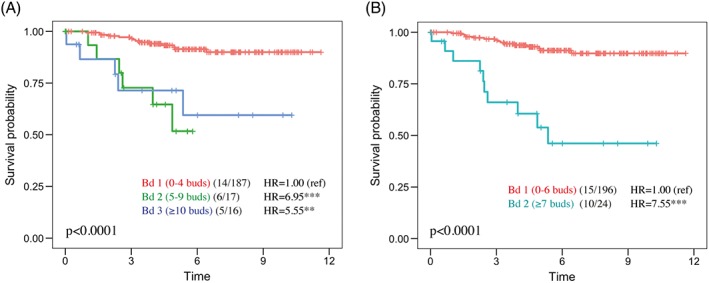
Survival analysis of tumour budding from H&E‐stained whole sections assessed by visual scoring according to ITBCC (2016) guidelines. (A) Three‐tier Kaplan–Meier (log‐rank) plots for DSS, where Bd 1 = 0–4 buds (84.8%), Bd 2 = 5–9 buds (7.8%), and Bd 3 ≥ 10 buds (7.4% of patients). The values in brackets indicate the number of events/patients. (B) Dichotomisation of patients for low and high budding groups using optimal separation (high group ≥7 buds; 11% of patients). Cox univariate regression analysis; **p < 0.01; ***p < 0.001. Ref, reference.
When adjusted for different clinicopathological variables in a multivariate Cox regression analysis, the Bd 2 score, but not the Bd 3 score, independently stratified patients to higher risk (DSS) compared to the Bd 1 score (Table 2). However, using the two‐tiered scoring system, high‐grade tumour budding (≥7 buds) was an independent predictor of poor DSS (see supplementary material, Table S1). Of the other variables, tumour pT status (pT4 versus pT3) and vascular invasion were also independent prognostic factors (HR = 4.12; 95% CI = 1.53–11.14 and HR = 3.27; 95% CI = 1.20–8.94, respectively). Tumour budding was significantly associated with tumour perforation (χ2, p < 0.001) and preoperative obstruction (χ2, p < 0.001) in this patient series (see supplementary material, Table S2). Therefore, we conclude that tumour budding is associated with adverse pathology and predicts survival in this patient cohort, and this demonstrates that the cohort is applicable for phenotypic profiling of tumour budding biology.
Table 2.
Univariate and multivariate Cox regression analysis (DSS) of visually assessed tumour budding (three‐tier) and of the clinicopathological variables used
| Variable | Univariate HR (95% CI) | P value | Multivariate HR (95% CI) (n = 195) | P value |
|---|---|---|---|---|
| Tumour budding H&E | ||||
| Bd 1 (n = 192) | 1 (ref) | 1 (ref) | ||
| Bd 2 (n = 24) | 6.95 (2.64–18.28) | 8.48E−05 | 5.63 (1.63–19.39) | 0.0062 |
| Bd 3 (n = 16) | 5.55 (2.00–15.44) | 0.0010 | 3.13 (0.91–10.70) | 0.069 |
| n.d. = 12 | ||||
| Age | ||||
| ≤70 (n = 85) | 1 (ref) | 1 (ref) | ||
| >70 (n = 135) | 0.82 (0.39–1.75) | 0.6143 | 1.43 (0.48–4.26) | 0.5216 |
| n.d. = 12 | ||||
| Gender | ||||
| Female (n = 113) | 1 (ref) | 1 (ref) | ||
| Male (n = 107) | 0.89 (0.42–1.91) | 0.7669 | 1.61 (0.61–4.28) | 0.3359 |
| n.d. = 12 | ||||
| Tumour side | ||||
| Right side (n = 108) | 1 (ref) | 1 (ref) | ||
| Left side (112) | 1.42 (0.66–3.05) | 0.3754 | 1.18 (0.45–3.11) | 0.7423 |
| n.d. = 12 | ||||
| pT‐status | ||||
| T3N0 (n = 178) | 1 (ref) | 1 (ref) | ||
| T4abN0 (n = 42) | 3.02 (1.38–6.62) | 0.006 | 4.38 (1.54–12.46) | 0.0056 |
| Grade | ||||
| G1–2 (n = 169) | 1 (ref) | 1 (ref) | ||
| G3 (n = 50) | 1.00 (0.40–2.47) | 0.9939 | 0.76 (0.25–2.29) | 0.6197 |
| n.d. = 13 | ||||
| Histology | ||||
| Conventional (n = 193) | 1 (ref) | n.d. | ||
| Mucinous (n = 26) | 0.69 (0.16–2.91) | 0.6104 | n.d. | |
| n.d. = 13 | ||||
| Preop. obstruction | ||||
| No (n = 186) | 1 (ref) | 1 (ref) | ||
| Yes (n = 34) | 1.58 (0.64–3.91) | 0.3268 | 0.71 (0.21–2.34) | 0.5707 |
| n.d. = 12 | ||||
| Perforation | ||||
| No (n = 203) | 1 (ref) | 1 (ref) | ||
| Yes (n = 18) | 4.39 (1.76–10.95) | 0.0015 | 4.04 (1.18–13.82) | 0.0259 |
| n.d. = 12 | ||||
| Radicality | ||||
| R0 (n = 203) | 1 (ref) | n.d. | ||
| R1 (n = 14) | 0.59 (0.08–4.37) | 0.606 | n.d. | |
| R2 (n = 3) | 15.71 (3.61–68.35) | 0.0002 | n.d. | |
| n.d. = 12 | ||||
| LN count | ||||
| ≥12 LNs (n = 175) | 1 (ref) | n.d. | ||
| <12 LNs (n = 45) | 1.57 (0.69–3.60) | 0.285 | n.d. | |
| n.d. = 12 | ||||
| Vascular invasion | ||||
| No (n = 171) | 1 (ref) | 1 (ref) | ||
| Yes (n = 37) | 2.10 (0.92–4.80) | 0.0789 | 3.57 (1.33–9.55) | 0.0114 |
| n.d. = 12 | ||||
| Adj. chemotherapy | ||||
| No (155) | 1 (ref) | 1 (ref) | ||
| Yes (64) | 1.57 (0.73–3.38) | 0.2519 | 1.18 (0.35–4.01) | 0.7877 |
| n.d. = 13 | ||||
| MSI status | ||||
| MSS (n = 170) | 1 (ref) | 1 (ref) | ||
| MSI high (n = 42) | 0.52 (0.16–1.75) | 0.2927 | 0.70 (0.12–4.12) | 0.6919 |
| n.d. = 20 | ||||
| BRAF status | ||||
| WT (n = 181) | 1 (ref) | 1 (ref) | ||
| V600E (n = 28) | 0.61 (0.14–2.61) | 0.5067 | 1.31 (0.15–11.87) | 0.8126 |
| n.d. = 21 | ||||
| Ezrin | ||||
| Low (n = 98) | 1 (ref) | n.d. | ||
| Intermediate (n = 36) | 1.39 (0.42–4.62) | 0.5895 | n.d. | |
| High (n = 38) | 3.19 (1.19–8.54) | 0.0209 | n.d. | |
| n.d. = 48 | ||||
LN, lymph node. Underlined numbers highlight significance compared to a reference value (ref) as measured by Wald test (p < 0.05).
ITGB4 is diffusely expressed in cells resembling tumour budding cells
To study molecular and morphological changes associated with tumour budding both in the peritumoural and intratumoural areas, we analysed a TMA consisting of one to two normal epithelium (tumour adjacent), two tumour centres, and two tumour front cores representing the corresponding patient sample blocks that were used for H&E tumour budding scoring (Figure 2A). As tumour budding has been suggested to be associated with EMT, where typically adherens junctions (marker: E‐cadherin), tight junctions (marker: ZO‐1), and basal membranes (marker: ITGB4) are dissociated 32, we used mIHC 25 to detect these markers simultaneously. In addition, we included PanCk antibodies and DAPI to mark the epithelial cells and nuclei, respectively. We hypothesised that mIHC and automated digital image analysis would allow the discovery of novel phenotypes not indicated by single‐marker IHC.
Figure 2.

mIHC staining for epithelial markers using a multi‐focal TMA demonstrates heterogeneity of ITGB4 expression. (A) Representative areas of tumour‐adjacent normal epithelium (benign), tumour centre, and tumour front were visually determined using H&E‐stained whole‐tissue sections, and 1.2‐mm punch cores were used to construct a TMA cohort of 232 patients. The TMA cohort sections were stained for simultaneous detection of PanCk (cytokeratins), ZO‐1 (apical tight junctions), ITGB4 (basal membrane), E‐cadherin (ECADH, adherens junctions), and DAPI (nuclei). High‐resolution five‐channel scanning (0.22 μm/pixel) was performed prior to visual observation and automated digital image analysis of the multiplex images. Scale bar = 2 mm. (B) Example images of tissue cores of normal (left), centre (middle), and front (right) areas of CRC samples, respectively. Scale bar = 200 μm. (C,D) Heterogeneity of ITGB4 expression: strong cytoplasmic ITGB4 (red) expression in invasive cell buds (C) and weak ITGB4 expression in cell buds (D). White arrowed lines and their corresponding intensity plots for E‐cadherin (ECADH, green) and ITGB4 (red) as measured along the line pixels to the direction of the arrow (intensity scale = 0–255) are shown as insets. Scale bar = 40 μm.
We observed a typical staining pattern of ZO‐1 in the apical cell junctions and of ITGB4 in the basal cell–cell contacts and basal membrane in normal epithelium, as well as in well‐differentiated carcinoma epithelium from tumour centre cores (Figure 2B). However, changes in staining pattern were noted in less‐differentiated tumour front areas of invasive‐looking budding cells (Figure 2B, right panel, and Figure 2C,D). More specifically, we observed that, in a subset of tumours, the expression of ITGB4 was strong in tumour budding cells and that this coincided with a localisation switch of ITGB4 from basal membrane and cell–cell contacts of intact epithelium to diffusively fill the cytoplasm of the budding tumour cells (Figure 2C). However, clear inter‐tumoural heterogeneity was noted (Figure 2D).
Quantification of epithelial clusters, buds, and buds with high ITGB4 expression
To systematically analyse the nature of tumour budding, we set up an automated digital image analysis pipeline to enable the quantification of the marker intensities and the grade of tumour budding in more than 1000 TMA spots (230 patients). First, we observed that neither of the widely used PanCk antibody clones (C‐11 and AE1/3) alone fully covered epithelial cells in colorectal samples, but a combination of the two clones showed a better coverage (see supplementary material, Figure S2). For optimal epithelial cluster segmentation, we combined signals from three different fluorescence channels: PanCk (Tyr‐Alexa‐488), ITGB4 (Alexa‐647), and E‐Cadherin (Alexa‐750) (see supplementary material, Figure S3A–C). In the image analysis, we first identified epithelial clusters as objects using a set threshold for PanCk, E‐cadherin and ITGB4 positivity (Figure 3A and Section 2). Digital buds were defined as epithelial clusters with area 35–1000 pixels, visually matching the bud size in H&E images. ITGB4‐high buds were defined as buds with ITGB4 expression higher than median intensity in all epithelial clusters in the full cohort (cut‐off value for ITGB4 high expression = 26 units; Figure 3A,B). The average count of total buds and ITGB4‐high buds in the tumour front cores were 27 and 11, respectively, much higher than the average bud count in the visual H&E analysis (average = 3). Nuclei analysis in an example high‐grade budding spot demonstrated that 98% of total buds and 96% of ITGB4‐high buds had 0–4 nuclei (see supplementary material, Figure S4) and that nuclei were more often absent in total buds than in ITGB4‐high buds (61% versus 31%).
Figure 3.

Automated digital image analysis for the segmentation of epithelial areas (clusters), buds, and ITGB4‐high buds. (A) A scheme of the epithelial segmentation using combined channels of PanCk, E‐cadherin (ECADH), and ITGB4. CellProfiler software was used for the automated detection of epithelial clusters and buds (clusters of 1–5 cells). ITGB4‐high buds were defined as buds with high ITGB4 expression (cut‐off = median ITGB4 across all the clusters; 26 intensity units; Scale = 0–255). See image analysis details in Section 2. The rectangles indicate blow‐up regions shown in the lower panels. Scale bar = 200 μm. (B) Channel intensities across all the epithelial clusters within normal epithelium (Normal Epi) (B) (n = 6774), tumour centre (C) (n = 17 272), and tumour front (F) cores (n = 19 369). Scale bar = 400 μm. (C) Median channel intensities within buds (n = 29 227) and non‐buds (n = 7985) of tumour cores. (D) Mean counts of buds and ITGB4‐high buds within different cores of the TMA cohort. (E) Median tight junction (TJ) perimeter in pixels within normal and tumour cores. (F) Rank‐weighted co‐localisation (RWC) analysis of epithelial markers within epithelial non‐buds and buds. The markers' pixel‐based localisations and their intensities were compared pairwise using CellProfiler. The error bars represent standard deviation except in D, where standard error of the mean was used. *p < 0.05; **p < 0.01; ***p < 0.001 (non‐parametric Mann–Whitney U test).
Analysis of the marker intensities across all the epithelial clusters (n = 43 414) demonstrated that the expression levels of E‐cadherin, ITGB4, and ZO‐1 were the highest in normal epithelium clusters, lower in tumour centre, and lowest in tumour front clusters (Figure 3B). In contrast, the expression of PanCk increased significantly from normal epithelium to tumour centre and from tumour centre to tumour front clusters. Importantly, ITGB4 levels showed a high degree of variation, especially in tumour centre and in tumour front, where high‐intensity ‘outlier’ clusters were found, reflecting the heterogeneity of ITGB4 expression observed earlier in the different tumour budding phenotypes (see Figure 2C,D). Importantly, the epithelial marker expression profiles were different in epithelial clusters and buds, indicated by significantly lower expression of E‐cadherin, ITGB4, and ZO‐1, but higher expression of PanCk in buds compared to non‐bud epithelial clusters of the tumour samples (Figure 3C). As expected, the bud counts were higher in tumour than in normal epithelium cores and were higher in tumour front cores than in tumour centre cores (Figure 3D).
Analysis of tight junction perimeter (see supplementary material, Supplementary materials and methods; Figure S3D for details) in epithelial clusters showed that the mean perimeter was the largest in the normal epithelium TMA spots and smallest in the tumour front spots, reflecting the disintegration level of the epithelial clusters (Figure 3E). Interestingly, the perimeter inversely correlated with the number of ITGB4‐high buds when measured across all the TMA cores (n = 1093) (see supplementary material, Figure S3E). Similarly, the median intensity of E‐cadherin in epithelial clusters was inversely correlated with the number of ITGB4‐high buds (see supplementary material, Figure S3E). Co‐localisation analysis (per pixel Rank‐weighted co‐localisation) of the epithelial markers demonstrated that ITGB4 and E‐cadherin had a high median co‐localisation coefficient (0.64) in non‐bud epithelial clusters, whereas in digital buds, this value was zero (Figure 3F). By contrast, the basally expressed ITGB4 and apically expressed ZO1 had almost absent co‐localisation in any epithelial objects (coefficient_nonbuds = 0.02; buds = 0).
To study how digitally analysed bud counts reflect visually assessed tumour budding, we correlated digital bud counts of tumour front TMA cores against pathologist's visual scoring of whole H&E sections and of H&E TMA sections across all patients. In addition, we also included in this analysis visually assessed budding scores from samples stained only with PanCk. When comparing total digital tumour budding with ITGB4‐high tumour budding, ITGB4‐high budding correlated better with visual tumour budding assessed in either whole‐section H&E samples, in H&E TMA samples, or in cytokeratin‐stained samples (Table 3).
Table 3.
Correlations of visually and digitally assessed tumour budding variables
| Visual analysis | Digital analysis | |||||
|---|---|---|---|---|---|---|
| Spearman's rho | HE_WS_VIA | HE_TMA_VIA | CK_TMA_VIA | TB_DIA | ITGB4‐high TB DIA | |
| HE_WS_VIA | Corr coef. | 1 | 0.303 | 0.408 | 0.218 | 0.352 |
| P value | 6.8E−06 | 1.1E−09 | 0.001 | 1.0E−07 | ||
| n | 220 | 212 | 206 | 216 | 216 | |
| HE_TMA_VIA | Corr coef. | 0.303 | 1 | 0.321 | 0.175 | 0.326 |
| P value | 6.8E−06 | 2.0E−06 | 0.010 | 1.0 E−06 | ||
| n | 212 | 212 | 206 | 212 | 212 | |
| CK_TMA_VIA | Corr coef. | 0.408 | 0.321 | 1 | 0.488 | 0.659 |
| P value | 1.1E−09 | 2.6 E−06 | 1.0E−13 | 4.9E−27 | ||
| n | 206 | 206 | 206 | 206 | 206 | |
| TB_DIA | Corr coef. | 0.218 | 0.175 | 0.488 | 1 | 0.716 |
| P value | 0.001 | 0.010 | 1.0E−13 | 2.9E−35 | ||
| n | 216 | 212 | 206 | 216 | 216 | |
| ITGB4‐high TB DIA | Corr coef. | 0.352 | 0.326 | 0.659 | 0.716 | 1 |
| P value | 1.0E−07 | 1.2E−06 | 4.9E−27 | 2.9E−35 | ||
| n | 216 | 212 | 206 | 216 | 216 | |
The table shows correlations using continuous, non‐categorised budding counts. The values for HE_TMA_VIA and CK_TMA_VIA as well as digital analysis represent TMA tumour front.
HE_WS_VIA, H&E whole‐section visual analysis; HE_TMA_VIA, H&E TMA visual analysis; CK_TMA_VIA, cytokeratin TMA visual analysis; TB_DIA, tumour budding digital analysis; ITGB4_TB_DIA, ITGB4‐high tumour budding digital analysis. Underlined type = p ≤ 0.01 (two‐tailed, non‐parametric).
ITGB4‐high bud count is an independent predictor of survival
To investigate the potential prognostic relevance of digitally assessed tumour budding, we performed survival analysis for digital total bud counts and for digital ITGB4‐high bud counts in the stage II TMA cohort. In comparison, the visually assessed tumour budding scores were also analysed for survival effects. As the digitally assessed bud counts were much higher than in the whole‐section H&E visual analysis, the same cut‐off values for absolute bud counts could not be used. Instead, we used two‐tier scoring with optimal cut‐off separation (DSS outcome) for each budding analysis (Table 4). The results demonstrate that the whole‐section ‘hot‐spot’ H&E tumour bud scoring is the best predictor of disease outcome. Importantly, however, the ITGB4‐high bud count in TMA cores is better associated with survival status than the bud counts visually assessed from H&E‐stained or PanCk‐stained TMA samples (Table 4). Importantly, using the optimal dichotomisation, the ITGB4‐high bud score (≥25 buds) was also an independent predictor of DSS in a multivariate analysis (Table 5) (HR = 4.50; 95% CI = 1.50–13.5). In contrast, the total bud count (without high ITGB4) (Table 4) or average expression intensity of ITGB4 in the epithelial clusters or in buds was not predictive for outcomes (see supplementary material, Table S3).
Table 4.
Association of digitally and visually assessed bud counts with clinicopathological variables
| Variable | HE_WS_VIA | HE_TMA_VIA | CK_TMA_VIA | TB_DIA | ITGB4_TB_DIA |
|---|---|---|---|---|---|
| High bud cut‐off | ≥7 (11%) | ≥2 (10%) | ≥28 (8%) | ≥34 (23%) | ≥25 (9%) |
| Age | 0.486 | 0.503 | 0.32 | 0.445 | 0.352 |
| Gender | 0.281 | 0.149 | 0.368 | 0.216 | 0.347 |
| Tumour side | 0.466 | 0.443 | 0.468 | 0.153 | 0.449 |
| pT‐status | 0.183 | 0.478 | 0.453 | 0.403 | 0.54 |
| Grade | 0.379 | 0.134 | 0.578 | 0.117 | 0.56 |
| Histology | 0.517 | 0.072 | 0.481 | 0.485 | 0.619 |
| Preop. obstruction | 1.80E−04 | 5.20E−05 | 0.002 | 0.217 | 0.037 |
| Perforation | 3.00E−06 | 0.013 | 0.115 | 0.004 | 0.01 |
| Radicality | 0.189 | 0.586 | 0.88 | 0.428 | 0.181 |
| Ln count | 0.275 | 0.411 | 0.365 | 0.523 | 0.164 |
| Vascular invasion | 0.341 | 0.253 | 0.545 | 0.43 | 0.605 |
| Adj. chemotherapy | 0.11 | 0.526 | 0.443 | 0.329 | 0.483 |
| MSI status | 0.311 | 0.556 | 0.335 | 0.514 | 0.159 |
| BRAF status | 0.173 | 0.494 | 0.608 | 0.633 | 0.441 |
| DSS status | 3.7E−05 | 0.097 | 0.039 | 0.079 | 0.002 |
| DFS status | 0.01 | 0.162 | 0.184 | 0.178 | 0.027 |
| HR (DSS) | 7.55 | 3.01 | 2.98 | 2.13 | 5.09 |
| 95% CI (DSS) | 2.64–18.28 | 1.13–8.04 | 1.12–7.94 | 0.94–4.83 | 2.12–12.2 |
Budding counts were dichotomised using optimal cut‐off values for each parameter using DSS as end‐point. The values (except HR and 95% CI) represent P values of Fisher's exact test. HR = univariate Hazard ratio (Cox regression).
HE_WS_VIA, H&E whole‐section visual analysis; HE_TMA_VIA, H&E TMA visual analysis; CK_TMA_VIA, cytokeratin TMA visual analysis; TB_DIA, tumour budding digital analysis; ITGB4_TB_DIA, ITGB4‐high tumour budding digital analysis; LN, lymph node. Underlined type = p < 0.05.
Table 5.
Univariate and multivariate Cox regression analysis (DSS) for ITGB4‐high bud count using two‐tier patient grouping in stage II TMA cohort
| Variable | Univariate HR (95% CI) | Multivariate HR (95% CI) | ||
|---|---|---|---|---|
| n = 232 | P value | n = 195 | P value | |
| ITGB4‐high buds | ||||
| Low (n = 197) | 1 (ref) | 1 (ref) | ||
| High (n = 19) | 5.09 (2.12–12.22) | 0.0003 | 4.50 (1.50–13.5) | 0.007 |
| n.d. = 16 | ||||
| Age | ||||
| ≤70 (n = 85) | 1 (ref) | 1 (ref) | ||
| >70 (n = 135) | 0.82 (0.39–1.75) | 0.6143 | 1.14 (0.37–3.50) | 0.8127 |
| n.d. = 12 | ||||
| Gender | ||||
| Female (n = 113) | 1 (ref) | 1 (ref) | ||
| Male (n = 107) | 0.89 (0.42–1.91) | 0.7669 | 1.26 (0.50–3.16) | 0.6264 |
| n.d. = 12 | ||||
| Tumour side | ||||
| Right side (n = 108) | 1 (ref) | 1 (ref) | ||
| Left side (112) | 1.42 (0.66–3.05) | 0.3754 | 1.24 (0.49–3.15) | 0.5629 |
| n.d. = 12 | ||||
| Stage | ||||
| T3N0 (n = 178) | 1 (ref) | 1 (ref) | ||
| T4abN0 (n = 42) | 3.02 (1.38–6.62) | 0.006 | 5.61 (2.00–15.71) | 0.001 |
| Grade | ||||
| G1–2 (n = 169) | 1 (ref) | 1 (ref) | ||
| G3 (n = 50) | 1.00 (0.40–2.47) | 0.9939 | 0.90 (0.28–2.89) | 0.8567 |
| n.d. = 13 | ||||
| Histology | ||||
| Conventional (n = 193) | 1 (ref) | n.d. | ||
| Mucinous (n = 26) | 0.69 (0.16–2.91) | 0.6104 | n.d. | |
| n.d. = 13 | ||||
| Preop. obstruction | ||||
| No (n = 186) | 1 (ref) | 1 (ref) | ||
| Yes (n = 34) | 1.58 (0.64–3.91) | 0.3268 | 1.01 (0.34–3.02) | 0.9884 |
| n.d. = 12 | ||||
| Perforation | ||||
| No (n = 203) | 1 (ref) | 1 (ref) | ||
| Yes (n = 18) | 4.39 (1.76–10.95) | 0.0015 | 3.95 (1.21–12.90) | 0.0227 |
| n.d. = 12 | ||||
| Radicality | ||||
| R0 (n = 203) | 1 (ref) | n.d. | ||
| R1 (n = 14) | 0.59 (0.08–4.37) | n.d. | ||
| R2 (n = 3) | 15.71 (3.61–68.35) | n.d. | ||
| n.d. = 12 | ||||
| Ln count | ||||
| ≥12 LNs (n = 175) | 1 (ref) | n.d. | ||
| <12 LNs (n = 45) | 1.57 (0.69–3.60) | n.d. | ||
| n.d. = 12 | ||||
| Vascular invasion | ||||
| No (n = 171) | 1 (ref) | 1 (ref) | ||
| Yes (n = 37) | 2.10 (0.92–4.80) | 0.0789 | 3.02 (1.15–7.93) | 0.0245 |
| n.d. = 12 | ||||
| Adj. chemotherapy | ||||
| No (155) | 1 (ref) | 1 (ref) | ||
| Yes (64) | 1.57 (0.73–3.38) | 0.2519 | 1.04 (0.29–3.70) | 0.9514 |
| n.d. = 13 | ||||
| MSI status | ||||
| MSS (n = 170) | 1 (ref) | 1 (ref) | ||
| MSI high (n = 42) | 0.52 (0.16–1.75) | 0.2927 | 0.39 (0.08–1.89) | 0.2404 |
| n.d. = 20 | ||||
| BRAF status | ||||
| WT (n = 181) | 1 (ref) | 1 (ref) | ||
| V600E (n = 28) | 0.61 (0.14–2.61) | 0.5067 | 0.69 (0.10–4.89) | 0.7071 |
| n.d. = 21 | ||||
| Ezrin | ||||
| Low (n = 98) | 1 (ref) | n.d. | ||
| Intermediate (n = 36) | 1.39 (0.42–4.62) | 0.58 | n.d. | |
| High (n = 38) | 3.19 (1.19–8.54) | 0.0209 | n.d. | |
| n.d. = 48 | ||||
The dichotomisation of patients into low and high ITGB4 bud counts was based on optimal cut‐off (high≥25 buds).
LN, lymph node. Underlined numbers highlight significance compared to a reference value (ref) as measured by Wald test (p < 0.05).
To validate the prognostic power of ITGB4‐high budding in an independent CRC cohort, we performed mIHC staining, scanning, and image analysis as with the discovery cohort, but now using a stage II validation cohort of 72 patients (see supplementary material, Table S4 for clinicopathological variables). For survival analysis, we used the same bud count cut‐off values for patient stratifications as were used in the discovery cohort digital analysis. Importantly, in the validation cohort, the ITGB4‐high bud count (≥25 buds) also predicted DSS (HR = 3.61; 95% CI = 1.34–9.74) and was independent of age, gender, tumour side, and tumour grade (see supplementary material, Table S5; HR = 3.52; 95% CI = 1.30–9.53). Similar to the discovery cohort, the total bud count was not predictive for DSS (HR = 1.88; 95% CI = 0.65–5.42). The results demonstrate that, even though the expression of ITGB4 alone is not prognostic, and although ITGB4 expression is downregulated in buds in general, patients with a high expression of ITGB4 in high‐grade tumour budding cells have a significantly increased risk of cancer‐specific death in stage II CRC. Furthermore, the results show that the high‐content digital analysis of multiple epithelial markers enabled the investigation of budding phenotypes and discovery of the association of ITGB4 expression with tumour budding in ‘cold‐spot’ samples of the tumour front.
Discussion
Tumour budding has already been recognised as an additional prognostic factor in the TNM‐8 classification of CRC 33. Visual scoring of tumour budding is prone to inter‐observer variation due to the difficulty of distinguishing between infiltrating immune cells or stromal fibroblasts and scattered tumour cells and also due to the fragmentation of epithelial tissue upon apoptosis/necrosis 2. IHC, and especially cytokeratin staining, has been applied to aid in the visualisation and scoring of tumour budding. The scope of this study was to apply mIHC and automated digital analysis to define epithelial areas (clusters) and digital buds in order to enable the measurement of marker expression within different epithelial compartments. In the analysis of tumour budding from small TMA cores, we demonstrate that a combination of epithelial markers, rather than a single marker or H&E alone, may better reflect the visually assessed tumour budding in the corresponding whole H&E sections.
For the detection of epithelial cells, we discovered that two different PanCk antibodies (AE1/3 and C‐11), when used alone, did not cover all the epithelial structures (see supplementary material, Figure S2) but that a combination of the two resulted in better coverage. As the cytokeratin family of proteins consists of 20 different basic and acidic subunits, which typically form a variety of heterodimers, it is highly possible that there is a large variation of subunit distribution across different tumours, but also within the epithelium of the same tumour.
For imaging in this study, we used fixed‐light exposure times for different channels, adaptive thresholds (Otsu's) for object detection, and fixed size filtering for tumour bud detection both in the discovery and the validation cohorts (see supplementary material, Supplementary materials and methods for exact details). It is obvious that the same metrics of imaging and analysis cannot be used for replication studies using different instruments or fluorescence reagents but need to be optimised separately in each laboratory. These technical variations bring about limitations in applying fluorescence‐based digital imaging in the clinical pathology laboratory. However, we demonstrate that the approach can be of great value in clinical research.
In this study, we compared conventional visual scoring of tumour budding in H&E‐stained sections, with bud scoring assessed by digital analysis. Our results demonstrate that whole‐section visual scoring of tumour budding from hot‐spot areas is superior to randomly selected TMA cores. However, we also show that the use of epithelial markers PanCk and ITGB4 to identify small epithelial clusters greatly improves the ability to predict survival even from these randomly selected TMA spots compared to conventional tumour budding analysis from H&E‐stained TMA slides only. This could be important in small biopsies from CRC, which correspond to the situation with randomly chosen TMA spots from tumour areas. The current guidelines recommend the analysis of tumour budding from H&E‐stained sections, but PanCk staining can be used in challenging cases 3. This recommendation is derived from the fact that earlier outcome data for tumour budding were largely based on using H&E‐analysed material only 3. However, it is possible that the significance of IHC‐guided tumour budding will lead to it having a more important role in the future. In addition, in the current study, the marker combination of ITGB4 and PanCk resulted in better correlations with survival than PanCk alone. This may be related to the fact that PanCk demonstrates all the epithelial cell clusters (including necrotic fragments), whereas ITGB4 is more specific for invasive cells (when present in small cell clusters) and is involved in EMT 34, a phenomenon to which tumour budding is at least partly related 4. For this reason, it is tempting to hypothesise that biomarkers linked with EMT, which have also shown correlation with survival 35, might be relevant additional markers of tumour budding in challenging tumour specimens.
EMT is a phenomenon consisting of loss or aberrant expression of adherence junction E‐cadherin, disintegration of tight junctions (ZO‐1), and of basement membranes (ITGB4). These are typically associated with elevated mesenchymal transcription factor expression and increased cell scattering/invasion 32. In this study, we digitally measured the expression of E‐cadherin, ZO‐1, and ITGB4 in more than 1000 TMA cores and in more than 43 000 epithelial clusters. As a result, we found lower levels of these markers in cancer cores compared with tumour‐adjacent normal epithelium cores. In addition, all three markers were downregulated in tumour buds compared to non‐bud epithelial clusters. Moreover, the epithelial tight junction perimeter was significantly smaller when comparing normal epithelium to cancer or tumour centre to tumour border samples, reflecting tight junction disintegration of the epithelium. Importantly, both the tight junction perimeter and the E‐cadherin expression correlated inversely with the number of ITGB4‐high buds, and the co‐localisation of E‐cadherin and ITGB4 was significantly lower in epithelial buds compared with non‐buds. Together, these results point out that ITGB4‐related budding links with several factors associated with the structural disintegration of the epithelium and thus suggest that ITGB4‐high budding is a process related to EMT. Our results of decreased E‐cadherin expression in tumour buds support this model and are consistent with previous studies 3, 16.
The studies on α6β4 in pre‐clinical models of CRC demonstrate a dualistic role for ITGB4: It is important in hemidesmosome formation and cohesive function of the epithelium, yet it has a migration‐ and invasion‐promoting function in association with the actin cytoskeleton and oncogenic signalling 36, 37. However, no studies have quantitatively investigated the phenotypic changes associated with the transformation of intact colorectal epithelium to high‐grade tumour budding and especially analysed this in relation to ITGB4‐ and EMT‐associated epithelial marker expression (e.g. E‐cadherin, ZO‐1). Nor have the current studies properly addressed the association between ITGB4 expression and localisation and clinical outcomes in CRC. One study investigated the association with CRC patient survival but on a relatively small cohort of 68 patients 23, concluding that higher ITGB4 expression is associated with cancer tissue and predicts shorter OS. In general, the reports on ITGB4 expression in CRC have been controversial. Falcioni and others (1994) 22 demonstrated that cell clusters surrounded by stromal cells in poorly differentiated carcinomas showed elevated levels of ITGB4 expression. In contrast, two other studies suggested decreased levels of ITGB4 expression in colon cancer compared with benign tissue 38, 39. Our results demonstrate that the total expression levels of not only E‐cadherin but also of ITGB4 are, in fact, lower in cancer compared to normal epithelium (adjacent to the tumour). Furthermore, we show that both markers are weaker in tumour buds than in the rest of the tumour epithelium as measured in almost 40 000 epithelial clusters. The stronger overall expression of ITGB4 in non‐bud epithelium is reflective of the strong ITGB4 in the basal cell contacts and basal membrane of the more intact epithelial clusters. ITGB4 expression levels alone in epithelial clusters or within tumour buds did not predict survival. Importantly, however, we demonstrate that, in a subpopulation of stage II patients, a high number of ITGB4‐high buds (≥25 buds) confers a significantly elevated risk of aggressive disease. Our results highlight the complex heterogeneous nature of ITGB4 expression, which can be elaborately studied using digital multiplexed marker analysis of combined object intensity, structure (size), localisation, and quantity (bud count).
We observed clear ITGB4 expression and localisation changes from basal cell–cell contacts in the benign epithelium to diffuse cytoplasmic localisation in the budding tumour cells. This was associated with a significant reduction of ITGB4–E‐cadherin co‐localisation, when measured across all the epithelial non‐bud clusters and buds. This phenotypic switch is in line with the suggested conditional pro‐invasion and oncogenic signalling role of the α6β4 integrin heterodimer 40. Larjava at el. 41 already demonstrated in 1993 that, during wound healing of human mucosal keratinocytes, ITGB4 changes its basal layer expression to a more cytoplasmic localisation. Similarly, in a 2D wound‐healing experiment of colon epithelial cells, ITGB4 localisation was changed from basal hemidesmosomal plaques to protruding actin lamellae 42. This phenotypic switch, which was later shown to be linked with ITGB4 cytoplasmic tail phosphorylation, dissociation from cytokeratin filaments, and hemidesmosome disassembly, is also known to be associated with oncogenic receptor–tyrosine kinase signalling 37, 40. It is very possible that ITGB4 in tumour buds binds to its ligand, laminin‐γ2, which is a known transcriptional target of β‐catenin 43 and which has been shown to be more abundantly expressed at the invasive front and to be associated with tumour budding and with poor survival in pT3 CRC 24. Interestingly, α6β4 integrin is also associated with the tyrosine–kinase receptor MET, which also shows higher expression at the invasive front areas with higher budding grade 13. In the future, our quantitative mIHC‐based phenotypic profiling of epithelial clusters and buds will be instrumental in investigating the spatial interplay of ITGB4 with MET, laminin‐γ2, and β‐catenin signalling in CRC tissue.
In summary, our study characterises the nature of EMT‐associated epithelial marker expression in epithelial clusters and tumour buds and demonstrates the power of our multiplex imaging in phenotypic profiling of CRC. Our study shows that combined marker intensity and marker‐assisted morphology analysis uncovers a subpopulation of tumours with a highly aggressive epithelial phenotype of prognostic significance. Importantly, the results provide evidence for the translation of existing pre‐clinical data into a clinical setting, whereby the ITGB4 localisation shift from basal cell–cell contacts in intact epithelium to the cytoplasm of invading cells is a phenotypic switch to more aggressive stage II CRC.
Author contributions statement
TP and JS designed the study. TP, KS, KV, SK, HM, CH, EK, and JS contributed to the acquisition of data. TP, KS, SB, RT, SK, HM, CH, OL, OK, and JS contributed to the analysis and interpretation of the data. TP drafted the manuscript, and all authors contributed to writing and/or editing of the manuscript.
Supporting information
Figure S1. Survival analysis of tumour budding from H&E‐stained whole sections assessed by visual scoring according to ITBCC (2016) guidelines
Figure S2. Combination of C‐11 and AE1/3 Pan‐cytokeratin antibody clones improves the coverage of epithelial cell segmentation
Figure S3. Epithelial segmentation for the analysis of total epithelial buds and ITGB4‐high buds and tight junctions
Figure S4. Nuclear count distribution in total buds and ITGB4‐high buds
Table S1. Univariate and multivariate Cox regression analysis (DSS) for visually assessed tumour budding (two‐tier) and for clinicopathological variables
Table S2. Clinicopathological variables and their association with visually assessed H&E whole‐section tumour budding and DSS using three‐tier patient grouping
Table S3. Univariate Cox regression analysis (DSS) of digitally assessed epithelial marker expression levels in clusters and total buds of normal epithelium, centre, and front TMA cores
Table S4. Clinicopathological variables of the validation cohort
Table S5. Univariate and multivariate Cox regression analysis (DSS) for digitally assessed ITGB4‐high bud count and for clinicopathological variables used in the validation cohort
Acknowledgements
This research was supported by Sigrid Juselius Foundation (OK, TP, CH), Cancer Society of Finland (OK, TP, CH), Academy of Finland Centre of Excellence for Translational Biology 2014–2019 (grant 271845) (OK), Academy of Finland Post‐doctoral fellow grant (253662) (TP), Instrufoundation Fellow grant (TP), TEKES (grant 40294/13) (OK), University of Helsinki Doctoral School in Health Sciences Doctoral Programme in Biomedicine (SB), the European Union's Seventh Framework Programme (FP7/20072013) under grant agreement no. 258068, EU‐FP7‐Systems Microscopy NoE (OK), and IMI/PREDECT (grant 115188) (OK).
No conflicts of interest were declared.
References
- 1. Koelzer VH, Zlobec I, Lugli A. Tumor budding in colorectal cancer – ready for diagnostic practice? Hum Pathol 2016; 47: 4–19. [DOI] [PubMed] [Google Scholar]
- 2. Wang LM, Kevans D, Mulcahy H, et al Tumor budding is a strong and reproducible prognostic marker in T3N0 colorectal cancer. Am J Surg Pathol 2009; 33: 134–141. [DOI] [PubMed] [Google Scholar]
- 3. Lugli A, Kirsch R, Ajioka Y, et al Recommendations for reporting tumor budding in colorectal cancer based on the international Tumor Budding Consensus Conference (ITBCC) 2016. Mod Pathol 2017; 30: 1299–1311. [DOI] [PubMed] [Google Scholar]
- 4. Grigore AD, Jolly MK, Jia D, et al Tumor budding: the name is EMT. Partial EMT. J Clin Med 2016; 5: 51. [DOI] [PMC free article] [PubMed] [Google Scholar]
- 5. Mitrovic B, Schaeffer DF, Riddell RH, et al Tumor budding in colorectal carcinoma: time to take notice. Mod Pathol 2012; 25: 1315–1325. [DOI] [PubMed] [Google Scholar]
- 6. Jang S, Hong M, Shin MK, et al KRAS and PIK3CA mutations in colorectal adenocarcinomas correlate with aggressive histological features and behavior. Hum Pathol 2017; 65: 21–30. [DOI] [PubMed] [Google Scholar]
- 7. Prall F, Ostwald C. High‐degree tumor budding and podia‐formation in sporadic colorectal carcinomas with K‐ras gene mutations. Hum Pathol 2007; 38: 1696–1702. [DOI] [PubMed] [Google Scholar]
- 8. Jang MH, Kim S, Hwang DY, et al BRAF‐mutated colorectal cancer exhibits distinct Clinicopathological features from wild‐type BRAF‐expressing cancer independent of the microsatellite instability status. J Korean Med Sci 2017; 32: 38–46. [DOI] [PMC free article] [PubMed] [Google Scholar]
- 9. Zlobec I, Bihl MP, Foerster A, et al The impact of CpG Island methylator phenotype and microsatellite instability on tumour budding in colorectal cancer. Histopathology 2012; 61: 777–787. [DOI] [PubMed] [Google Scholar]
- 10. Jass JR, Barker M, Fraser L, et al APC mutation and tumour budding in colorectal cancer. J Clin Pathol 2003; 56: 69–73. [DOI] [PMC free article] [PubMed] [Google Scholar]
- 11. Koelzer VH, Zlobec I, Berger MD, et al Tumor budding in colorectal cancer revisited: results of a multicenter interobserver study. Virchows Arch 2015; 466: 485–493. [DOI] [PubMed] [Google Scholar]
- 12. Kai K, Aishima S, Aoki S, et al Cytokeratin immunohistochemistry improves interobserver variability between unskilled pathologists in the evaluation of tumor budding in T1 colorectal cancer. Pathol Int 2016; 66: 75–82. [DOI] [PubMed] [Google Scholar]
- 13. Satoh K, Nimura S, Aoki M, et al Tumor budding in colorectal carcinoma assessed by cytokeratin immunostaining and budding areas: possible involvement of c‐Met. Cancer Sci 2014; 105: 1487–1495. [DOI] [PMC free article] [PubMed] [Google Scholar]
- 14. Koelzer VH, Assarzadegan N, Dawson H, et al Cytokeratin‐based assessment of tumour budding in colorectal cancer: analysis in stage II patients and prospective diagnostic experience. J Pathol Clin Res 2017; 3: 171–178. [DOI] [PMC free article] [PubMed] [Google Scholar]
- 15. Ohtsuki K, Koyama F, Tamura T, et al Prognostic value of immunohistochemical analysis of tumor budding in colorectal carcinoma. Anticancer Res 2008; 28: 1831–1836. [PubMed] [Google Scholar]
- 16. Zlobec I, Lugli A. Epithelial mesenchymal transition and tumor budding in aggressive colorectal cancer: tumor budding as oncotarget. Oncotarget 2010; 1: 651–661. [DOI] [PMC free article] [PubMed] [Google Scholar]
- 17. Zlobec I, Lugli A, Baker K, et al Role of APAF‐1, E‐cadherin and peritumoral lymphocytic infiltration in tumour budding in colorectal cancer. J Pathol 2007; 212: 260–268. [DOI] [PubMed] [Google Scholar]
- 18. Falcioni R, Sacchi A, Resau J, et al Monoclonal antibody to human carcinoma‐associated protein complex: quantitation in normal and tumor tissue. Cancer Res 1988; 48: 816–821. [PubMed] [Google Scholar]
- 19. Sacchi A, Falcioni R, Piaggio G, et al Ligand‐induced phosphorylation of a murine tumor surface protein (TSP‐180) associated with metastatic phenotype. Cancer Res 1989; 49: 2615–2620. [PubMed] [Google Scholar]
- 20. Hemler ME, Crouse C, Sonnenberg A. Association of the VLA alpha 6 subunit with a novel protein. A possible alternative to the common VLA beta 1 subunit on certain cell lines. J Biol Chem 1989; 264: 6529–6535. [PubMed] [Google Scholar]
- 21. Borradori L, Sonnenberg A. Structure and function of hemidesmosomes: more than simple adhesion complexes. J Invest Dermatol 1999; 112: 411–418. [DOI] [PubMed] [Google Scholar]
- 22. Falcioni R, Turchi V, Vitullo P, et al Integrin Beta‐4 expression in colorectal‐cancer. Int J Oncol 1994; 5: 573–578. [DOI] [PubMed] [Google Scholar]
- 23. Zhang W, Zhang B, Vu T, et al Molecular characterization of pro‐metastatic functions of beta4‐integrin in colorectal cancer. Oncotarget 2017; 8: 92333–92345. [DOI] [PMC free article] [PubMed] [Google Scholar]
- 24. Shinto E, Tsuda H, Ueno H, et al Prognostic implication of laminin‐5 gamma 2 chain expression in the invasive front of colorectal cancers, disclosed by area‐specific four‐point tissue microarrays. Lab Invest 2005; 85: 257–266. [DOI] [PubMed] [Google Scholar]
- 25. Blom S, Paavolainen L, Bychkov D, et al Systems pathology by multiplexed immunohistochemistry and whole‐slide digital image analysis. Sci Rep 2017; 7: 15580. [DOI] [PMC free article] [PubMed] [Google Scholar]
- 26. McShane LM, Altman DG, Sauerbrei W, et al Reporting recommendations for tumor marker prognostic studies (REMARK). J Natl Cancer Inst 2005; 97: 1180–1184. [DOI] [PubMed] [Google Scholar]
- 27. Sobin LH, Compton CC. TNM seventh edition: what's new, what's changed: communication from the International Union Against Cancer and the American Joint Committee on Cancer. Cancer 2010; 116: 5336–5339. [DOI] [PubMed] [Google Scholar]
- 28. Zlobec I, Koelzer VH, Dawson H, et al Next‐generation tissue microarray (ngTMA) increases the quality of biomarker studies: an example using CD3, CD8, and CD45RO in the tumor microenvironment of six different solid tumor types. J Transl Med 2013; 11: 104. [DOI] [PMC free article] [PubMed] [Google Scholar]
- 29. Slik K, Kurki S, Korpela T, et al Ezrin expression combined with MSI status in prognostication of stage II colorectal cancer. PLoS One 2017; 12: e0185436. [DOI] [PMC free article] [PubMed] [Google Scholar]
- 30. Bockelman C, Koskensalo S, Hagstrom J, et al CIP2A overexpression is associated with c‐Myc expression in colorectal cancer. Cancer Biol Ther 2012; 13: 289–295. [DOI] [PubMed] [Google Scholar]
- 31. Carpenter AE, Jones TR, Lamprecht MR, et al CellProfiler: image analysis software for identifying and quantifying cell phenotypes. Genome Biol 2006; 7: R100. [DOI] [PMC free article] [PubMed] [Google Scholar]
- 32. Lamouille S, Xu J, Derynck R. Molecular mechanisms of epithelial‐mesenchymal transition. Nat Rev Mol Cell Biol 2014; 15: 178–196. [DOI] [PMC free article] [PubMed] [Google Scholar]
- 33. Brierley J, Gospodarowicz MK, Wittekind C. TNM classification of malignant tumours (8th edn). John Wiley & Sons, Inc.: Chichester, West Sussex, UK; Hoboken, NJ, 2017. [Google Scholar]
- 34. Masugi Y, Yamazaki K, Emoto K, et al Upregulation of integrin beta4 promotes epithelial‐mesenchymal transition and is a novel prognostic marker in pancreatic ductal adenocarcinoma. Lab Invest 2015; 95: 308–319. [DOI] [PubMed] [Google Scholar]
- 35. Roseweir AK, Kong CY, Park JH, et al A novel tumor‐based epithelial‐to‐mesenchymal transition score that associates with prognosis and metastasis in patients with stage II/III colorectal cancer. Int J Cancer 2019; 144: 150–159. [DOI] [PubMed] [Google Scholar]
- 36. Lipscomb EA, Mercurio AM. Mobilization and activation of a signaling competent alpha6beta4integrin underlies its contribution to carcinoma progression. Cancer Metastasis Rev 2005; 24: 413–423. [DOI] [PubMed] [Google Scholar]
- 37. Mercurio AM, Rabinovitz I, Shaw LM. The alpha 6 beta 4 integrin and epithelial cell migration. Curr Opin Cell Biol 2001; 13: 541–545. [DOI] [PubMed] [Google Scholar]
- 38. Sordat I, Bosman FT, Dorta G, et al Differential expression of laminin‐5 subunits and integrin receptors in human colorectal neoplasia. J Pathol 1998; 185: 44–52. [DOI] [PubMed] [Google Scholar]
- 39. Stallmach A, von Lampe B, Matthes H, et al Diminished expression of integrin adhesion molecules on human colonic epithelial cells during the benign to malign tumour transformation. Gut 1992; 33: 342–346. [DOI] [PMC free article] [PubMed] [Google Scholar]
- 40. Stewart RL, O'Connor KL. Clinical significance of the integrin alpha6beta4 in human malignancies. Lab Invest 2015; 95: 976–986. [DOI] [PMC free article] [PubMed] [Google Scholar]
- 41. Larjava H, Salo T, Haapasalmi K, et al Expression of integrins and basement membrane components by wound keratinocytes. J Clin Invest 1993; 92: 1425–1435. [DOI] [PMC free article] [PubMed] [Google Scholar]
- 42. Lotz MM, Rabinovitz I, Mercurio AM. Intestinal restitution: progression of actin cytoskeleton rearrangements and integrin function in a model of epithelial wound healing. Am J Pathol 2000; 156: 985–996. [DOI] [PMC free article] [PubMed] [Google Scholar]
- 43. Hlubek F, Jung A, Kotzor N, et al Expression of the invasion factor laminin gamma2 in colorectal carcinomas is regulated by beta‐catenin. Cancer Res 2001; 61: 8089–8093. [PubMed] [Google Scholar]
Associated Data
This section collects any data citations, data availability statements, or supplementary materials included in this article.
Supplementary Materials
Figure S1. Survival analysis of tumour budding from H&E‐stained whole sections assessed by visual scoring according to ITBCC (2016) guidelines
Figure S2. Combination of C‐11 and AE1/3 Pan‐cytokeratin antibody clones improves the coverage of epithelial cell segmentation
Figure S3. Epithelial segmentation for the analysis of total epithelial buds and ITGB4‐high buds and tight junctions
Figure S4. Nuclear count distribution in total buds and ITGB4‐high buds
Table S1. Univariate and multivariate Cox regression analysis (DSS) for visually assessed tumour budding (two‐tier) and for clinicopathological variables
Table S2. Clinicopathological variables and their association with visually assessed H&E whole‐section tumour budding and DSS using three‐tier patient grouping
Table S3. Univariate Cox regression analysis (DSS) of digitally assessed epithelial marker expression levels in clusters and total buds of normal epithelium, centre, and front TMA cores
Table S4. Clinicopathological variables of the validation cohort
Table S5. Univariate and multivariate Cox regression analysis (DSS) for digitally assessed ITGB4‐high bud count and for clinicopathological variables used in the validation cohort