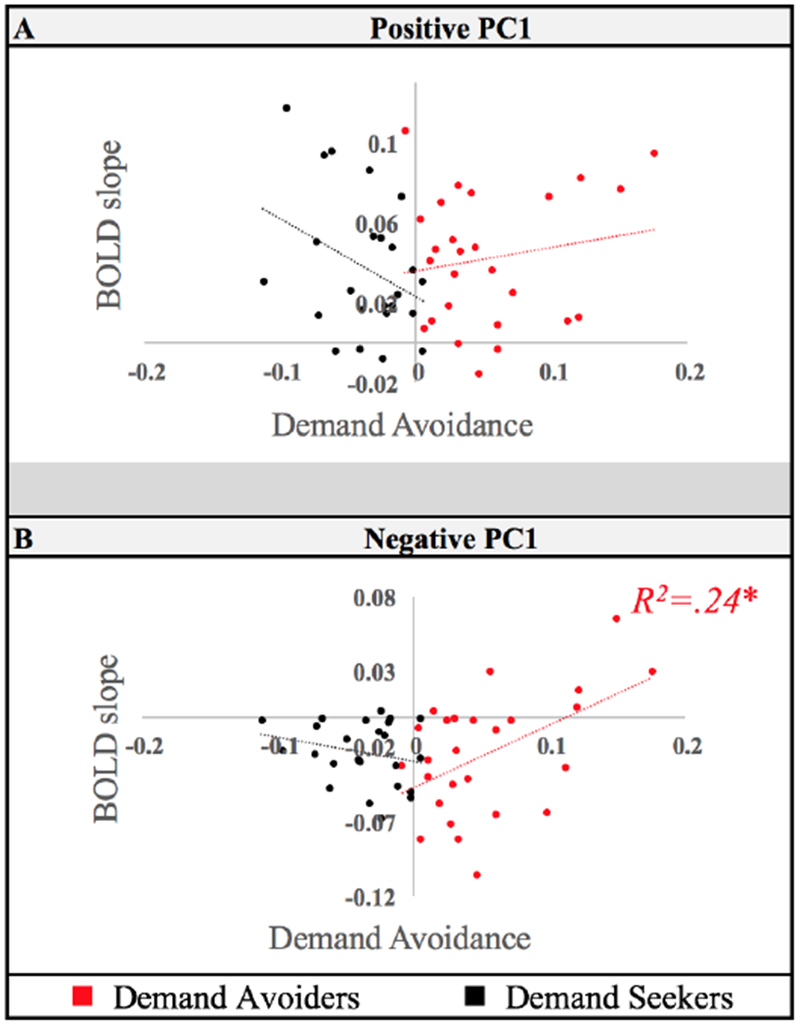
Figure 6.

Principal Component cluster correlations with demand avoidance behavior are plotted for (A) Positive (“Fronto-Parietal Component”) and (B) Negative PC1 (“Default Mode Component”). Results for Demand Avoiders are plotted in red. Results for Demand Seekers are plotted in black. The ‘Effort level’ analysis tested whether the change in effort selection rates was correlated to the change of brain activity in each PC A ROI during task execution across effort levels. Default Mode Component showed a positive relationship between the slope of change in this network across effort levels and effort selections. This was only the case in the Demand Avoider group. Error bars plot standard error of the mean. * p < .05.
