

Abstract
Human attention is intrinsically dynamic, with focus continuously shifting between elements of the external world and internal, self-generated thoughts. Communication within and between large-scale brain networks also fluctuates spontaneously from moment to moment. However, the behavioral relevance of dynamic functional connectivity and possible link with attentional state shifts is unknown. We used a unique approach to examine whether brain network dynamics reflect spontaneous fluctuations in moment-to-moment behavioral variability, a sensitive marker of attentional state. Nineteen healthy adults were instructed to tap their finger every 600 ms while undergoing fMRI. This novel, but simple, approach allowed us to isolate moment-to-moment fluctuations in behavioral variability related to attention, independent of common confounds in cognitive tasks (e.g., stimulus changes, response inhibition). Spontaneously increasing tap variance (“out-of-the-zone” attention) was associated with increasing activation in dorsal-attention and salience network regions, whereas decreasing tap variance (“in-the-zone” attention) was marked by increasing activation of default mode network (DMN) regions. Independent of activation, tap variance representing out-of-the-zone attention was also time-locked to connectivity both within DMN and between DMN and salience network regions. These results provide novel mechanistic data on the understudied neural dynamics of everyday, moment-to-moment attentional fluctuations, elucidating the behavioral importance of spontaneous, transient coupling within and between attention-relevant networks.
Keywords: dynamic functional connectivity, insula, medial prefrontal cortex, posterior cingulate cortex, resting state fMRI
Introduction
During normal waking life, human attention is in a constant flux, waxing and waning between elements of the external world and internal, self-generated thoughts. Spontaneous fluctuations in attention and their neural correlates can be tracked by assessing continuous fluctuations in behavior (Sonuga-Barke and Castellanos 2007; Palva and Palva 2012). Recent studies show that regional “activations” in attention-relevant brain networks accompany ongoing changes in intraindividual behavioral variability. Specifically, increased default mode network (DMN) activity tracks lower variability (or “in-the-zone” attention), whereas increased activity within salience and dorsal-attention networks tracks higher variability (“out-of-the-zone” attention) (Esterman et al. 2013, 2014). Regional brain activation, however, cannot provide a full mechanistic account of attentional fluctuations.
Mounting evidence suggests that interregional communication must be considered in mechanisms of cognition and behavior (Sporns 2012). Functional connectivity (FC), defined as the interregional correlation of time series, can be used as a metric of network coupling (Biswal et al. 1995). While FC is often studied in the wakeful, resting state, averaging brain activity over several minutes, recent studies demonstrate that spontaneous FC fluctuations on the order of seconds, referred to as dynamic FC, can be captured using fMRI (Hutchison, Womelsdorf, Allen, et al. 2013; Calhoun et al. 2014). Dynamic FC patterns occur within and between all (including attention-relevant) brain networks (Chang and Glover 2010; Hutchison, Womelsdorf, Gati, et al. 2013) and contain reoccurring patterns of network configuration (Liu and Duyn 2013; Allen et al. 2014) that are partially constrained by structural connectivity (Barttfeld et al. 2015; Shen, Hutchison, et al. 2015).
However, research on the behavioral significance of transient changes in spontaneous FC, and particularly the link with attentional fluctuations, remains scant. The overall degree of dynamic FC variability of DMN areas over several minutes was associated with fluctuations in an individual's attention away from the sensory environment (Kucyi et al. 2013; Kucyi and Davis 2014). Dynamic FC of DMN, dorsal-attention, and salience network regions in select 30-s periods during continuous task performance was related to self-reports of spontaneous attentional lapses (Mittner et al. 2014). Additionally, spontaneous FC fluctuations of large-scale (including attention-relevant) networks within the few seconds, or hundreds of milliseconds, preceding stimulus presentations predicted subsequent performance and perceptual outcomes (Thompson et al. 2013; Weisz et al. 2014; Sadaghiani et al. 2015). However, dynamic FC that continuously tracks ongoing, spontaneous changes in attentional state remains unstudied. A demonstration that continuous changes in cognitive state are time-locked to spontaneous FC fluctuations is much needed, as dynamic FC analysis with fMRI has been challenged by a lack of validation (Handwerker et al. 2012; Keilholz et al. 2013).
We thus adopted a novel, but simple, approach to study ongoing attentional dynamics, in which participants attempted to continuously and consistently (every 600 ms) tap their finger for a prolonged period. We hypothesized that the task would allow us to isolate fluctuations in behavioral variability related to attention, independent of processes that are present in common cognitive task designs (e.g., related to stimulus changes, target detection, response inhibition, or error monitoring). Consistent finger tapping requires sustained attention (Repp 2005; Repp and Su 2013), and increased attentional load results in increased tapping variability (Pecenka et al. 2013). We therefore predicted that attention-related activations of the DMN, dorsal-attention, and salience networks would track fluctuations in the variability of rhythmic finger tapping.
Crucially, FC between given sets of regions has been shown to explain significant variance in cognitive states, even when controlling for activation within those regions (Gonzalez-Castillo et al. 2015). We thus also expected that over-and-above activation effects, dynamic connectivity changes within and between attention-relevant networks would correlate with continuous fluctuations in attentional state, as indexed by tapping variability. We also aimed to demonstrate that our approach was sensitive to attentional rather than sensorimotor aspects of finger tapping, so we assessed whether activation and connectivity of sensorimotor regions tracked tapping variability.
Materials and Methods
Participants
Nineteen healthy, right-handed adults (7 males, 12 females; mean age ± SD = 24.2 ± 3.2) were included for final analysis. While 23 subjects participated in the study, 4 were excluded, because their behavioral data did not meet the standards required for our analysis, as described below. Participants provided written informed consent for procedures approved by the Partners Human Research Institutional Review Board. Subject exclusion criteria were current use of psychotropic medications, full scale IQ <80, a current DSM-IV Axis I mood, psychotic or anxiety disorder (excluding simple phobias), any neurological disorder, any major sensorimotor handicaps, and current alcohol or substance abuse/dependence or a chronic history of abuse/dependence as defined by review of the Structured Clinical Interview for DSM-IV Axis I Disorders (SCID) (First et al. 2012).
MRI Acquisition
Functional and structural MRIs were acquired on a Siemens Tim Trio 3-Tesla scanner. The T2*-weighted fMRI (tapping task) scan was 8 min 10 s (TR = 3.34 s; TE = 30 ms; flip angle = 90°; FoV = 200 mm; 60-slice, interleaved acquisition; voxel size: 2.5 × 2.5 × 2.5 mm). The structural MRI used for coregistration was a T1-weighted MEMPRAGE sagittal scan (TR = 2.54 s; TE = 1.64/3.5/5.36/7.22 ms; flip angle = 7°; FoV = 256 mm; 176 slices; voxel size: 1.0 × 1.0 × 1.0 mm).
Tapping Task
Participants were instructed to keep their eyes open and to tap their right index finger rhythmically for about 8 min (unpaced) during the fMRI scan. The 8-min tapping duration differs from most rhythmic tapping studies that involve shorter trials aimed to minimize attentional fluctuations, but here we aimed to exploit attentional fluctuations using a longer trial. Tap timing was recorded from a button box. The target tempo of 600 ms per tap was indicated by a metronome during the first 10 s of the run. The metronome beeps were 40 ms sine waves at 450 Hz and were presented over headphones. Stimuli were presented and responses were recorded using Psychophysics Toolbox in Matlab (Brainard 1997).
Preprocessing and Analysis of Behavioral Data
The raw time series of intertap intervals (ITIs) was preprocessed to remove events that were likely related to motor performance issues (e.g., failed button presses) rather than attentional fluctuations. First, we removed extreme outliers in the global time series, defined as ITIs that were more than 50% away from the median ITI (i.e., lower and upper thresholds of ∼300 and 900 ms, respectively), consistent with previous work on rhythmic tapping (Semjen et al. 2000). Next, as a local correction to eliminate taps that were likely to be due to errors such as the subject's finger slipping off the button, we removed ITIs that were 30% greater or lesser than the previous ITI. The mean ± SD number of excluded taps per subject was 15.8 ± 13.9 (1.9 ± 1.7% of total taps). The mean ± SD number of included taps was 820.2 ± 76.3. Slight variations from the 30% local correction threshold did not significantly impact results. One subject had missing taps for periods lasting several seconds and was therefore removed from analysis.
The ITI deviance (z value) was calculated for each value in the preprocessed ITI time series by subtracting the mean then dividing by the standard deviation over time. As done previously, we converted the z values to absolute (positive) values so that both upward and downward fluctuations away from the mean would be considered to be variable behavior (Esterman et al. 2013, 2014; Rosenberg et al. 2013). The tap-variance time course (VTC) was downsampled to the “TR space” of the fMRI data; the mean of z values within a TR (typically from 5 to 6 taps) was assigned to that TR. This downsampled tap-VTC was used in fMRI analyses (see below). A summary of the conversion from ITI time course to tap-VTC is shown for a single subject as an example in Figure 1. In supplementary analyses, we investigated associations with tap speed, rather than variance, by retaining signed z values (i.e., no conversion to absolute value) in the ITI deviance time series before downsampling to TR space (see Supplementary Results andFig. 1).
Figure 1.

Single-subject example of fluctuations in tapping behavior. (A) The preprocessed time course of intertap intervals (see Methods). Subjects attempted to tap continuously at a constant rate, every 600 ms. (B) The tap-VTC, showing the deviation of each intertap interval from the mean of all intertap intervals. (C) The tap-VTC, downsampled to the space of acquired fMRI volumes (TRs, every 3.34 s). (D) The tap-SD time course, showing the standard deviation of intertap intervals within a 10 s window surrounding each TR. TR, repetition time.
Notably, tap-deviance scores may not capture behavioral variability if the mean ITI changes over the course of the task. This could be particularly problematic for participants with linear, or nonlinear, drifts in mean ITI over time. Therefore, we used an alternative, confirmatory approach to assess short time-scale variability that was not dependent on the overall ITI mean. At each TR of the scan, we calculated the standard deviation of ITIs within a 10-s window surrounding the TR (including 3.33 and 6.67 s from taps preceding and following the TR stamp time, respectively). We then calculated Pearson's correlation between this tap-SD time course with the tap-VTC. Participants with noticeable drifts in their raw ITI time course showed poor correlation between tap-SD and tap-VTC. We set a cutoff such that 3 participants with a correlation of r < 0.2 between these time courses were excluded from analyses, because their tap-variance patterns were difficult to estimate and dependent on the metric used. The cutoff of r< 0.2 allowed us to retain a sample size similar to that in previous work linking continuous variation in reaction time with brain activity (Esterman et al. 2013, 2014) while removing subjects in whom we could not confidently characterize tap variance over time with our approach. Notably, our fMRI findings revealed very similar results when using the tap-SD instead of the tap-VTC time course (data not shown).
fMRI Data Preprocessing and Head Motion Correction
For 18 subjects, the first 3 fMRI volumes, acquired while the metronome was on, were deleted. For 1 subject, 5 volumes were deleted, as the subject began tapping behavior approximately 4 s after metronome offset. Using FSL v5.0.7 (Jenkinson et al. 2012), brain extraction (BET), realignment of each volume to the middle volume (MCFLIRT), and spatial smoothing (6-mm full width at half-maximum kernel) were performed. We then submitted the data to ICA-AROMA, an automated tool for motion-artifact removal, shown to improve sensitivity and specificity of fMRI activation and connectivity analyses (Pruim, Mennes, Buitelaar, et al. 2015; Pruim, Mennes, van Rooij, et al. 2015). Briefly, this involved running independent components analysis (ICA, with automatic dimensionality estimation using MELODIC), identification of motion-relevant components (based on correlation with realignment parameters, spatial content in CSF and edge voxels, and high-frequency temporal content), and regression of the motion-relevant components out of the data. Finally, a high-pass (0.01 Hz cutoff) temporal filter was applied. Functional MRI data were registered to T1 and standard MNI152 space using linear transformations (FLIRT) with 6 and 12 df, respectively.
To further ensure that brain activity effects related to behavioral variance could not be explained by head motion, we calculated Pearson's correlations between the tap-VTC and absolute values of each of the 6 motion parameters obtained with MCFLIRT within each subject. There were no strong or systematic correlations between any of the motion parameters and tap variance (mean ± SD r across subjects for each motion parameter, x: 0.12 ± 0.17, y: 0.07 ± 0.15, z: 0.07 ± 0.18, pitch: 0.06 ± 0.17, roll: 0.08 ± 0.11, yaw: 0.09 ± 0.13). There were also no correlations across subjects of mean relative frame-wise displacement with the ITI mean (r=−0.15, P = 0.54), standard deviation (r = 0.06, P = 0.82), or coefficient of variation (r = 0.14, P = 0.57).
fMRI Activation Analysis
A first-level (single-subject) general linear model (GLM) analysis was performed in FSL with FILM prewhitening. The tap-VTC, convolved with a gamma hemodynamic response function, was entered as a regressor. Resulting single-subject parametric maps were submitted to second (group-level) GLM in standard space with 2 contrasts to identify regional activation associated with 1) increasing tap variance; 2) decreasing tap variance. Group-level analyses were performed in the FLAME1 + 2 mixed-effects framework and with whole-brain, voxelwise correction for multiple comparisons (significance: FWE-corrected Z> 2.3; cluster-based P< 0.05).
Seed Definition
Given our hypothesized role of the DMN in attentional fluctuations, we sought to relate behavioral variability with dynamic FC of key DMN nodes. Both the anterior mPFC and PCC/PCu are considered core/hub regions within the DMN (Andrews-Hanna et al. 2010), and both of these regions showed significant relationships with decreasing tap variance in our regional activation analysis (Fig. 2), consistent with previous work with cognitive tasks (Esterman et al. 2013, 2014). We therefore defined seed regions in both the mPFC and PCC/PCu. To create these seeds, and to ensure that they were within the DMN, we multiplied our significant activation maps of regions tracking decreasing tap variance by a binary gray matter map of the DMN that was defined independently in a cohort of 1000 healthy subjects (Yeo et al. 2011). We then drew 6-mm diameter spheres around peak MNI152 coordinates in the mPFC (xyz = 6, 66, 4) and PCC/PCu (xyz = 10, −46, 30) from the resulting maps (Fig. 3). The analyses with these 2 DMN seeds were treated as confirmatory of one another, rather than independent, since there was no a priori reason to believe their dynamic connectivity would be distinguishable from one another.
Figure 2.

Brain regions showing activation that correlates positively (top) and negatively (bottom) with tap variance (family-wise error-corrected Z > 2.3, cluster-based P < 0.05). Higher tap variance (out-of-the-zone attention) was associated with activation within regions of the dorsal-attention and salience networks. Lower tap variance (in-the-zone attention) was associated with activation within regions of the default mode network. aINS, anterior insula; FEF, frontal eye fields; MCC, mid-cingulate cortex; mPFC, medial prefrontal cortex; PCC, posterior cingulate cortex; PCu, precuneus; SPL, superior parietal lobule.
Figure 3.
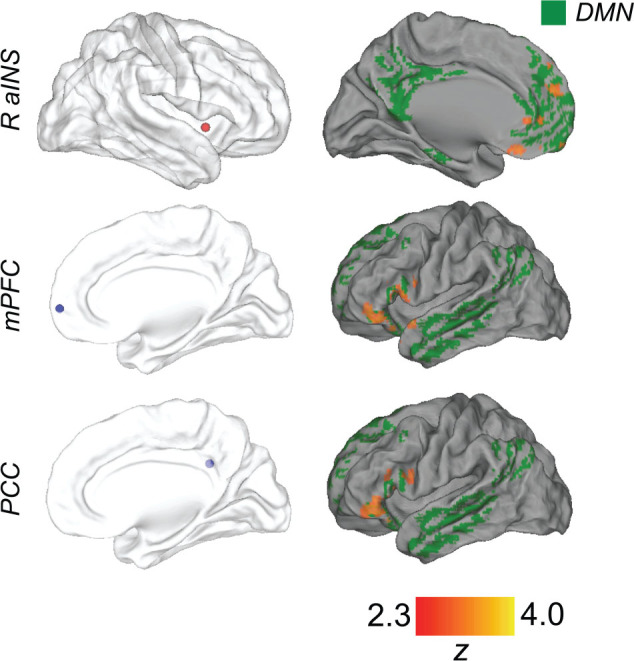
Brain regions showing dynamic functional connectivity associated with ongoing fluctuations in tap variance. For each seed (left column), regions showing functional connectivity that positively correlated with tap variance are shown in red/yellow (family-wise error-corrected Z > 2.3, cluster-based P < 0.05). These regions are overlaid on an independently defined map of the default mode network (Yeo et al. 2011) in green to highlight that all significant clusters substantially overlapped with this network.
Dynamic FC of the right anterior insula (R-aINS; part of the salience/ventral attention network; Seeley et al. 2007; Yeo et al. 2011) was also of specific interest, because evidence indicates that this region functions as a “causal outflow hub” that coordinates interactions among attention-relevant brain networks including the DMN (Uddin 2015). Additionally, our activation analysis revealed that the R-aINS was a prominent region showing a significant relationship with increasing tap variance (Fig. 2). Therefore, we examined the R-aINS as a seed outside the DMN. To define the R-aINS, we multiplied our significant activation map of regions tracking increasing tap variance by the insula region defined anatomically within the Harvard-Oxford probabilistic atlas (thresholded at 50% and binarized). We then drew a 6-mm diameter sphere around peak MNI152 coordinates in the R-aINS (xyz = 40, 8, 0) from the resulting map (Fig. 3). Confirming correct network affiliation of the R-aINS seed, these coordinates overlapped with the previously defined salience/ventral attention network (Yeo et al. 2011).
We ran an additional control analysis with a seed within the sensorimotor network. A lack of relationship between sensorimotor FC and tapping variability would indicate some specificity of our findings to attentional networks. We particularly chose a region within the left sensorimotor cortex, in the vicinity of right index finger representation, to account for FC fluctuations that could be related to sensorimotor rather than attentional aspects of tapping variability. We defined the left sensorimotor seed using an atlas of intrinsic connectivity networks, based on healthy adults, that contains individual clusters within networks (Shirer et al. 2012). We drew a 6-mm diameter sphere around center-of-gravity coordinates (MNI152 xyz = −34, −20, 60) of the left, lateral cluster within the sensorimotor cortex.
Dynamic Functional Connectivity Analysis
Each seed was linearly transformed from standard to native space using the previously computed linear transform. The mean time course across voxels of each seed was extracted from the preprocessed data. To assess FC with the seed that dynamically tracks tap variance, a psychophysiological interaction (PPI) (Friston et al. 1997) analysis on the preprocessed data was conducted within the GLM framework with FILM prewhitening. In PPI, the whole brain is searched for regions whose covarying activity with that of a chosen seed region depends on the occurrence of a certain behavior/psychological event. Three regressors were included: 1) the tap-VTC, convolved with a gamma hemodynamic response function; 2) the seed time course; 3) the interaction between the tap-VTC and seed time course (mean centered). Group-level whole-brain analyses were performed in standard space to identify regions with positive and negative interactions between the tap-VTC and seed time- course (FLAME1 + 2; significance: FWE-corrected Z> 2.3; cluster-based P< 0.05).
For display and explanatory purposes only, in the fMRI dynamic FC analyses, we split the tap-VTC into high variance (out-of-the-zone) and low variance (in-the-zone) periods, as done previously with cognitive task reaction time data (Esterman et al. 2013, 2014). To do this, we smoothed the tap-VTC integrating information from 26 surrounding taps (Gaussian kernel of ∼16 s full width at half-maximum). We then binarized the smoothed tap-VTC into high and low variance using a median split.
Notably, in the PPI approach, the time course of the seed region is included as a regressor and is thus inherently controlled for (O'Reilly et al. 2012). Consequently, the approach is highly conservative, and in this context, only FC dynamics that are fully independent of seed activation, yet track fluctuations in behavioral variability, would appear as significant. Despite the risk of false-negative results, we chose PPI so that we could 1) continuously track FC that fluctuates with behavior and 2) dissociate effects related to activation versus connectivity. While sliding window analysis is commonly used in dynamic FC analysis, that approach in our context would have involved substantial downsampling of both the behavioral and fMRI data and thus a loss of precision and sensitivity. Dynamic FC has been defined as spontaneous, time-varying coordination of activity between regions on time scales ranging from milliseconds to seconds (Hutchison, Womelsdorf, Allen, et al. 2013). The PPI approach is not typically used in the literature on dynamic FC, because previous studies have not typically included continuous measures of spontaneous behavior. However, using our continuous measure of tapping variability with PPI analysis here provides a powerful approach to assessing the behavioral relevance of dynamic FC.
Network Labeling
We anatomically mapped the significant cortical and cerebellar regions from activation and FC analyses to known brain networks. To do so, we overlaid the regions with network templates that were defined independently in previous studies in large samples of healthy adults (Buckner et al. 2011; Yeo et al. 2011). In those studies, both 7- and 17-network parcellations were derived. We refer mainly to the 7-network parcellation in which the DMN is a single network, but where relevant, we also refer to the 17-network version in which the DMN splits into separate subsystems.
Results
Local Brain Activation Correlates of Spontaneous Fluctuations in Attention
At the group level, greater tap variance (out-of-the-zone attention) was associated with greater brain activation in bilateral cortical regions that were largely within areas that mapped on to the dorsal-attention and salience networks (Fig. 2). These included the aINS, mid-cingulate cortex, frontal eye fields, superior parietal lobule, supplementary motor area, and middle temporal gyrus. Additionally, parts of the cerebellum, including parts of lobules V/VI bilaterally, and a part of left lobule VII/VIII that maps on to dorsal-attention and salience networks (Buckner et al. 2011) tracked greater tap variance.
In contrast, lower tap variance (in-the-zone attention) was associated with greater brain activation in cortical areas known to be core regions of the DMN. These included the anterior and ventral mPFC, the PCC/PCu, and an area of right dorsolateral prefrontal cortex that maps on to the DMN (Yeo et al. 2011). At the cluster-uncorrected (Z > 2.3) level, bilateral parts of the cerebellum (within crus I/II) that exclusively mapped on to the DMN (Buckner et al. 2011) tracked lower tap variance.
Dynamic Functional Connectivity Correlates of Spontaneous Fluctuation in Attention
Both DMN core seeds (mPFC and PCC) showed increased FC associated with greater tap variance to a common cluster encompassing the left lateral frontal pole and inferior frontal gyrus (Fig. 3). This cluster was 8128 and 9032 mm3 in total volume for mPFC and PCC seeds, respectively, and overlapped substantially with the DMN (shown in green in Fig. 3). Overlay with a 17-network cortical parcellation revealed that the region was specifically part of the “dorsomedial prefrontal” subsystem of the DMN (Andrews-Hanna et al. 2010; Yeo et al. 2011). For both DMN core seeds, no regions showed a significant effect for greater FC associated with lower tap variance. In summary, increased core DMN to lateral dmPFC subsystem connectivity was associated with higher tap variance.
The R-aINS showed increased FC associated with greater tap variance to a cluster that was largely within the mPFC (included anterior, ventral and dorsal mPFC, as well as perigenual cingulate) (Fig. 3). This cluster, 9263 mm3 in total volume, overlapped substantially with the DMN. No regions showed a significant effect for greater R-aINS FC associated with lower tap variance. Thus, increased salience network (R-aINS) to DMN (mPFC) connectivity was associated with higher tap variance. The left sensorimotor (control) seed showed no significant FC associated with tap variance (and this region did not show significant activation associated with tap variance).
The dynamic FC relationships with behavior identified with PPI could have been driven by several possible mechanisms. To illustrate the possible combinations of positive and negative FC that relate to behavior in different subjects, we binarized the tap-VTC into high (out-of-the-zone) and low (in-the-zone) tap variance periods. In Figure 4, we show the time courses of the R-aINS (seed region) and mPFC (6-mm diameter sphere drawn around peak coordinates identified in R-aINS PPI analysis) as a function of the zones in 2 example subjects. One subject (top) shows negative aINS-mPFC FC when in-the-zone but shows no (zero) FC when out-of-the-zone, whereas another subject (bottom) shows no (zero) FC when in-the-zone, but positive FC (increased coupling) when out-of-the-zone. Therefore, both of these subjects show increases in FC values when out-of-the-zone, but the increases are driven by different combinations of positive and negative FC between zones.
Figure 4.

Examples of normalized time courses of the right anterior insula (R-aINS, red) and medial prefrontal cortex (mPFC, blue) as a function of attentional state (zone) for 2 participants. The zones (shaded colors) were defined based on a median split of the smoothed tap-VTC (see Methods). Time points between zone changes are not shaded, because they represent transitions where zone classification is ambiguous. The Pearson's correlation values were based on concatenated time points across the shaded segments, separately for in-the-zone and out-of-the-zone periods. BOLD, blood oxygen-level dependent; TR, repetition time.
Discussion
Continuous fluctuations in attention are a fundamental feature of human behavior and experience. However, the potential association between attentional fluctuations and transient interactions within and between neural networks has been unknown. Here, through the study of ongoing behavioral variability, we provide novel mechanistic data on the neural dynamics of everyday, moment-to-moment attentional fluctuations (Fig. 5).
Figure 5.

Summary of activation and dynamic functional connectivity that relates to continuous variability in attention. Out-of-the-zone and in-the-zone correspond to activity and connectivity that correlates with increasing (orange) and decreasing (blue) degrees of absolute tap variance, respectively. dmPFC, dorsomedial prefrontal cortex; mPFC, medial prefrontal cortex; R-aINS, right anterior insula.
Continuous variability in finger tapping was marked by activity fluctuations in attention-relevant networks. Consistent with studies of cognitive tasks requiring sustained attention (Esterman et al. 2013, 2014), low behavioral variability (in-the-zone attention) was associated with DMN activation, whereas high variability (out-of-the-zone) was associated with activation of dorsal-attention and salience network regions. More importantly, our novel analysis of dynamic FC during ongoing behavioral variability revealed insights into brain network communication mechanisms of spontaneous attentional fluctuations. Increasing out-of-the-zone attention was tracked by either greater coupling or reduced anticorrelation of core DMN regions (PCC, mPFC) with salience network (aINS) and DMN subsystem areas. These findings significantly advance our understanding of the behavioral relevance of spontaneous FC dynamics. In all states of waking life involving attentional fluctuations, these neural-network dynamics could underpin waxing and waning of focus to the sensory environment and to stimulus-independent thought.
Behavioral Relevance of Dynamic Functional Connectivity
Since the first fMRI report of dynamic FC in spontaneous activity (Chang and Glover 2010), studies on the topic have largely focused on detecting, characterizing (Allen et al. 2014; Lindquist et al. 2014; Shine et al. 2015), and establishing the electrophysiological basis of (Tagliazucchi et al. 2012; Chang et al. 2013) dynamic FC. However, it has been shown that dynamic FC fluctuations in fMRI that correspond to neural activity are difficult to disentangle from properties of the signal that do not reflect neural activity (Handwerker et al. 2012; Keilholz et al. 2013; Hindriks et al. 2015).
Measurable behavioral outputs present an opportunity to validate the use of fMRI to assess dynamic FC but have rarely been studied in this context. Some previous work has given clues to the behavioral relevance of dynamic FC. For example, summary metrics based on dynamic FC correlate with interindividual differences in behavior (Kucyi et al. 2013; Kucyi and Davis 2014; Yang et al. 2014) and show differences between clinical or skilled expert groups and cognitively normal individuals (Jones et al. 2012; Damaraju et al. 2014; Shen, Li, et al. 2015). Such associations suggest a behavioral relevance of dynamic FC properties but do not reveal the significance of moment-to-moment changes in spontaneous FC.
Studies that uncovered some behavioral relevance of moment-to-moment dynamic FC have shown intraindividual effects of task compared with resting states (Chen et al. 2015; Elton and Gao 2015) and consciousness states induced by anesthesia (Hutchison et al. 2014; Barttfeld et al. 2015) or psychedelic agents (Tagliazucchi et al. 2014). On a more fine-grained time scale, spontaneous intraindividual FC fluctuations during prestimulus periods were shown to predict subsequent performance and perceptual outcomes (Ploner et al. 2010; Thompson et al. 2013; Weisz et al. 2014; Sadaghiani et al. 2015). Such FC fluctuations could reflect ongoing changes in attentional state, but fine-scaled behavioral measurements would be needed for confirmation.
Thus, we investigated the behavioral relevance of spontaneous FC fluctuations on a continuous basis without using predefined time windows. As attention fluctuated to an out-of-the-zone state, FC values increased between the R-aINS and the mPFC. The 2 corresponding networks (salience and DMN, respectively) of these regions, on average, show anticorrelated activity at rest (Fox et al. 2005; Kucyi et al. 2012). Static FC shows that across individuals, reduced intrinsic anticorrelated activity between these networks correlates with greater variability in cognitive performance (Kelly et al. 2008). Similarly, dynamic FC shows that transient periods of reduced anticorrelated activity precedes slower attentional task performance (Thompson et al. 2013) and relates to mind-wandering (Mittner et al. 2014). Thus, previous work is in line with our finding that spontaneous increases in FC (or decreases in anticorrelation) between DMN and salience network regions relate to out-of-the-zone attentional states. Sustained anticorrelated activity between the salience network and DMN may be needed to maintain stable, focused performance (e.g., during in-the-zone attention). Indeed, it was recently shown that FC between the R-aINS and DMN increased during task switching events that may reflect destabilization of attention (Jilka et al. 2014).
We also found increased within-DMN FC during out-of-the-zone attention. Specifically, increased behavioral variability correlated with increased FC of DMN core regions (PCC and mPFC) with lateral prefrontal areas within the DMN's dmPFC subsystem. Of note, as DMN FC and activation are not equivalent to one another in terms of functional significance (Anticevic et al. 2012; Whitfield-Gabrieli and Ford 2012), this FC result does not contradict our finding that DMN activation tracks in-the-zone attention. The dmPFC subsystem of the DMN is engaged during self-relevant decisions about the present, whereas a distinct medial temporal lobe-based subsystem of the DMN is engaged in past- and future-oriented thought (Andrews-Hanna et al. 2010). Coactivation of DMN core with dmPFC subsystem regions could facilitate information flow to the medial temporal lobe subsystem to integrate self-related decisions about the present into memory and mental simulation. This type of cognition could be prevalent during out-of-the-zone attentional states where focus may drift toward self-generated thoughts. A study showing increases in within-DMN FC during mind-wandering (Mittner et al. 2014) supports this possibility.
Behavioral and Brain Activation Markers of Spontaneous Attentional Fluctuations
Traditionally, psychological and neuroimaging studies have treated intraindividual variability in cognitive performance as noise. However, recent studies link intrinsic variability in behavioral performance with activation within the DMN, dorsal-attention, and salience networks (Weissman et al. 2006; Boly et al. 2007; Eichele et al. 2008; Sadaghiani et al. 2009). Esterman et al. (2013) developed an approach of using a continuous VTC, adopted here, to dynamically capture intrinsic fluctuations in attention and their neural correlates. Existing studies using that approach involved continuous performance tasks with changing visual stimuli and cognitive demands (Esterman et al. 2013, 2014; Rosenberg et al. 2015) and could be confounded by processes such as response inhibition and error monitoring, independent of attention. We show that ongoing variability in simple finger tapping correlates with DMN, dorsal-attention, and salience network activation patterns that are strikingly similar to those observed with more complex cognitive tasks (Esterman et al. 2013, 2014; Rosenberg et al. 2015). This similarity, combined with a large body of evidence for roles of these attention-relevant networks (Corbetta and Shulman 2002; Buckner et al. 2008), strongly suggests that fluctuations in tapping variability mark attentional state changes. We did not find that either prominent activations in or FC of sensorimotor regions were associated with tapping variability, further suggesting that we captured attentional rather than motor-related aspects of tapping behavior.
Notably, however, finger tapping is not typically considered a sustained attention task. While an attentional component is acknowledged, emphasis is often placed on motor and timing components of tapping (Repp 2005; Repp and Su 2013). We suggest that variance in finger tapping reflects attention similarly to reaction time variance in continuous performance cognitive tasks. Increasing attentional load with a concomitant working memory task results in increased tapping variability (Pecenka et al. 2013). Spontaneous fluctuations in attention toward internal, self-generated thoughts could have similar “load” effects on tapping variability.
Interestingly, previous studies provide clues to the relationship between tapping variability and attention-relevant networks. During metronome-paced tapping, DMN regions show greatest activation when the metronome is easier to synchronize with and performance is better (Fairhurst et al. 2013). The authors referred to that state as “in the groove,” comparable to “in-the-zone,” as associated with DMN activation here. In another study, DMN activation was greatest when subjects tapped to predicted, rather than tracked, metronome changes (Pecenka et al. 2013), a behavior that could require in-the-zone attention.
Relationship Between Attention “Zones” and Mind-Wandering
Humans spend roughly half of their waking life engaged in spontaneous cognition unrelated to immediate sensory stimuli (Killingsworth and Gilbert 2010). Such mind-wandering can be assessed with self-report, which may validate the occurrence of spontaneous attentional fluctuations (Smallwood and Schooler 2015). Self-reported mind-wandering has been associated with concurrent increased performance variability (McVay and Kane 2009; Stawarczyk et al. 2011; Seli et al. 2013). It is thus plausible that out-of-the-zone (high behavioral variability) periods are generally associated with more mind-wandering.
The neural correlates of attentional fluctuations, identified here, thus raise questions. While the dynamic FC correlates of out-of-the-zone attention share some properties with FC “signatures” of mind-wandering (Mittner et al. 2014), the activations are in seeming contradiction. Mind-wandering is associated with increased DMN and decreased salience network activation (Christoff et al. 2009; Kucyi et al. 2013). How, then, can out-of-the-zone attention, as identified here and elsewhere (Esterman et al. 2013, 2014; Rosenberg et al. 2015), be associated with the opposite activation pattern?
One possibility, as previously suggested (Esterman et al. 2013), is that increased DMN activation during in-the-zone attention represents less effortful, stable performance, but excessive increases in DMN activation represent attentional lapses and mind-wandering. This is supported by the fact that transient DMN activation precedes task errors (lapses) (Weissman et al. 2006; Esterman et al. 2013), even though fewer errors occur overall during stable, in-the-zone states (Esterman et al. 2013).
It is also possible that relationships of mind-wandering and behavioral variability with DMN activity are independent of one another. Future studies are needed to reconcile the roles of the DMN in mind-wandering and behaviorally measured attentional fluctuations. One promising avenue is multivariate pattern analysis, which can reveal subtle features of DMN activity relating to attention zones (Rosenberg et al. 2015) and mind-wandering (Mittner et al. 2014; Tusche et al. 2014). Additional measures of spontaneous behavior, such as eye movements and pupil diameter fluctuations, may be valuable in uncovering the role of the DMN in attentional dynamics (Ramot et al. 2011; Yellin et al. 2015).
Conclusions and Future Directions
We present novel evidence that activation and dynamic FC of attention-relevant brain networks track ongoing fluctuations in the variability of rhythmic finger tapping. Our work reveals the importance of dynamic FC to behavior and specifically to spontaneous fluctuations in attention. Individual differences in attentional abilities have recently been linked with mean FC patterns defined over the course of several minutes (Rosenberg et al. 2016). Our work should spur much needed research into how individual differences in attentional fluctuations are reflected in FC on finer time scales, and into the neural mechanisms of conditions, such as attention-deficit/hyperactivity disorder (Sonuga-Barke and Castellanos 2007) and chronic pain (Kucyi and Davis 2015), that may be characterized by disordered attentional fluctuations.
Supplementary Material
Supplementary material can be found at: http://www.cercor.oxfordjournals.org/.
Funding
This work was supported by grants from Canadian Institutes of Health Research (Fellowship Award to AK, Banting Postdoctoral Fellowship to R.M.H.), from the National Institute of Health R01 HD067744-01A1 (to E.M.V.) and T32 MH16259 (to M.J.H.), from the Athinoula A. Martinos Center for Biomedical Imaging, NCRR P41RR14075 and P41 EB015896, and from a VA Clinical Science R&D Career Development Award (to M.E.) (1IK2CX000706-01A2).
Supplementary Material
Notes
This work was performed at Athinoula A. Martinos Center for Biomedical Imaging, Massachusetts General Hospital. Conflict of Interest: None declared.
References
- Allen EA, Damaraju E, Plis SM, Erhardt EB, Eichele T, Calhoun VD. 2014. Tracking whole-brain connectivity dynamics in the resting state. Cereb Cortex. 24:663–676. [DOI] [PMC free article] [PubMed] [Google Scholar]
- Andrews-Hanna JR, Reidler JS, Sepulcre J, Poulin R, Buckner RL. 2010. Functional-anatomic fractionation of the brain's default network. Neuron. 65:550–562. [DOI] [PMC free article] [PubMed] [Google Scholar]
- Anticevic A, Cole MW, Murray JD, Corlett PR, Wang XJ, Krystal JH. 2012. The role of default network deactivation in cognition and disease. Trends Cogn Sci. 16:584–592. [DOI] [PMC free article] [PubMed] [Google Scholar]
- Barttfeld P, Uhrig L, Sitt JD, Sigman M, Jarraya B, Dehaene S. 2015. Signature of consciousness in the dynamics of resting-state brain activity. Proc Natl Acad Sci USA. 112:887–892. [DOI] [PMC free article] [PubMed] [Google Scholar]
- Biswal B, Yetkin FZ, Haughton VM, Hyde JS. 1995. Functional connectivity in the motor cortex of resting human brain using echo-planar MRI. Magn Reson Med. 34:537–541. [DOI] [PubMed] [Google Scholar]
- Boly M, Balteau E, Schnakers C, Degueldre C, Moonen G, Luxen A, Phillips C, Peigneux P, Maquet P, Laureys S. 2007. Baseline brain activity fluctuations predict somatosensory perception in humans. Proc Natl Acad Sci USA. 104:12187–12192. [DOI] [PMC free article] [PubMed] [Google Scholar]
- Brainard DH. 1997. The Psychophysics Toolbox. Spat Vis. 10:433–436. [PubMed] [Google Scholar]
- Buckner RL, Andrews-Hanna JR, Schacter DL. 2008. The brain's default network: anatomy, function, and relevance to disease. Ann N Y Acad Sci. 1124:1–38. [DOI] [PubMed] [Google Scholar]
- Buckner RL, Krienen FM, Castellanos A, Diaz JC, Yeo BT. 2011. The organization of the human cerebellum estimated by intrinsic functional connectivity. J Neurophysiol. 106:2322–2345. [DOI] [PMC free article] [PubMed] [Google Scholar]
- Calhoun VD, Miller R, Pearlson G, Adali T. 2014. The chronnectome: time-varying connectivity networks as the next frontier in fMRI data discovery. Neuron. 84:262–274. [DOI] [PMC free article] [PubMed] [Google Scholar]
- Chang C, Glover GH. 2010. Time-frequency dynamics of resting-state brain connectivity measured with fMRI. NeuroImage. 50:81. [DOI] [PMC free article] [PubMed] [Google Scholar]
- Chang C, Liu Z, Chen MC, Liu X, Duyn JH. 2013. EEG correlates of time-varying BOLD functional connectivity. NeuroImage. 72:227–236. [DOI] [PMC free article] [PubMed] [Google Scholar]
- Chen JE, Chang C, Greicius MD, Glover GH. 2015. Introducing co-activation pattern metrics to quantify spontaneous brain network dynamics. Neuroimage. 111:476–488. [DOI] [PMC free article] [PubMed] [Google Scholar]
- Christoff K, Gordon AM, Smallwood J, Smith R, Schooler JW. 2009. Experience sampling during fMRI reveals default network and executive system contributions to mind wandering. Proc Natl Acad Sci USA. 106:8719–8724. [DOI] [PMC free article] [PubMed] [Google Scholar]
- Corbetta M, Shulman GL. 2002. Control of goal-directed and stimulus-driven attention in the brain. Nat Rev Neurosci. 3:201–215. [DOI] [PubMed] [Google Scholar]
- Damaraju E, Allen EA, Belger A, Ford JM, McEwen S, Mathalon DH, Mueller BA, Pearlson GD, Potkin SG, Preda A et al. 2014. Dynamic functional connectivity analysis reveals transient states of dysconnectivity in schizophrenia. Neuroimage Clin. 5:298–308. [DOI] [PMC free article] [PubMed] [Google Scholar]
- Eichele T, Debener S, Calhoun VD, Specht K, Engel AK, Hugdahl K, von Cramon DY, Ullsperger M. 2008. Prediction of human errors by maladaptive changes in event-related brain networks. Proc Natl Acad Sci USA. 105:6173–6178. [DOI] [PMC free article] [PubMed] [Google Scholar]
- Elton A, Gao W. 2015. Task-related modulation of functional connectivity variability and its behavioral correlations. Hum Brain Mapp. 36:3260–3272. [DOI] [PMC free article] [PubMed] [Google Scholar]
- Esterman M, Noonan SK, Rosenberg M, Degutis J. 2013. In the zone or zoning out? Tracking behavioral and neural fluctuations during sustained attention. Cereb Cortex. 23:2712–2723. [DOI] [PubMed] [Google Scholar]
- Esterman M, Rosenberg MD, Noonan SK. 2014. Intrinsic fluctuations in sustained attention and distractor processing. J Neurosci. 34:1724–1730. [DOI] [PMC free article] [PubMed] [Google Scholar]
- Fairhurst MT, Janata P, Keller PE. 2013. Being and feeling in sync with an adaptive virtual partner: brain mechanisms underlying dynamic cooperativity. Cereb Cortex. 23:2592–2600. [DOI] [PubMed] [Google Scholar]
- First MB, Spitzer RL, Gibbon M, Williams JB. 2012. Structured Clinical Interview for DSM-IV® Axis I Disorders (SCID-I), Clinician Version, Administration Booklet. New York: American Psychiatric Publishing. [DOI] [PubMed]
- Fox MD, Snyder AZ, Vincent JL, Corbetta M, Van EDC, Raichle ME. 2005. The human brain is intrinsically organized into dynamic, anticorrelated functional networks. Proc Natl Acad Sci USA. 102:9673–9678. [DOI] [PMC free article] [PubMed] [Google Scholar]
- Friston KJ, Buechel C, Fink GR, Morris J, Rolls E, Dolan RJ. 1997. Psychophysiological and modulatory interactions in neuroimaging. NeuroImage. 6:218–229. [DOI] [PubMed] [Google Scholar]
- Gonzalez-Castillo J, Hoy CW, Handwerker DA, Robinson ME, Buchanan LC, Saad ZS, Bandettini PA. 2015. Tracking ongoing cognition in individuals using brief, whole-brain functional connectivity patterns. Proc Natl Acad Sci USA. 112:8762–8767. [DOI] [PMC free article] [PubMed] [Google Scholar]
- Handwerker DA, Roopchansingh V, Gonzalez-Castillo J, Bandettini PA. 2012. Periodic changes in fMRI connectivity. NeuroImage. 63:1712–1719. [DOI] [PMC free article] [PubMed] [Google Scholar]
- Hindriks R, Adhikari MH, Murayama Y, Ganzetti M, Mantini D, Logothetis NK, Deco G. 2015. Can sliding-window correlations reveal dynamic functional connectivity in resting-state fMRI? Neuroimage. 127:242–256. [DOI] [PMC free article] [PubMed] [Google Scholar]
- Hutchison RM, Hutchison M, Manning KY, Menon RS, Everling S. 2014. Isoflurane induces dose-dependent alterations in the cortical connectivity profiles and dynamic properties of the brain's functional architecture. Hum Brain Mapp. 35:5754–5775. [DOI] [PMC free article] [PubMed] [Google Scholar]
- Hutchison RM, Womelsdorf T, Allen EA, Bandettini PA, Calhoun VD, Corbetta M, Della Penna S, Duyn JH, Glover GH, Gonzalez-Castillo J et al. 2013. Dynamic functional connectivity: promise, issues, and interpretations. NeuroImage. 80:360–378. [DOI] [PMC free article] [PubMed] [Google Scholar]
- Hutchison RM, Womelsdorf T, Gati JS, Everling S, Menon RS. 2013. Resting-state networks show dynamic functional connectivity in awake humans and anesthetized macaques. Hum Brain Mapp. 34:2154–2177. [DOI] [PMC free article] [PubMed] [Google Scholar]
- Jenkinson M, Beckmann CF, Behrens TE, Woolrich MW, Smith SM. 2012. FSL. NeuroImage. 62:782–790. [DOI] [PubMed] [Google Scholar]
- Jilka SR, Scott G, Ham T, Pickering A, Bonnelle V, Braga RM, Leech R, Sharp DJ. 2014. Damage to the Salience Network and interactions with the Default Mode Network. J Neurosci. 34:10798–10807. [DOI] [PMC free article] [PubMed] [Google Scholar]
- Jones DT, Vemuri P, Murphy MC, Gunter JL, Senjem ML, Machulda MM, Przybelski SA, Gregg BE, Kantarci K, Knopman DS et al. 2012. Non-stationarity in the “resting brain's” modular architecture. PLoS One. 7:e39731. [DOI] [PMC free article] [PubMed] [Google Scholar]
- Keilholz SD, Magnuson ME, Pan WJ, Willis M, Thompson GJ. 2013. Dynamic properties of functional connectivity in the rodent. Brain Connect. 3:31–40. [DOI] [PMC free article] [PubMed] [Google Scholar]
- Kelly AM, Uddin LQ, Biswal BB, Castellanos FX, Milham MP. 2008. Competition between functional brain networks mediates behavioral variability. Neuroimage. 39:527–537. [DOI] [PubMed] [Google Scholar]
- Killingsworth MA, Gilbert DT. 2010. A wandering mind is an unhappy mind. Science. 330:932. [DOI] [PubMed] [Google Scholar]
- Kucyi A, Davis KD. 2014. Dynamic functional connectivity of the default mode network tracks daydreaming. NeuroImage. 100C:471–480. [DOI] [PubMed] [Google Scholar]
- Kucyi A, Davis KD. 2015. The dynamic pain connectome. Trends Neurosci. 38:86–95. [DOI] [PubMed] [Google Scholar]
- Kucyi A, Hodaie M, Davis KD. 2012. Lateralization in intrinsic functional connectivity of the temporoparietal junction with salience- and attention-related brain networks. J Neurophysiol. 108:3382–3392. [DOI] [PubMed] [Google Scholar]
- Kucyi A, Salomons TV, Davis KD. 2013. Mind wandering away from pain dynamically engages antinociceptive and default mode brain networks. Proc Natl Acad Sci USA. 110:18692–18697. [DOI] [PMC free article] [PubMed] [Google Scholar]
- Lindquist MA, Xu Y, Nebel MB, Caffo BS. 2014. Evaluating dynamic bivariate correlations in resting-state fMRI: a comparison study and a new approach. Neuroimage. 101:531–546. [DOI] [PMC free article] [PubMed] [Google Scholar]
- Liu X, Duyn JH. 2013. Time-varying functional network information extracted from brief instances of spontaneous brain activity. Proc Natl Acad Sci USA. 110:4392–4397. [DOI] [PMC free article] [PubMed] [Google Scholar]
- McVay JC, Kane MJ. 2009. Conducting the train of thought: working memory capacity, goal neglect, and mind wandering in an executive-control task. J Exp Psychol Learn Mem Cogn. 35:196–204. [DOI] [PMC free article] [PubMed] [Google Scholar]
- Mittner M, Boekel W, Tucker AM, Turner BM, Heathcote A, Forstmann BU. 2014. When the brain takes a break: a model-based analysis of mind wandering. J Neurosci. 34:16286–16295. [DOI] [PMC free article] [PubMed] [Google Scholar]
- O'Reilly JX, Woolrich MW, Behrens TE, Smith SM, Johansen-Berg H. 2012. Tools of the trade: psychophysiological interactions and functional connectivity. Soc Cogn Affect Neurosci. 7:604–609. [DOI] [PMC free article] [PubMed] [Google Scholar]
- Palva JM, Palva S. 2012. Infra-slow fluctuations in electrophysiological recordings, blood-oxygenation-level-dependent signals, and psychophysical time series. Neuroimage. 62:2201–2211. [DOI] [PubMed] [Google Scholar]
- Pecenka N, Engel A, Keller PE. 2013. Neural correlates of auditory temporal predictions during sensorimotor synchronization. Front Hum Neurosci. 7:380. [DOI] [PMC free article] [PubMed] [Google Scholar]
- Ploner M, Lee MC, Wiech K, Bingel U, Tracey I. 2010. Prestimulus functional connectivity determines pain perception in humans. Proc Natl Acad Sci USA. 107:355–360. [DOI] [PMC free article] [PubMed] [Google Scholar]
- Pruim RH, Mennes M, Buitelaar JK, Beckmann CF. 2015. Evaluation of ICA-AROMA and alternative strategies for motion artifact removal in resting state fMRI. Neuroimage. 112:278–287. [DOI] [PubMed] [Google Scholar]
- Pruim RH, Mennes M, van Rooij D, Llera A, Buitelaar JK, Beckmann CF. 2015. ICA-AROMA: A robust ICA-based strategy for removing motion artifacts from fMRI data. Neuroimage. 112:267–277. [DOI] [PubMed] [Google Scholar]
- Ramot M, Wilf M, Goldberg H, Weiss T, Deouell LY, Malach R. 2011. Coupling between spontaneous (resting state) fMRI fluctuations and human oculo-motor activity. NeuroImage. 58:213–225. [DOI] [PubMed] [Google Scholar]
- Repp BH. 2005. Sensorimotor synchronization: a review of the tapping literature. Psychon Bull Rev. 12:969–992. [DOI] [PubMed] [Google Scholar]
- Repp BH, Su YH. 2013. Sensorimotor synchronization: a review of recent research (2006–2012). Psychon Bull Rev. 20:403–452. [DOI] [PubMed] [Google Scholar]
- Rosenberg M, Noonan S, DeGutis J, Esterman M. 2013. Sustaining visual attention in the face of distraction: a novel gradual-onset continuous performance task. Atten Percept Psychophys. 75:426–439. [DOI] [PubMed] [Google Scholar]
- Rosenberg MD, Finn ES, Constable RT, Chun MM. 2015. Predicting moment-to-moment attentional state. Neuroimage. 114:249–256. [DOI] [PubMed] [Google Scholar]
- Rosenberg MD, Finn ES, Scheinost D, Papademetris X, Shen X, Constable RT, Chun MM. 2016. A neuromarker of sustained attention from whole-brain functional connectivity. Nat Neurosci. 19:165–171. [DOI] [PMC free article] [PubMed] [Google Scholar]
- Sadaghiani S, Hesselmann G, Kleinschmidt A. 2009. Distributed and antagonistic contributions of ongoing activity fluctuations to auditory stimulus detection. J Neurosci. 29:13410–13417. [DOI] [PMC free article] [PubMed] [Google Scholar]
- Sadaghiani S, Poline JB, Kleinschmidt A, D'Esposito M. 2015. Ongoing dynamics in large-scale functional connectivity predict perception. Proc Natl Acad Sci USA. 112:8463–8468. [DOI] [PMC free article] [PubMed] [Google Scholar]
- Seeley WW, Menon V, Schatzberg AF, Keller J, Glover GH, Kenna H, Reiss AL, Greicius MD. 2007. Dissociable intrinsic connectivity networks for salience processing and executive control. J Neurosci. 27:2349–2356. [DOI] [PMC free article] [PubMed] [Google Scholar]
- Seli P, Cheyne JA, Smilek D. 2013. Wandering minds and wavering rhythms: linking mind wandering and behavioral variability. J Exp Psychol Hum Percept Perform. 39:1–5. [DOI] [PubMed] [Google Scholar]
- Semjen A, Schulze HH, Vorberg D. 2000. Timing precision in continuation and synchronization tapping. Psychol Res. 63:137–147. [DOI] [PubMed] [Google Scholar]
- Shen H, Li Z, Qin J, Liu Q, Lubin W, Zeng LL, Li H, Hu D. 2015. Changes in functional connectivity dynamics associated with vigilance network in taxi drivers. Neuroimage. 124:367–378. [DOI] [PubMed] [Google Scholar]
- Shen K, Hutchison RM, Bezgin G, Everling S, McIntosh AR. 2015. Network structure shapes spontaneous functional connectivity dynamics. J Neurosci. 35:5579–5588. [DOI] [PMC free article] [PubMed] [Google Scholar]
- Shine JM, Koyejo O, Bell PT, Gorgolewski KJ, Gilat M, Poldrack RA. 2015. Estimation of dynamic functional connectivity using Multiplication of Temporal Derivatives. Neuroimage. 122:399–407. [DOI] [PubMed] [Google Scholar]
- Shirer WR, Ryali S, Rykhlevskaia E, Menon V, Greicius MD. 2012. Decoding subject-driven cognitive states with whole-brain connectivity patterns. Cereb Cortex. 22:158–165. [DOI] [PMC free article] [PubMed] [Google Scholar]
- Smallwood J, Schooler JW. 2015. The science of mind wandering: empirically navigating the stream of consciousness. Annu Rev Psychol. 66:487–518. [DOI] [PubMed] [Google Scholar]
- Sonuga-Barke EJ, Castellanos FX. 2007. Spontaneous attentional fluctuations in impaired states and pathological conditions: a neurobiological hypothesis. Neurosci Biobehav Rev. 31:977–986. [DOI] [PubMed] [Google Scholar]
- Sporns O. 2012. Discovering the human connectome. Cambridge, MA, USA: The MIT Press. [Google Scholar]
- Stawarczyk D, Majerus S, Maj M, Van der Linden M, D'Argembeau A. 2011. Mind-wandering: phenomenology and function as assessed with a novel experience sampling method. Acta Psychol (Amst). 136:370–381. [DOI] [PubMed] [Google Scholar]
- Tagliazucchi E, Carhart-Harris R, Leech R, Nutt D, Chialvo DR. 2014. Enhanced repertoire of brain dynamical states during the psychedelic experience. Hum Brain Mapp. 35:5442–5456. [DOI] [PMC free article] [PubMed] [Google Scholar]
- Tagliazucchi E, von Wegner F, Morzelewski A, Brodbeck V, Laufs H. 2012. Dynamic BOLD functional connectivity in humans and its electrophysiological correlates. Front Hum Neurosci. 6:339. [DOI] [PMC free article] [PubMed] [Google Scholar]
- Thompson GJ, Magnuson ME, Merritt MD, Schwarb H, Pan WJ, McKinley A, Tripp LD, Schumacher EH, Keilholz SD. 2013. Short-time windows of correlation between large-scale functional brain networks predict vigilance intraindividually and interindividually. Hum Brain Mapp. 34:3280–3298. [DOI] [PMC free article] [PubMed] [Google Scholar]
- Tusche A, Smallwood J, Bernhardt BC, Singer T. 2014. Classifying the wandering mind: revealing the affective content of thoughts during task-free rest periods. NeuroImage. 97:107–116. [DOI] [PubMed] [Google Scholar]
- Uddin LQ. 2015. Salience processing and insular cortical function and dysfunction. Nat Rev Neurosci. 16:55–61. [DOI] [PubMed] [Google Scholar]
- Weissman DH, Roberts KC, Visscher KM, Woldorff MG. 2006. The neural bases of momentary lapses in attention. Nat Neurosci. 9:971–978. [DOI] [PubMed] [Google Scholar]
- Weisz N, Wuhle A, Monittola G, Demarchi G, Frey J, Popov T, Braun C. 2014. Prestimulus oscillatory power and connectivity patterns predispose conscious somatosensory perception. Proc Natl Acad Sci USA. 111:E417–E. [DOI] [PMC free article] [PubMed] [Google Scholar]
- Whitfield-Gabrieli S, Ford JM. 2012. Default mode network activity and connectivity in psychopathology. Annu Rev Clin Psychol. 8:49–76. [DOI] [PubMed] [Google Scholar]
- Yang Z, Craddock RC, Margulies DS, Yan CG, Milham MP. 2014. Common intrinsic connectivity states among posteromedial cortex subdivisions: Insights from analysis of temporal dynamics. NeuroImage. 93(Pt 1):124–137. [DOI] [PMC free article] [PubMed] [Google Scholar]
- Yellin D, Berkovich-Ohana A, Malach R. 2015. Coupling between pupil fluctuations and resting-state fMRI uncovers a slow build-up of antagonistic responses in the human cortex. Neuroimage. 106:414–427. [DOI] [PubMed] [Google Scholar]
- Yeo BT, Krienen FM, Sepulcre J, Sabuncu MR, Lashkari D, Hollinshead M, Roffman JL, Smoller JW, Zollei L, Polimeni JR et al. 2011. The organization of the human cerebral cortex estimated by intrinsic functional connectivity. J Neurophysiol. 106:1125–1165. [DOI] [PMC free article] [PubMed] [Google Scholar]
Associated Data
This section collects any data citations, data availability statements, or supplementary materials included in this article.