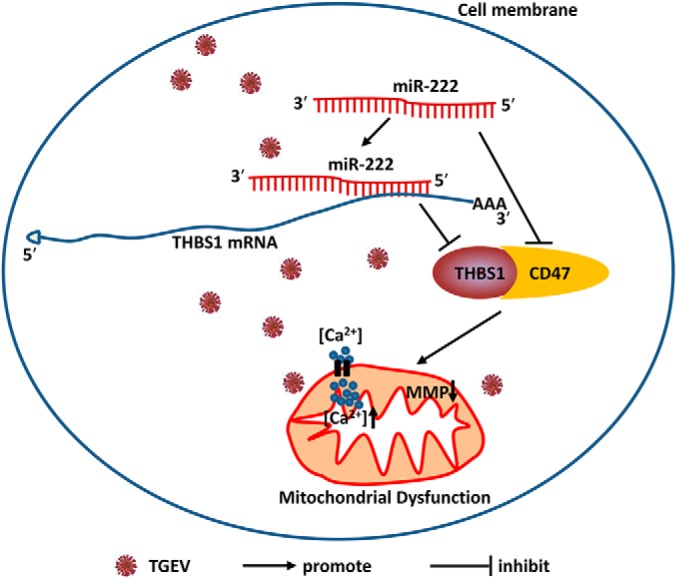
Zhao et al. identify microRNA-222 as a mediator of mitochondrial dysfunction, THBS1, and CD47 induced during TGEV infection and showed that microRNA-222 inhibits TGEV-induced mitochondrial dysfunction via targeting and downregulating CD47.
Keywords: Tandem Mass Spectrometry, Viruses, Mitochondria Function or Biology, Molecular Biology, HPLC, Pathway Analysis, Cluster of Differentiation 47 (CD47), microRNA-222, Proteomics, Thrombospondin-1 (THBS1), Transmissible Gastroenteritis Virus
Graphical Abstract
Highlights
microRNA-222 attenuates TGEV-induced mitochondrial dysfunction.
microRNA-222 downregulates THBS1 and CD47.
THBS1 is the target of microRNA-222 during TGEV infection.
THBS1 and CD47 increase mitochondrial Ca2+ level and reduced mitochondrial membrane potential (MMP).
Abstract
Transmissible gastroenteritis virus (TGEV) is a member of Coronaviridae family. Our previous research showed that TGEV infection could induce mitochondrial dysfunction and upregulate miR-222 level. Therefore, we presumed that miR-222 might be implicated in regulating mitochondrial dysfunction induced by TGEV infection. To verify the hypothesis, the effect of miR-222 on mitochondrial dysfunction was tested and we showed that miR-222 attenuated TGEV-induced mitochondrial dysfunction. To investigate the underlying molecular mechanism of miR-222 in TGEV-induced mitochondrial dysfunction, a quantitative proteomic analysis of PK-15 cells that were transfected with miR-222 mimics and infected with TGEV was performed. In total, 4151 proteins were quantified and 100 differentially expressed proteins were obtained (57 upregulated, 43 downregulated), among which thrombospondin-1 (THBS1) and cluster of differentiation 47 (CD47) were downregulated. THBS1 was identified as the target of miR-222. Knockdown of THBS1 and CD47 decreased mitochondrial Ca2+ level and increased mitochondrial membrane potential (MMP) level. Reversely, overexpression of THBS1 and CD47 elevated mitochondrial Ca2+ level and reduced mitochondrial membrane potential (MMP) level. Together, our data establish a significant role of miR-222 in regulating mitochondrial dysfunction in response to TGEV infection.
Transmissible gastroenteritis virus (TGEV)1, an enteropathogenic coronavirus, is an enveloped virus with a positive-sense single-stranded RNA genome (1). TGEV infection can cause apoptosis, inflammation, immune response, autophagy (2–4). We reported that TGEV infection could induce cell apoptosis via mitochondria-mediated pathway and caused a decrease of mitochondrial membrane potential, implying that mitochondrial dysfunction occurs (5, 6). Mitochondrion not only plays a vital role in energy production, but also mediates many pathologic processes, including viral infection, inflammation, apoptosis (7). Therefore, TGEV-induced pathologic processes, including apoptosis, inflammation, immune response, autophagy, might be the consequences of mitochondrial dysfunction.
microRNAs (miRNAs) are a class of small non-coding RNA and plays a crucial role in regulating gene expression at post-transcriptional level by specifically binding to 3′ UTR of target mRNA (8). miRNAs are involved in regulating many biological processes, including viral infection (9, 10). Moreover, miRNAs are also involved in modulating the mitochondrial functions (11). miR-222 is a miRNA that is overexpressed in several types of cancers and related to mitochondrial function (12). In our previous study, TGEV infection was found to elevate miR-222 level and to cause mitochondrial dysfunction (13, 14). Therefore, we speculate that miR-222 might have an association with TGEV-induced mitochondrial dysfunction.
To verify the hypothesis, Gene Ontology (GO) enrichment analysis and Kyoto Encyclopedia of Genes and Genomes (KEGG) pathway analysis of miR-222 targets were conducted and showed that miR-222 might be implicated in regulation of mitochondrial function. The effect of miR-222 on mitochondrial dysfunction during TGEV infection was measured. Subsequently, relative protein quantification analysis in response to miR-222 was performed and revealed that THBS1 and CD47 were downregulated by miR-222 and related to mitochondria function. THBS1 was identified as the target of miR-222. We examined the effects of THBS1 and CD47 on mitochondrial Ca2+ and MMP and found that THBS1 and CD47 were activators of mitochondrial Ca2+ levels and inhibitors of MMP. The data show miR-222 prevent TGEV-induced mitochondrial dysfunction via targeting THBS1 and restraining CD47.
EXPERIMENTAL PROCEDURES
Cells, Virus, and Antibodies
PK-15 cells were purchased from ATCC (CCL-33) and grown in Dulbecco's Minimal Essential Medium (DMEM) supplemented with 10% fetal bovine serum (Gibco, New York), 100 IU of penicillin, and 100 mg of streptomycin per ml, at 37 °C in a 5% CO2 atmosphere incubator. The TGEV Shaanxi strain was isolated from TGEV-infected piglets (15). Anti-THBS1 antibody was obtained from Thermo (Thermo, Waltham, MA). Anti-CD47 antibody was purchased from Abcam (Abcam, Cambridgeshire, UK). The monoclonal β-actin was purchased from Santa Cruz Biotechnology (Santa Cruz).
Experimental Design and Statistical Rationale for Proteomics
To investigate the effect of miR-222 on TGEV-induced mitochondrial dysfunction, PK-15 cells were transfected with miR-222 mimics (experimental samples) or mimics control (control samples) using Lipofectamine 3000 and infected with TGEV at an MOI of 1.0 at 24 h post-transfection (hpt). The cells were collected for quantitative proteomic analysis at 24 h postinfection (hpi). Two biological replicates preparations labeled with TMT were analyzed. The two control samples, which were transfected with miRNA mimics control and infected with TGEV, were respectively labeled with TMT-126 and TMT-129. The two experimental samples, which were transfected with miR-222 mimics and infected with TGEV, were respectively labeled with TMT-128 and TMT-131. To assess the transfection efficiency, miR-222 level was measured by qRT-PCR. The sequences of miR-222 mimics, mimics control, and primers are shown in supplemental S1.
Quantification of miRNA and mRNA by qRT-PCR
Total RNA was isolated using Trizol reagent (Invitrogen, California) from PK-15 cells. qRT-PCR was performed as previously described (13). 2 μg of total RNA was treated with DNase I (Fermentas, Germany) for 30 min at 37 °C and reversely transcribed using the First-strand cDNA synthesis kit (Invitrogen). The cDNA was used as the template for qRT-PCR. qRT-PCR was performed using the AccuPower 2×Greenstar qPCR Master mix (Bioneer, Korea) on Bio-Rad iQ5 Real-Time PCR System (Bio-RadA). The relative fold changes of miRNA and mRNA were calculated using two-ddCt method (respectively normalized to U6 and β-actin) (16). The primers are shown in supplemental S1.
Protein Isolation and Labeling with TMT Reagents
Samples were sonicated three times on ice in lysis buffer (8 m urea, 1% Triton-100, 65 mm DTT and 0.1% Protease Inhibitor Mixture) and centrifuged at 20,000 × g at 4 °C for 20 min. The supernatant was treated with cold 15% trichloroacetic acid (TCA) for 2 h at −20 °C and centrifuged for 10 min at 20,000 × g at 4 °C. The precipitate was washed with cold acetone for three times. The protein was dissolved in buffer (8 m urea, 100 mm TEAB, pH 8.0) and concentration was determined with 2-D Quant kit according to the manufacturer's instructions. 100 μg protein for each sample were digested with trypsin for following experiments. The two control samples transfected with miRNA mimics control was respectively labeled with TMT-126 and TMT-129. The two experimental samples treated with miR-222 mimics were respectively labeled with TMT-128 and TMT-131.
LC-MS/MS Analysis
The samples were fractionated by high pH reverse-phase High Performance Liquid Chromatography (HPLC). Briefly, peptides were dried by vacuum centrifugation, dissolved in 0.1% formic acid, and then directly loaded onto a reversed-phase pre-column (Acclaim PepMap 100), (Thermo Fisher Scientific, Waltham, MA) Subsequently, peptides were separated using a reversed-phase analytical column (Acclaim PepMap RSLC) (Thermo Fisher Scientific) and analyzed by Q ExactiveTM hybrid quadrupole-Orbitrap mass spectrometer (Thermo Fisher Scientific).
The peptides were subjected to NSI source followed by tandem mass spectrometry (MS/MS) in Q ExactiveTM (Thermo Fisher Scientific) coupled online to the HPLC. Intact peptides were detected in the Orbitrap at a resolution of 70,000. Peptides were selected for MS/MS using NCE setting as 32. Ion fragments were detected in the Orbitrap at a resolution of 17,500. A data-dependent procedure that alternates between one MS scan followed by 20 MS/MS scans was applied for the top 20 precursor ions above a threshold ion count of 2E4 in the MS survey scan with 30.0 s dynamic exclusion. The electrospray voltage was 2.0 kV. Automatic gain control (AGC) was set at 5E4. For MS scans, the m/z scan range was 350 to 1800. Fixed first mass was set as 100 m/z.
Analysis of LC-MS/MS Data
MS/MS data were analyzed using Mascot search engine (version 2.3.0) following a previously described protocol (17). Briefly, raw MS data files were processed using the LC/MS software Proteome Discoverer (version 1.3.0.339) (Thermo Fisher Scientific) and converted into the Mascot generic format (mgf) files. Mascot software performed peak generation, precursor mass recalibration, extraction of TMT 6-plex reporter ions intensity, and calculation of TMT 6-plex reporter ions intensity ratios. For each MS/MS spectra, top 10 most intense peaks in every 100 Da window were extracted for database search. Then Tandem mass spectra data were searched against Uniprot_Sus scrofa database (UniProt release 2015_04, 26054 sequences) (http://www.uniprot.org) concatenated with reversed decoy database and protein sequences of common contaminants using Mascot. Cleavage enzyme was specified as trypsin/P. Maximum number of missing cleavages was set to 2. Mass tolerance for precursor ion was set to 10 ppm and mass tolerance for MS/MS ions was set to 0.02 Da. Carbamyiodomethylation on Cys, TMT6plex (N-term), and TMT6plex (K) were specified as fixed modification and oxidation on Met. Acetylation on protein N-terminal were specified as variable modifications. False discovery rate (FDR) thresholds for protein, peptide, and modification site were specified at 1%. Mascot software was used to assemble the peptide/protein groups, calculate false discovery rates, and filter the identifications. Protein quantification was set to use only unique peptides bearing any modification. The median ratio of TMT 6-plex reporter intensity of unique peptides was set as protein relative abundance changes. In this study, we prepared two duplicate samples. For each protein, we set the average ratio calculated from two duplicate samples as the final quantitation of protein. Student's test was exploited to calculate differential significance degree of protein relative abundance changes. A fold change >1.2 or < 0.83, plus a p-Value <0.05 (t test), were set as thresholds for significant up and downregulation, respectively. The mass spectrometry proteomics data have been deposited to the ProteomeXchange Consortium via the PRIDE partner repository with the dataset identifier PXD010927 (http://www.ebi.ac.uk/pride) (18).
GO and KEGG Analysis of Differential-Expressed Proteins
GO annotations of proteome were derived from the UniProt-GOsA database (http://www.ebi.ac.uk/GOA). KEGG database was used to annotate proteins pathways. The Wolf Psort database (https://wolfpsort.hgc.jp/) was used to predict subcellular localization.
Protein-Protein Interaction Analysis
All differentially expressed protein identifiers (Uniprot accession) were searched against STRING database (version 10.0) for protein-protein interactions (19).
Vector Construction
To overexpress THBS1 and CD47, the full-length sequences of THBS1 and CD47 were obtained by PCR from PK-15 cells and cloned into plasmid pCI-neo (Promega). The constructions were respectively named pCI-neo-THBS1 and pCI-neo-CD47. The primer sequences are shown in supplemental S1.
Measurement of Mitochondrial Ca2+ Level
Mitochondrial Ca2+ level was assessed using Rhod-2 kit (GENMED, China) following the manufacturer's instruction. Briefly, after being washed, the PK-15 cells were dyed using dye reagent containing Rhod-2 for 30 min at room temperature and then incubated for 30 min at 37 °C in dark places. The absorbance was measured at 550 ex/590 em using fluorescence spectrophotometer. The relative fluorescence unit (RFU) was calculated according the manufacturer's instruction.
Evaluation of MMP
MMP of PK-15 cells was assessed using JC-1 kit (GENMED, China) following the manufacturer's protocol. PK-15 cells were treated with dye reagent containing JC-1 and incubated at room temperature for 10 min. The absorbance was measured at 490 ex/590 em using fluorescence spectrophotometer. The relative fluorescence unit (RFU) was calculated according the manufacturer's instruction.
Western Blot Analysis
Cells were treated with RIPA lysis buffer containing phenylmethyl sulfonylfluoride (PMSF). Total proteins were separated on a 12% sodium dodecyl sulfate-polyacrylamide gel electrophoresis (SDS-PAGE) and subsequently transferred onto polyvinylidene difluoride (PVDF) membranes (Millipore). The membrane was blocked with 5% BSA for 2 h at room temperature and successively incubated with primary antibody overnight at 4 °C and with HRP-conjugated secondary antibody at room temperature for 1 h. The signal was detected using enhanced chemiluminescence (ECL) kit (Bio-Rad).
Identification of miR-222 Target
3′ UTRs of 9 candidate target genes, which are related to mitochondria and contain the binding site of miR-222, were respectively amplified by PCR and cloned into dual-luciferase reporter vector, psiCHECK-2 (Promega), to obtain the recombinant plasmids for wildtype of targets. The binding sites of miR-222 in 3′ UTR of targets were mutated following a mutagenesis protocol to obtain the mutants of targets. The primer sequences are shown in supplemental S1. miR-222 mimics, miRNA mimics control, miR-222 inhibitors, and miRNA inhibitors control were synthesized by Ribo Biotech (RiboBio, China) (The sequences are shown in upplemental S1). PK-15 cells were grown in 24-well plate and then co-transfected with recombinant plasmids for wildtype (or mutant) and miR-222 mimics (or miR-222 inhibitors) using Lipofectamine 3000 (Invitrogen). Luciferase activities were measured on luminometer using Dual-Glo Luciferase Assay System (Promega) following the manufacturer's manual.
RESULTS
Gene Ontology Enrichment Analysis of miR-222 Targets
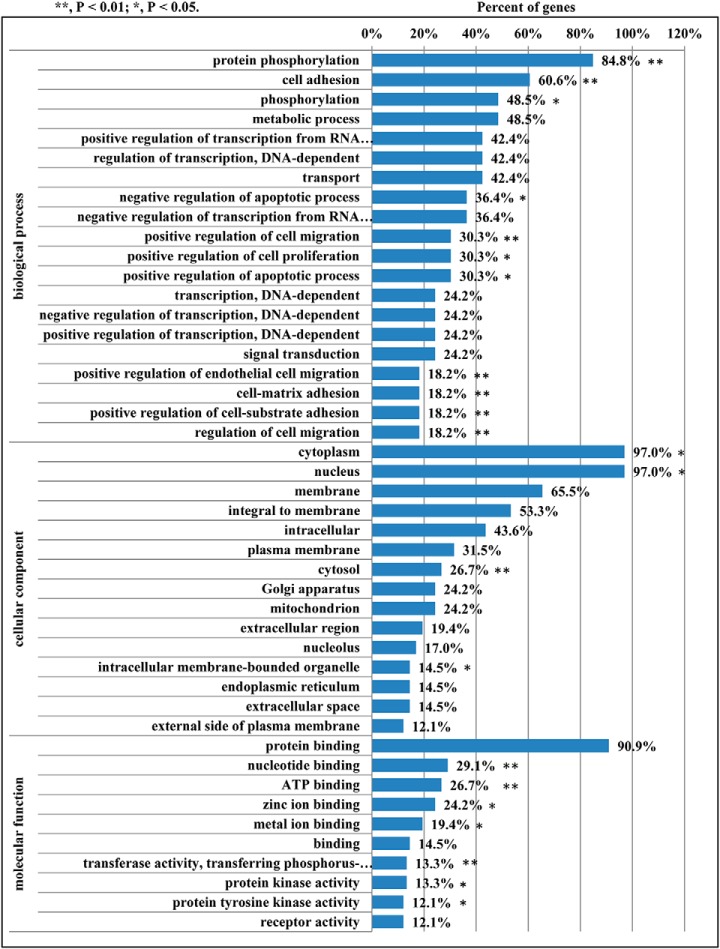
TargetScan and miRanda were used to predict miR-222 targets (20). Three hundred ten targets were obtained (supplemental S2) and searched against GO database to provide enrichment information on Biological Process, Molecular Function, and Cellular Component. GO enrichment of the 310 targets of miR-222 showed that 48.5% of targets were enriched in metabolic process and 24.2% of targets were involved in mitochondria in Cellular component (Fig. 1).
Fig. 1.
GO analysis of miR-222 targets. * p < 0.05 compared with the control. ** p < 0.01 compared with the control.
KEGG Pathway Enrichment Analysis of Differentially Expressed Proteins
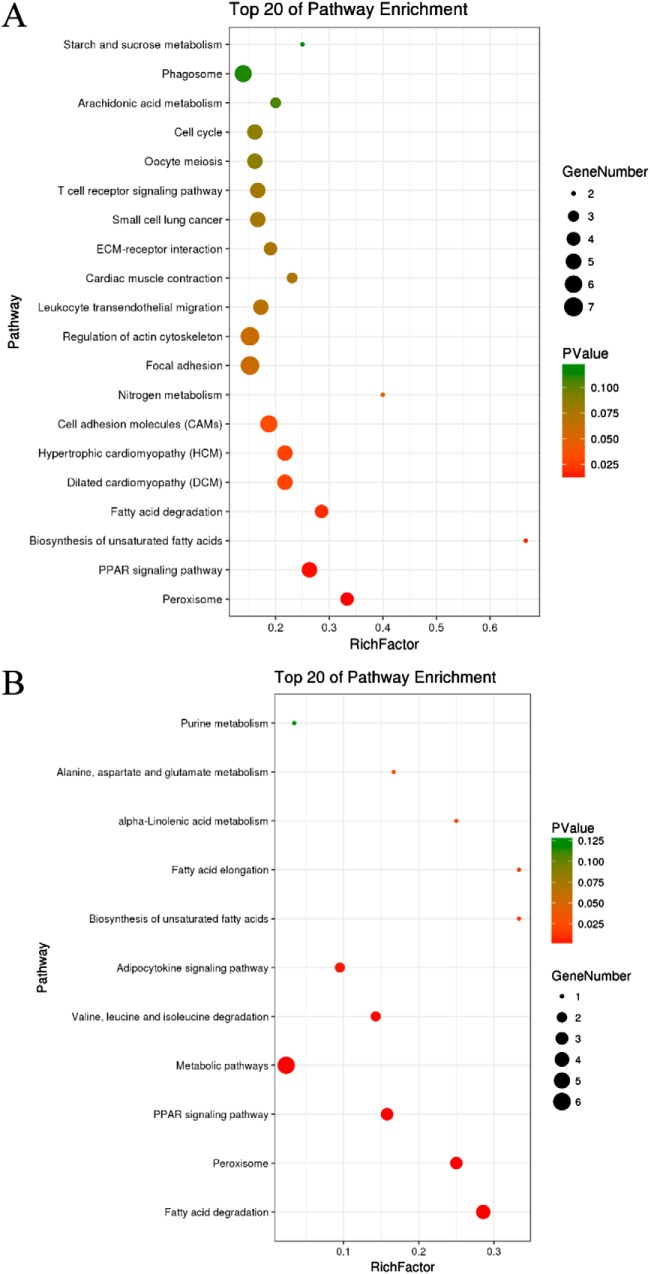
KAAS, an online service tool of KEGG, was used to annotate the 310 targets of miR-222. Annotations were mapped on KEGG pathway database using KEGG mapper. KEGG enrichment analysis revealed the targets of miR-222 were primarily enriched in Peroxisome, PPAR signaling pathway, Biosynthesis of unsaturated fatty acids, and Fatty acid degradation (Fig. 2A). The mitochondria-related targets of miR-222 were mainly enriched in Fatty acid degradation, Peroxisome, PPAR signaling pathway, and Metabolic pathway (Fig. 2B).
Fig. 2.
KEGG analysis of miR-222 targets. A, KEGG analysis for targets of miR-222; B, KEGG analysis for mitochondria-associated targets of miR-222.
miR-222 Decreased Mitochondrial Ca2+ Level and Increased MMP Level
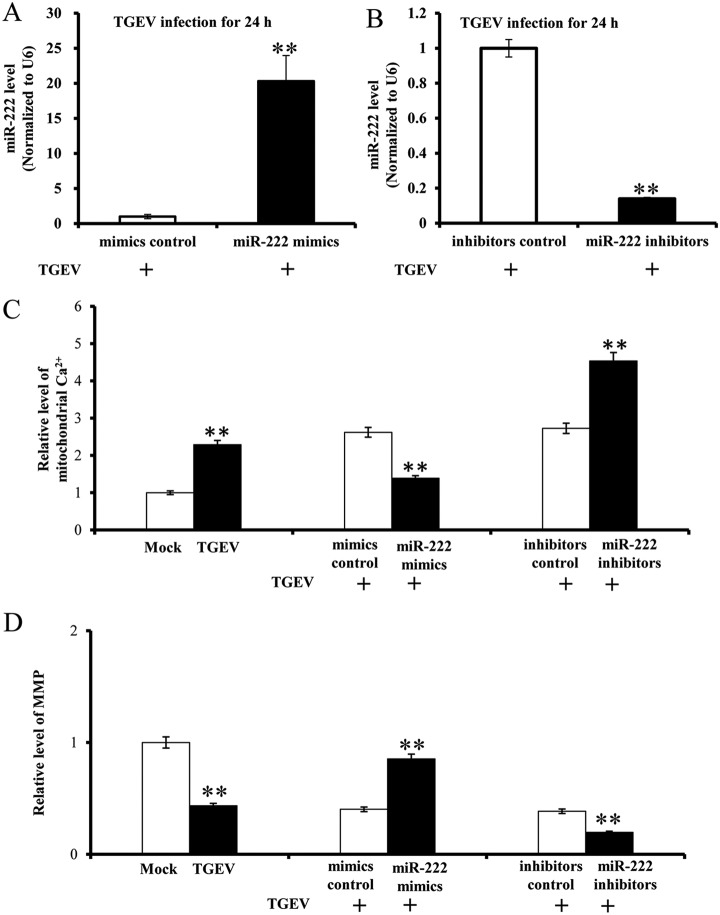
To investigate the impact of miR-222 on mitochondrial dysfunction during TGEV infection, PK-15 cells were transfected with miR-222 mimics/miR-222 inhibitors and subsequently infected with TGEV or treated with medium instead of TGEV, named MOCK infection. Mitochondrial Ca2+ level and MMP level were measured at 24 hpi. Overexpression and silence of miR-222 were successfully achieved by miR-222 mimics (Fig. 3A) and miRNA-222 inhibitors (Fig. 3B). Mitochondrial Ca2+ level was downregulated by miR-222 mimics and was upregulated by miR-222 inhibitors (Fig. 3C). MMP level was increased by miR-222 mimics and was decreased by miR-222 inhibitors (Fig. 3D). The results suggest that miR-222 counteracts TGEV-induced mitochondrial dysfunction in PK-15 cells.
Fig. 3.
The effect of miR-222 on TGEV-induced mitochondrial dysfunction. A, Overexpression of miR-222 by miR-222 mimics; B, Silencing of miR-222 by miR-222 inhibitors; C, The effect of miR-222 on mitochondrial Ca2+ during TGEV infection; D, The effect of miR-222 on MMP during TGEV infection.
Identification of 100 Differentially Expressed Proteins in TGEV-infected PK-15 Cells
To analyze the molecular mechanism of miR-222 in TGEV-induced mitochondrial dysfunction, relative protein quantification was performed. A total of 4209 proteins were detected and quantified (supplemental Fig. S3). When setting quantification ratio of >1.2 (p < 0.05) as upregulated threshold and <0.83 (p < 0.05) as downregulated threshold, 100 differentially expressed proteins were obtained, including 57 upregulated proteins and 43 downregulated proteins (Table I). Raw data of MS have been deposited to the ProteomeXchange Consortium via the PRIDE partner repository with the data set identifier PXD010927 (http://www.ebi.ac.uk/pride).
Table I. Differentially expressed proteins induced by overexpression miR-222 mimics in PK-15 cells during TGEV infectiona.
| No. | Protein name | Fold change | p value | No. | Protein name | Fold change | p value |
|---|---|---|---|---|---|---|---|
| 1 | YWHAQ | 2.177 | 0.0346989 | 51 | STAT2 | 1.215 | 0.0014066 |
| 2 | GBP1 | 2.131 | 2.094E-08 | 52 | RPS20 | 1.215 | 0.0453924 |
| 3 | SDC4 | 1.859 | 0.0042522 | 53 | SMARCA2 | 1.212 | 0.0103799 |
| 4 | MRPL38 | 1.527 | 0.044407 | 54 | CNPY2 | 1.212 | 0.0229731 |
| 5 | MRPL47 | 1.518 | 0.0138218 | 55 | SERPINB8 | 1.21 | 0.0153453 |
| 6 | MRPL11 | 1.4485 | 0.0016448 | 56 | NUB1 | 1.204 | 0.0475958 |
| 7 | CDH1 | 1.432 | 0.0046425 | 57 | STX12 | 1.2015 | 0.0159419 |
| 8 | P4HA1 | 1.41 | 0.0009798 | 58 | FN1 | 1.201 | 1.251E-07 |
| 9 | CASP4 | 1.403 | 0.0189837 | 59 | MYL12B | 0.833 | 2.194E-05 |
| 10 | HK2 | 1.394 | 3.612E-05 | 60 | THBS1 | 0.832 | 0.0491643 |
| 11 | MRPL24 | 1.39 | 0.0079873 | 61 | WDR11 | 0.8305 | 0.009389 |
| 12 | BST2 | 1.383 | 1.462E-05 | 62 | RRBP1 | 0.829 | 0.0029895 |
| 13 | LAMA3 | 1.371 | 0.0374052 | 63 | EIF3H | 0.827 | 5.491E-05 |
| 14 | CCL5 | 1.37 | 0.0087035 | 64 | CDK6 | 0.826 | 0.0472265 |
| 15 | MRPL46 | 1.366 | 0.0145114 | 65 | MYH9 | 0.826 | 2.689E-14 |
| 16 | NDUFB5 | 1.354 | 0.0151887 | 66 | THOP1 | 0.8235 | 0.0014235 |
| 17 | GVIN1 | 1.351 | 0.0046014 | 67 | HEATR5B | 0.8235 | 0.037828 |
| 18 | MNDA | 1.344 | 0.0018819 | 68 | S100A5 | 0.82 | 0.0003203 |
| 19 | NDUFV1 | 1.335 | 0.0424156 | 69 | MRI1 | 0.818 | 0.0221039 |
| 20 | NDUFC2 | 1.326 | 0.0487252 | 70 | CAV1 | 0.8165 | 0.0001134 |
| 21 | TACSTD2 | 1.3095 | 0.0044767 | 71 | PEA15 | 0.815 | 0.0204468 |
| 22 | RPL34 | 1.309 | 0.0314898 | 72 | STAU1 | 0.813 | 0.0442707 |
| 23 | WARS | 1.307 | 5.214E-07 | 73 | CD47 | 0.811 | 0.0336522 |
| 24 | HMGCS1 | 1.304 | 0.0011961 | 74 | AHSA2 | 0.81 | 0.0066613 |
| 25 | HINFP | 1.296 | 2.42E-07 | 75 | KRT74 | 0.81 | 0.0281688 |
| 26 | CCN2 | 1.287 | 0.0453662 | 76 | FXR2 | 0.8095 | 0.0217135 |
| 27 | SEC61B | 1.2865 | 0.0027047 | 77 | PSD4 | 0.809 | 0.0033331 |
| 28 | HSPG2 | 1.278 | 0.0041966 | 78 | ARHGEF1 | 0.8085 | 0.0217513 |
| 29 | ZRANB2 | 1.2775 | 0.035522 | 79 | DOCK7 | 0.808 | 2.119E-07 |
| 30 | SNRNP70 | 1.275 | 4.575E-05 | 80 | NMT1 | 0.804 | 0.0365022 |
| 31 | MRPS26 | 1.27 | 1.605E-05 | 81 | SUMO2 | 0.8015 | 0.0095957 |
| 32 | IRG6 | 1.2675 | 4.488E-05 | 82 | M6P/IGF2R | 0.8 | 0.0004368 |
| 33 | IFIT3 | 1.261 | 2.458E-12 | 83 | PTBP2 | 0.797 | 0.0282061 |
| 34 | RAB34 | 1.254 | 0.0173716 | 84 | TTYH2 | 0.795 | 0.0143047 |
| 35 | RALB | 1.2495 | 0.0038273 | 85 | AHNAK | 0.793 | 4.937E-15 |
| 36 | NDUFS1 | 1.247 | 0.0078359 | 86 | PBDC1 | 0.785 | 0.0241577 |
| 37 | TMPO | 1.2465 | 0.0148787 | 87 | NLE1 | 0.782 | 0.0169835 |
| 38 | TOP1 | 1.242 | 1.734E-05 | 88 | DDI2 | 0.775 | 0.0012816 |
| 39 | IL1RN | 1.241 | 0.0290372 | 89 | SAMD9 | 0.7745 | 0.006346 |
| 40 | TMED5 | 1.241 | 0.0147443 | 90 | KTN1 | 0.772 | 1.748E-05 |
| 41 | MCCC2 | 1.2405 | 0.0436083 | 91 | TRIO | 0.7715 | 0.0069649 |
| 42 | SNRPD2 | 1.2395 | 0.0006629 | 92 | CALU | 0.764 | 0.0011378 |
| 43 | RPL14 | 1.233 | 0.0018615 | 93 | RPS9 | 0.757 | 9.28E-06 |
| 44 | NDUFA13 | 1.231 | 0.0047714 | 94 | RCN1 | 0.756 | 0.0338862 |
| 45 | Ribosomal protein S2 | 1.227 | 0.0198054 | 95 | SUN2 | 0.754 | 0.0073054 |
| 46 | MRPS2 | 1.227 | 0.0222525 | 96 | TAGLN | 0.7365 | 0.0074309 |
| 47 | CTDSPL2 | 1.225 | 0.0118196 | 97 | KIAA1468 | 0.7355 | 0.0468494 |
| 48 | COX4I1 | 1.22 | 6.647E-06 | 98 | STMN1 | 0.7325 | 0.01509 |
| 49 | FKBP9 | 1.2195 | 0.0304301 | 99 | TPM1 | 0.717 | 0.0007421 |
| 50 | IFIT2 | 1.2155 | 5.104E-05 | 100 | RANBP1 | 0.676 | 0.0491162 |
aMore information is available in supplemental S4.
GO Enrichment Analysis of the 100 Differentially Expressed Proteins
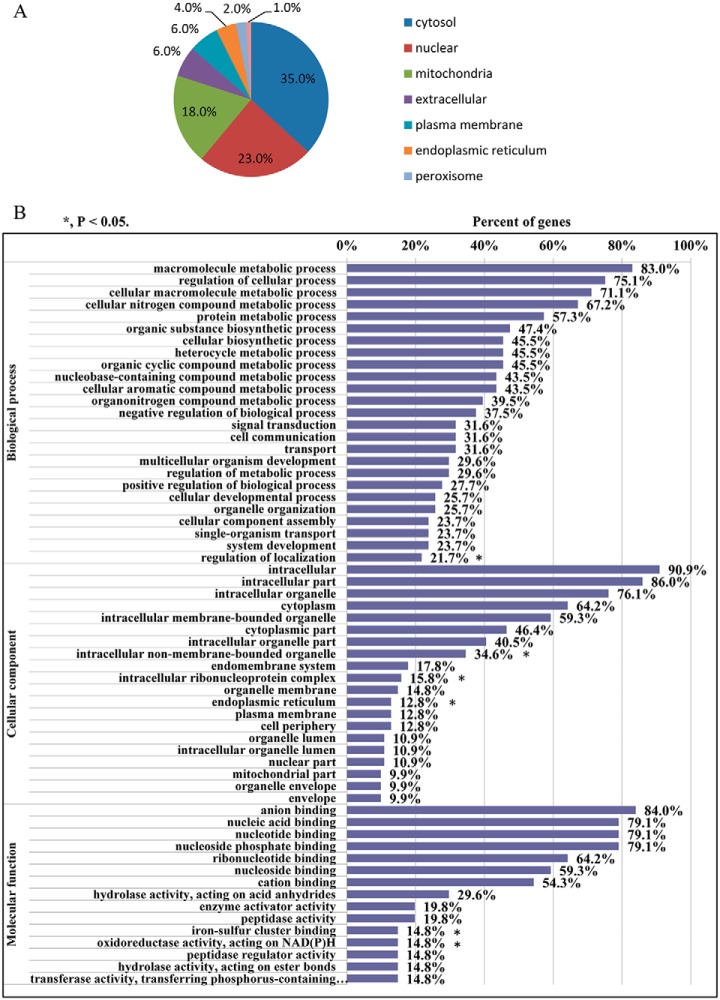
Subcellular localization of 100 differentially expressed proteins was analyzed by searching against Wolf Psort database (https://wolfpsort.hgc.jp/). The result showed that the 100 differentially expressed proteins were localized at cytosol (35.0%), nuclear (23.0%), mitochondria (18.0%), extracellular (6.0%), plasma membrane (6.0%), endoplasmic reticulum (4.0%), and peroxisome (1.0%) (Fig. 4A). The 100 differentially expressed proteins were annotated by UniProt-GOA database and enriched by GO annotation based on three categories: Biological Process, Cellular Component, and Molecular Function. In Biological Process, the 100 differentially expressed proteins were primarily enriched in metabolic process. The Cellular component was mainly involved in intracellular (90.9%), intracellular part (86.0%), intracellular organelle (76.1%), and especially mitochondrial part (9.9%). In Molecular function, the 100 differentially expressed proteins were primarily enriched in anion biding (84.0%) and nucleotide binding (79.1%) (Fig. 4B).
Fig. 4.
Subcellular localization and GO analysis of 100 differentially expressed proteins caused by miR-222 overexpression. A, Subcellular localization of differentially expressed proteins caused by miR-222 overexpression; B, GO enrichment analysis of differentially expressed proteins caused by miR-222 overexpression.
KEGG Pathway Enrichment Analysis of Differentially Expressed Proteins
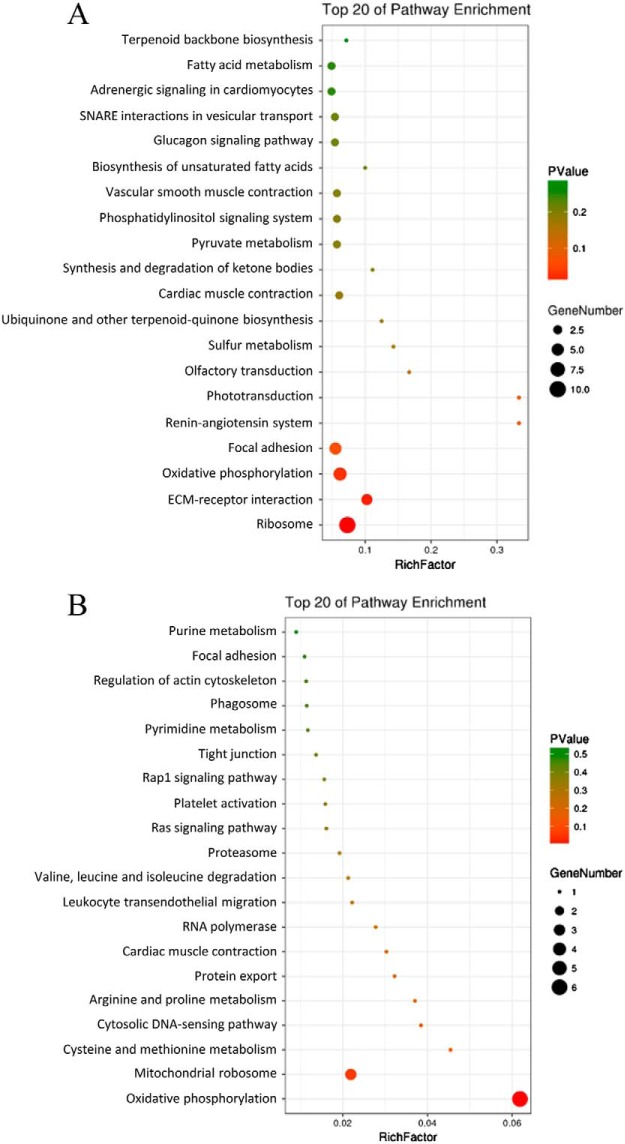
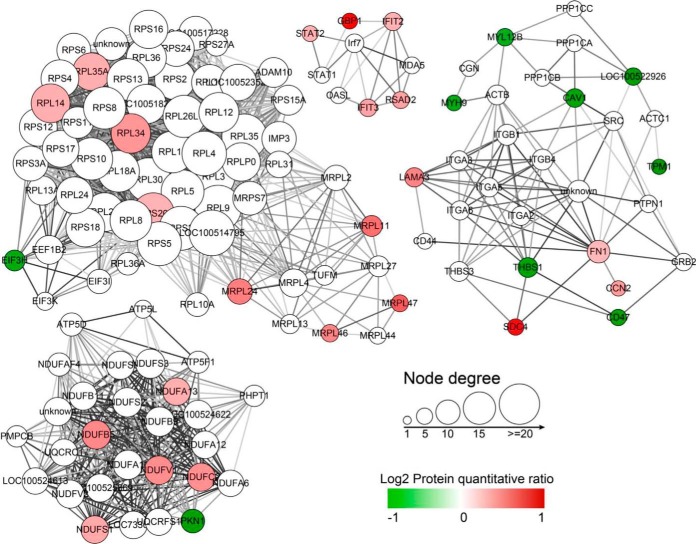
The 100 differentially expressed proteins were searched for functional enrichment by a KEGG database search. The results showed that these proteins were mainly enriched in Ribosome, ECM-receptor interaction, Oxidative phosphorylation, and Focal adhesion (Fig. 5A). The mitochondria-related proteins were prevailingly enriched in Oxidative phosphorylation and Mitochondrial ribosome (Fig. 5B). The differentially expressed proteins were used as an input list for the web-tool STRING to generate protein-protein interaction networks (Fig. 6). It is interesting that THBS1 interacts with CD47. THBS1 is predicted as one of the targets of miR-222.
Fig. 5.
KEGG analysis of differentially expressed proteins caused by miR-222 overexpression. A, KEGG analysis for differentially expressed proteins; B, KEGG analysis for mitochondria-associated differentially expressed proteins.
Fig. 6.
Protein-protein interaction networks analysis. The significantly upregulated proteins are shown in red; The significantly downregulated proteins are in green.
Verification of Differentially Expressed Proteins by Western blotting and qRT-PCR
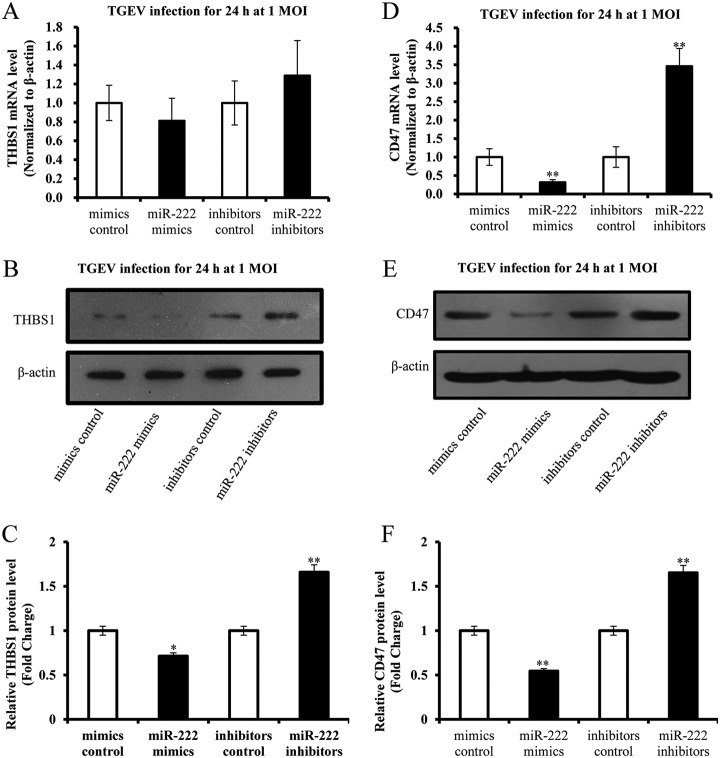
Relative quantitative proteomic analysis showed that miR-222 mimics downregulated expression of THBS1 and CD47. According to Protein-Protein interaction analysis of miR-222 targets, THBS1 is predicted the target of miR-222 and interacts with CD47. Moreover, THBS1 is related to regulate mitochondrial function (21, 22). Therefore, expression of THBS1 and CD47 were verified. The mRNA level of THBS1 was not influenced by miR-222 (Fig. 7A). The mRNA level of CD47 was reduced by miR-222 mimics and elevated by miR-222 inhibitors (Fig. 7C). Expression levels of THBS1 and CD47 were inhibited by miR-222 mimics and promoted by miR-222 inhibitors (Fig. 7B and 7D).
Fig. 7.
Validation of differentially expressed proteins. A, The effect of miR-222 on mRNA level of THBS1; B, Expression of THBS1 was reduced by miR-222 mimics and promoted by miR-222 inhibitors; C, The effect of miR-222 on mRNA level of CD47; D, Expression of CD47 was downregulated by miR-222 mimics and upregulated by miR-222 inhibitors. Data represent mean ± S.D. of three independent experiments. * p < 0.05 compared with the control. ** p < 0.01 compared with the control.
THBS1 is a Direct Target of miR-222
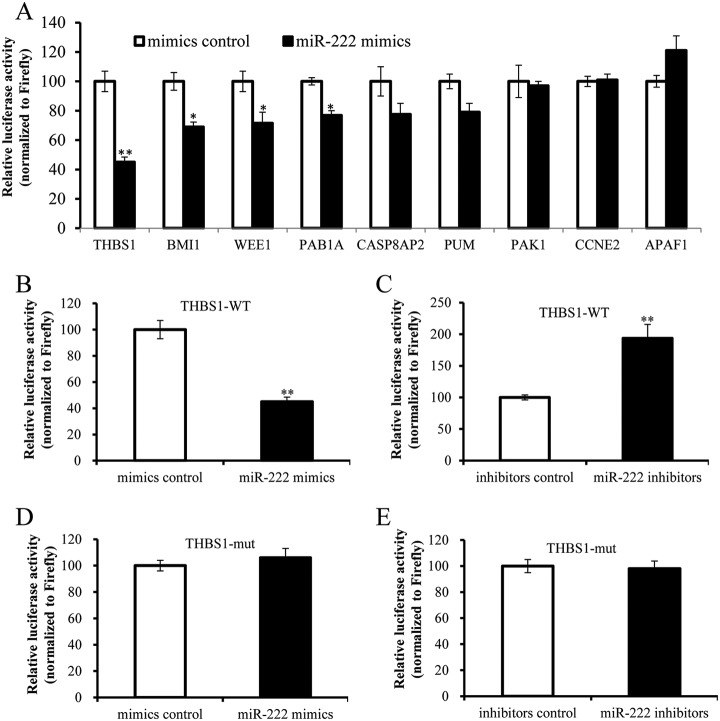
To identify the mitochondria-related target of miR-222, 3′ UTRs of 9 mitochondria-related targets, including THBS1, were respectively amplified and cloned into 3′ UTR of Renilla luciferase of dual-luciferase reporter plasmid psiCHECK-2. The recombinants and miR-222 mimics/inhibitors were co-transfected into PK-15 cells. The luciferase activities were detected. The results showed that the Renilla luciferase activity of plasmid containing the 3′ UTR of THBS1 was markedly lower than that of the control (normalized to Firefly luciferase activity) (Fig. 8A). To further confirm the direct binding between miR-222 and 3′ UTR of THBS1, the mutated 3′ UTR sequence of THBS1, in which miR-222 seed sequence was mutated, was cloned into the 3′ UTR of Renilla luciferase to generate construction THBS1-mut. The constructs were respectively co-transfected into PK-15 cells with either miR-222 mimics or inhibitors. The Renilla luciferase activity of THBS1-WT was reduced by miR-222 mimics and potentiated by miR-222 inhibitors (normalized to Firefly luciferase activity) (Fig. 8B and 8C). The Renilla luciferase activity of THBS1-mut was not affected by mimics and inhibitors of miR-222 (Fig. 8D and 8E). Moreover, the mRNA level of THBS1 was not changed by miR-222 mimics and miR-222 inhibitors (Fig. 7A). However, the protein level of THBS1 was reduced by miR-222 mimics and increased by miR-222 inhibitors (Fig. 7B). Taken together, our data identified that THBS1 was a direct target of miR-222.
Fig. 8.
THBS1 is the direct target of miR-222. A, The binding ability of miR-222 to 3′ UTRs of 9 potential target genes; B and C, The binding ability of miR-222 to 3′ UTR of THBS1 wildtype (THBS1-WT); D and E, The binding ability of miR-222 to mutant 3′ UTR of THBS1 (THBS1-mut). Data represent means ±S.D. of three independent experiments. * p < 0.05 compared with the control. ** p < 0.01 compared with the control.
Effects of THBS1 on Mitochondrial Ca2+ and MMP Levels
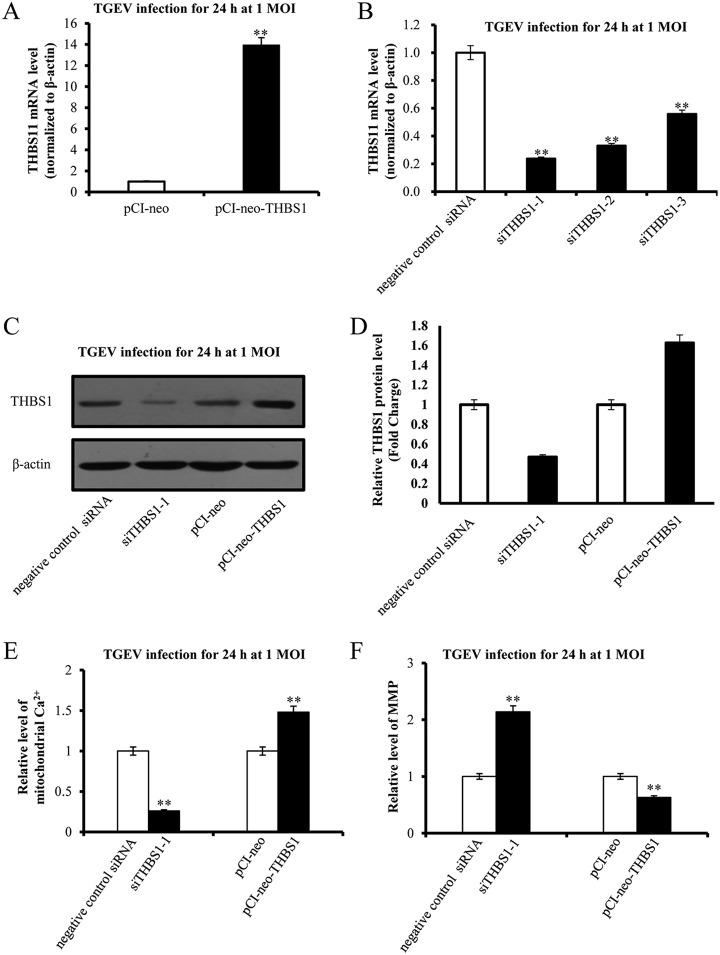
We demonstrated that miR-222 targeted THBS1 and reduced TGEV-induced mitochondrial dysfunction. So, we speculate that miR-222 might suppress TGEV-induced mitochondrial dysfunction via targeting THBS1. To identified that, THBS1 was knocked down by artificial siRNAs and overexpressed by pCI-neo-THBS1 (Fig. 9A, 9B, and 9C). Mitochondrial Ca2+ level was reduced by siTHBS1–1 and elevated by pCI-neo-THBS1 (Fig. 9D). MMP level was upregulated by siTHBS1–1 and downregulated by pCI-neo-THBS1 (Fig. 9E).
Fig. 9.
The effect of THBS1 on TGEV-induced mitochondrial dysfunction. A, mRNA level of THBS1–1 caused by pCI-neo-THBS1; B, Silencing effects of THBS1's siRNAs at mRNA level; C, The effects of siTHBS1 and pCI-neo-THBS1 on expression of THBS1; D, Quantification of expression of THBS1 in response to siTHBS1 and pCI-neo-THBS1; E, The effect of THBS1 on mitochondrial Ca2+ level during TGEV infection; F, The effect of THBS1 on MMP level during TGEV infection. Data represent mean ± S.D. of three independent experiments. * p < 0.05 compared with the control. ** p < 0.01 compared with the control.
Effects of CD47 on Mitochondrial Ca2+ and MMP Levels
pCI-neo-CD47 was constructed to overexpress CD47. siRNAs of CD47 were design and synthetized (RiboBio, China). PK-15 cells were respectively transfected with pCI-neo-CD47 and siCD47 and subsequently infected with TGEV. Mitochondrial Ca2+ and MMP were tested. Mitochondrial Ca2+ was decreased by siCD47 and increased by pCI-neo-CD47 (Fig. 10A). MMP level was facilitated by siCD47 and reduced by pCI-neo-CD47 (Fig. 10B).
Fig. 10.
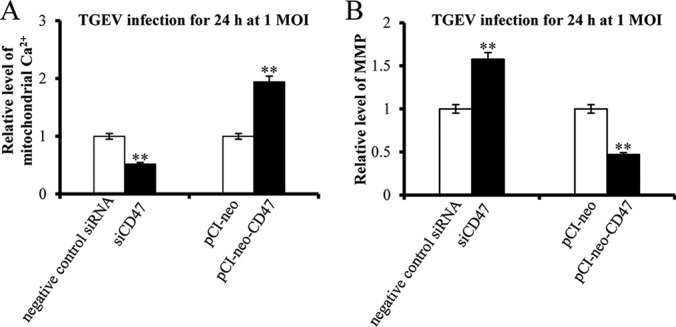
The effect of CD47 on TGEV-induced mitochondrial dysfunction. A, The effect of CD47 on mitochondrial Ca2+ level during TGEV infection; B, The effect of CD47 on MMP level during TGEV infection. * p < 0.05 compared with the control. ** p < 0.01 compared with the control.
DISCUSSION
In this study, relative protein quantification was performed using TMT MS/MS to quantify proteome in presence of miR-222 mimics treatment. 100 differently expressed proteins were obtained, including 57 upregulated and 43 downregulated proteins. Based on bioinformatics analysis, miR-222 was linked to mitochondria, so we presumed that miR-222 might be involved in regulating TGEV-induced mitochondrial dysfunction. Our results indicate that miR-222 can attenuate TGEV-induced mitochondrial dysfunction by targeting THBS1 and downregulating CD47 (Fig. 11).
Fig. 11.
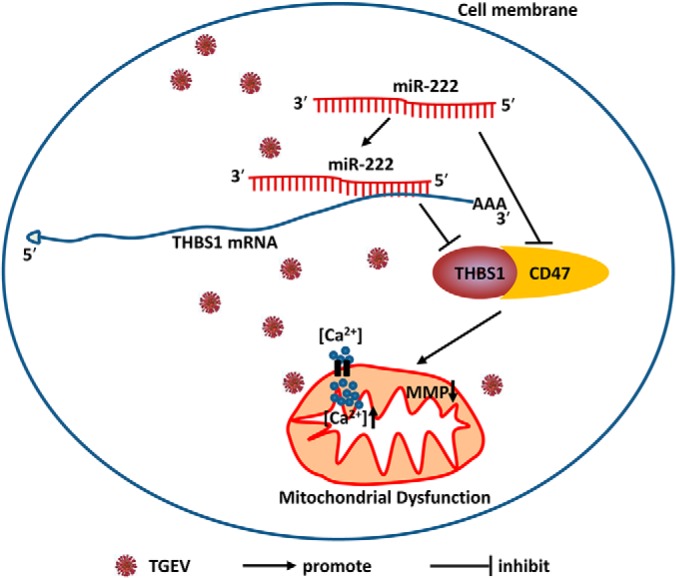
A model for miR-222 role in TGEV-induced mitochondrial dysfunction.
By quantitative proteomic analysis, 100 differentially expressed proteins were obtained. Subcellular localization and GO analysis of the 100 differentially expressed proteins showed that 18.0% proteins are located at mitochondria and prevailingly enriched in metabolic process. Among the 100 differentially expressed proteins, many mitochondrial proteins are regulated by miR-222 during TGEV infection, including MRPL11, MRPL24, MRPS26, MRPL38, MRPL46, MRPL47, NDUFV1, NDUFS1, NDUFA13, NDUFC2, and NDUFB5. MRPL11, MRPL24, MRPS26, MRPL38, MRPL46, and MRPL47 are mammalian mitochondrial ribosomal proteins and contribute to synthesis of essential mitochondrial proteins (23, 24). NDUFV1, NDUFS1, NDUFA13, NDUFC2, and NDUFB5 are NADH-dehydrogenases of mitochondria (25). NADH-dehydrogenase is one of the most important enzyme of complex I (26). Results of KEGG pathway analysis reveal that these differentially proteins are involved in ribosome, ECM-receptor interaction, oxidative phosphorylation, pyruvate metabolism, glucagon signaling pathway, and fatty acid metabolism. Results of GO and KEGG analysis show that miR-222 might be primarily involved in regulation of mitochondrial function during TGEV infection.
Mitochondria are eukaryotic organelle and mainly involved in many metabolic processes, including metabolism of glucose, fat, protein, and nucleic acid (27–30). Mitochondrial dysfunction is a key reason in many pathogenic processes, including metabolism, cell death, autophagy, and viral infection (31, 32). It was reported that depletion of miR-222 damaged mitochondrial membrane potential, indicating that miR-222 functions as an inhibitor of mitochondrial dysfunction (33). In this present study, we found that miR-222 resulted in an increase of mitochondrial membrane potential. Mitochondria have ability to take up cytoplasmic Ca2+ to maintain calcium homeostasis. But, once excessive Ca2+ enters mitochondria, mitochondria will be damaged (34). Here, we observed that mitochondrial Ca2+ level was augmented by miR-222. Our data imply miR-222 might counteract TGEV-induced mitochondrial dysfunction. These results are consistent with the previous findings.
THBS1 is a secretive glycoprotein and involved in regulation of mitochondrial function. Knockout of THBS1 results in mitochondrial dysfunction in mice (21). THBS1 can prevent mitochondrial pathway of apoptosis from being triggered (35) and inhibits palmitate-induced release of mitochondrial cytochrome c, cleavage of capase-3, and apoptosis (36), indicating THBS1 plays a role in mitochondrial function. We demonstrated that THBS1 is a regulator of mitochondrial dysfunction during TGEV infection, being consistent with the previous reports.
CD47 is a cell-surface receptor and can bind to THBS1 to form a complex to modulate mitochondrial function (22, 37). THBS1 interacting with CD47 leads to mitochondrial dysfunction by disruption of the MMP (22). We found that CD47 and THBS1 promoted mitochondrial dysfunction during TGEV infection, indicating that interaction between CD47 and THBS1 play an important role in TGEV-induced mitochondrial dysfunction.
In conclusion, we found that proteome was changed by miR-222 during TGEV infection by quantitative proteomic analysis. Moreover, miR-222 played a role in decreasing mitochondrial Ca2+ level and increasing TGEV-reduced MMP in PK-15 cells by targeting THBS1 and suppressing CD47.
DATA AVAILABILITY
The mass spectrometry proteomics data have been deposited to the ProteomeXchange Consortium via the PRIDE partner repository with the dataset identifier PXD010927 (http://www.ebi.ac.uk/pride; Project accession: PXD010927).
Supplementary Material
Footnotes
* This work was supported by grants from Natural Science Foundation of China (Grant No. 31472167), China Postdoctoral Science Foundation (Grant No. 2015M570860), Key Research and Development Project in Shaanxi Province (Grant No. 2018ZDXM-NY-064), and Central Project of Major Agricultural Technology Promotion Funds (Grant No. K3360217060).
 This article contains supplemental Tables.
1 The abbreviations used are:
- TGEV
- transmissible gastroenteritis virus
- PK-15 cells
- porcine kidney (PK) 15 cells
- PCR
- polymerase chain reaction
- miRNA
- microRNA
- THBS1
- thrombospondin-1
- CD47
- cluster of differentiation 47
- MMP
- mitochondrial membrane potential
- qRT-PCR
- quantitative reverse transcription PCR
- UTR
- untranslated region
- GO
- gene ontology
- KEGG
- Kyoto encyclopedia of genes and genomes
- MOI
- multiplicity of infection
- TMT
- tandem mass tags
- AGC
- automatic gain control
- hpi
- hours post-infection
- hpt
- hours post-transfection
- HPLC
- high performance liquid chromatography
- MS
- mass spectrometry
- LC/MS
- liquid chromatography–mass spectrometry
- LC-MS/MS
- liquid chromatography-tandem mass spectrometry.
REFERENCES
- 1. Weiss S. R., and Leibowitz J. L. (2011) Coronavirus Pathogenesis. 81, 85–164 [DOI] [PMC free article] [PubMed] [Google Scholar]
- 2. Zhao X., Song X., Bai X., Fei N., Huang Y., Zhao Z., Du Q., Zhang H., Zhang L., and Tong D. (2016) miR-27b attenuates apoptosis induced by transmissible gastroenteritis virus (TGEV) infection via targeting runt-related transcription factor 1 (RUNX1). PeerJ 4, e1635. [DOI] [PMC free article] [PubMed] [Google Scholar]
- 3. Ding Z., An K., Xie L., Wu W., Zhang R., Wang D., Fang Y., Chen H., Xiao S., and Fang L. (2017) Transmissible gastroenteritis virus infection induces NF-kappaB activation through RLR-mediated signaling. Virology 507, 170–178 [DOI] [PMC free article] [PubMed] [Google Scholar]
- 4. Guo L., Yu H., Gu W., Luo X., Li R., Zhang J., Xu Y., Yang L., Shen N., Feng L., and Wang Y. (2016) Autophagy Negatively Regulates Transmissible Gastroenteritis Virus Replication. Sci. Rep. 6, 23864. [DOI] [PMC free article] [PubMed] [Google Scholar]
- 5. Ding L., Xu X., Huang Y., Li Z., Zhang K., Chen G., Yu G., Wang Z., Li W., and Tong D. (2012) Transmissible gastroenteritis virus infection induces apoptosis through FasL- and mitochondria-mediated pathways. Vet. Microbiol. 158, 12–22 [DOI] [PMC free article] [PubMed] [Google Scholar]
- 6. Ding L., Zhao X., Huang Y., Du Q., Dong F., Zhang H., Song X., Zhang W., and Tong D. (2013) Regulation of ROS in transmissible gastroenteritis virus-activated apoptotic signaling. Biochem. Biophys. Res. Commun. 442, 33–37 [DOI] [PMC free article] [PubMed] [Google Scholar]
- 7. Zhong Z., Umemura A., Sanchez-Lopez E., Liang S., Shalapour S., Wong J., He F., Boassa D., Perkins G., Ali S. R., Mcgeough M. D., Ellisman M. H., Seki E., Gustafsson A. B., Hoffman H. M., Diaz-Meco M. T., Moscat J., and Karin M. (2016) NF-kappaB restricts inflammasome activation via elimination of damaged mitochondria. Cell 164, 896–910 [DOI] [PMC free article] [PubMed] [Google Scholar]
- 8. Kalogianni D. P., Kalligosfyri P. M., Kyriakou I. K., and Christopoulos T. K. (2018) Advances in microRNA analysis. Anal. Bioanal. Chem. 410, 695–713 [DOI] [PubMed] [Google Scholar]
- 9. Balasubramaniam M., Pandhare J., and Dash C. (2018) Are microRNAs Important Players in HIV-1 Infection? An Update. Viruses 10, 110–145 [DOI] [PMC free article] [PubMed] [Google Scholar]
- 10. Moyano A. L., Steplowski J., Wang H., Son K. N., Rapolti D. I., Marshall J., Elackattu V., Marshall M. S., Hebert A. K., Reiter C. R., Ulloa V., Pituch K. C., Givogri M. I., Lu Q. R., Lipton H. L., and Bongarzone E. R. (2018) microRNA-219 reduces viral load and pathologic changes in Theiler's virus-induced demyelinating disease. Mol. Ther. 26, 730–743 [DOI] [PMC free article] [PubMed] [Google Scholar]
- 11. Bienertova-Vasku J., Sana J., and Slaby O. (2013) The role of microRNAs in mitochondria in cancer. Cancer Lett. 336, 1–7 [DOI] [PubMed] [Google Scholar]
- 12. Wu W., Chen X., Yu S., Wang R., Zhao R., and Du C. (2018) microRNA-222 promotes tumor growth and confers radioresistance in nasopharyngeal carcinoma by targeting PTEN. Mol. Med. Rep. 17, 1305–1310 [DOI] [PubMed] [Google Scholar]
- 13. Song X., Zhao X., Huang Y., Xiang H., Zhang W., and Tong D. (2015) Transmissible gastroenteritis virus (TGEV) infection alters the expression of cellular microRNA species that affect transcription of TGEV gene 7. Int. J. Biol. Sci. 11, 913–922 [DOI] [PMC free article] [PubMed] [Google Scholar]
- 14. Zhao X., Bai X., Guan L., Li J., Song X., Ma X., Guo J., Zhang Z., Du Q., Huang Y., and Tong D. (2018) microRNA-4331 promotes transmissible gastroenteritis virus (TGEV)-induced mitochondrial damage via targeting RB1, upregulating interleukin-1 receptor accessory protein (IL1RAP), and activating p38 MAPK pathway in vitro. Mol. Cell. Proteomics 17, 190–204 [DOI] [PMC free article] [PubMed] [Google Scholar]
- 15. Ding L., Chen G. D., Xu X. G., and Tong D. W. (2011) Isolation and identification of porcine transmissible gastroenteritis virus Shaanxi strain and sequence analysis of its N gene. Chin. J. Vet. Med. 47, 9–11 [Google Scholar]
- 16. Livak K. J., and Schmittgen T. D. (2001) Analysis of relative gene expression data using real-time quantitative PCR and the 2-ΔΔCT method. Methods 25, 402–408 [DOI] [PubMed] [Google Scholar]
- 17. Cox J., Matic I., Hilger M., Nagaraj N., Selbach M., Olsen J. V., and Mann M. (2009) A practical guide to the MaxQuant computational platform for SILAC-based quantitative proteomics. Nat. Protoc. 4, 698–705 [DOI] [PubMed] [Google Scholar]
- 18. Vizcaino J. A., Csordas A., Del-Toro N., Dianes J. A., Griss J., Lavidas I., Mayer G., Perez-Riverol Y., Reisinger F., Ternent T., Xu Q. W., Wang R., and Hermjakob H. (2016) 2016 update of the PRIDE database and its related tools. Nucleic Acids Res. 44, 11033. [DOI] [PMC free article] [PubMed] [Google Scholar]
- 19. Szklarczyk D., Franceschini A., Kuhn M., Simonovic M., Roth A., Minguez P., Doerks T., Stark M., Muller J., Bork P., Jensen L. J., and Von Mering C. (2011) The STRING database in 2011: functional interaction networks of proteins, globally integrated and scored. Nucleic Acids Res. 39, D561–D568 [DOI] [PMC free article] [PubMed] [Google Scholar]
- 20. Song X., Zhao X., Huang Y., Xiang H., Zhang W., and Tong D. (2015) Transmissible Gastroenteritis Virus (TGEV) Infection alters the expression of cellular microRNA species that affect transcription of TGEV gene 7. Int. J. Biol. Sci. 11, 913–922 [DOI] [PMC free article] [PubMed] [Google Scholar]
- 21. Soto-Pantoja D. R., Sipes J. M., Martin-Manso G., Westwood B., Morris N. L., Ghosh A., Emenaker N. J., and Roberts D. D. (2016) Dietary fat overcomes the protective activity of thrombospondin-1 signaling in the Apc(Min/+) model of colon cancer. Oncogenesis, 5, e230. [DOI] [PMC free article] [PubMed] [Google Scholar]
- 22. Frazier E. P., Isenberg J. S., Shiva S., Zhao L., Schlesinger P., Dimitry J., Abu-Asab M. S., Tsokos M., Roberts D. D., and Frazier W. A. (2011) Age-dependent regulation of skeletal muscle mitochondria by the thrombospondin-1 receptor CD47. Matrix Biol, 30, 154–161 [DOI] [PMC free article] [PubMed] [Google Scholar]
- 23. Cavdar Koc E., Burkhart W., Blackburn K., Moseley A., and Spremulli L. L. (2001) The small subunit of the mammalian mitochondrial ribosome. Identification of the full complement of ribosomal proteins present. J. Biol. Chem. 276, 19363–19374 [DOI] [PubMed] [Google Scholar]
- 24. Kenmochi N., Suzuki T., Uechi T., Magoori M., Kuniba M., Higa S., Watanabe K., and Tanaka T. (2001) The human mitochondrial ribosomal protein genes: mapping of 54 genes to the chromosomes and implications for human disorders. Genomics. 77, 65–70 [DOI] [PubMed] [Google Scholar]
- 25. Hirst J. (2013) Mitochondrial Complex I. Annu. Rev. Biochem. 82, 551–575 [DOI] [PubMed] [Google Scholar]
- 26. Liu C., Fetterman J. L., Liu P., Luo Y., Larson M. G., Vasan R. S., Zhu J., and Levy D. (2018) Deep sequencing of the mitochondrial genome reveals common heteroplasmic sites in NADH dehydrogenase genes. Hum. Genet. 137, 203–213 [DOI] [PMC free article] [PubMed] [Google Scholar]
- 27. Lee C., Kim K. H., and Cohen P. (2016) MOTS-c: A novel mitochondrial-derived peptide regulating muscle and fat metabolism. Free Radic. Biol. Med. 100, 182–187 [DOI] [PMC free article] [PubMed] [Google Scholar]
- 28. Desler C., Lykke A., and Rasmussen L. J. (2010) The effect of mitochondrial dysfunction on cytosolic nucleotide metabolism. J. Nucleic Acids 47, 1230–1243 [DOI] [PMC free article] [PubMed] [Google Scholar]
- 29. Samardzic K., and Rodgers K. J. (2017) Oxidised protein metabolism: recent insights. Biol. Chem. 398, 1165–1175 [DOI] [PubMed] [Google Scholar]
- 30. Heier C., and Haemmerle G. (2016) Fat in the heart: The enzymatic machinery regulating cardiac triacylglycerol metabolism. Biochim. Biophys. Acta 1861, 1500–1512 [DOI] [PubMed] [Google Scholar]
- 31. Guo R., Davis D., and Fang Y. (2018) Intercellular transfer of mitochondria rescues virus-induced cell death but facilitates cell-to-cell spreading of porcine reproductive and respiratory syndrome virus. Virology 517, 122–134 [DOI] [PubMed] [Google Scholar]
- 32. Lindqvist L. M., Frank D., Mcarthur K., Dite T. A., Lazarou M., Oakhill J. S., Kile B. T., and Vaux D. L. (2018) Autophagy induced during apoptosis degrades mitochondria and inhibits type I interferon secretion. Cell Death Differ. 25, 782–794 [DOI] [PMC free article] [PubMed] [Google Scholar]
- 33. Zhang C. Z., Zhang J. X., Zhang A. L., Shi Z. D., Han L., Jia Z. F., Yang W. D., Wang G. X., Jiang T., You Y. P., Pu P. Y., Cheng J. Q., and Kang C. S. (2010) MiR-221 and miR-222 target PUMA to induce cell survival in glioblastoma. Mol. Cancer 9, 229. [DOI] [PMC free article] [PubMed] [Google Scholar]
- 34. Wang H. W., Liu J., Zhao J., Lin L., Zhao W. P., Tan P. P., Tian W. S., and Zhou B. H. (2018) Ca(2+) metabolic disorder and abnormal expression of cardiac troponin involved in fluoride-induced cardiomyocyte damage. Chemosphere 201, 564–570 [DOI] [PubMed] [Google Scholar]
- 35. Cunha D. A., Cito M., Grieco F. A., Cosentino C., Danilova T., Ladriere L., Lindahl M., Domanskyi A., Bugliani M., Marchetti P., Eizirik D. L., and Cnop M. (2017) Pancreatic beta-cell protection from inflammatory stress by the endoplasmic reticulum proteins thrombospondin 1 and mesencephalic astrocyte-derived neutrotrophic factor (MANF). J. Biol. Chem. 292, 14977–14988 [DOI] [PMC free article] [PubMed] [Google Scholar]
- 36. Cunha D. A., Cito M., Carlsson P. O., Vanderwinden J. M., Molkentin J. D., Bugliani M., Marchetti P., Eizirik D. L., and Cnop M. (2016) Thrombospondin 1 protects pancreatic beta-cells from lipotoxicity via the PERK-NRF2 pathway. Cell Death Differ. 23, 1995–2006 [DOI] [PMC free article] [PubMed] [Google Scholar]
- 37. Jeanne A., Boulagnon-Rombi C., Devy J., Theret L., Fichel C., Bouland N., Diebold M. D., Martiny L., Schneider C., and Dedieu S. (2016) Matricellular TSP-1 as a target of interest for impeding melanoma spreading: towards a therapeutic use for TAX2 peptide. Clin. Exp. Metastasis 33, 637–649 [DOI] [PubMed] [Google Scholar]
Associated Data
This section collects any data citations, data availability statements, or supplementary materials included in this article.
Supplementary Materials
Data Availability Statement
The mass spectrometry proteomics data have been deposited to the ProteomeXchange Consortium via the PRIDE partner repository with the dataset identifier PXD010927 (http://www.ebi.ac.uk/pride; Project accession: PXD010927).


