Abstract
Background
Population rates of obesity, hypertension, diabetes, age, and race can be used in simulation models to develop projections of ESRD incidence and prevalence. Such projections can inform long-range planning for ESRD resources needs.
Methods
We used an open compartmental simulation model to estimate the incidence and prevalence of ESRD in the United States through 2030 on the basis of wide-ranging projections of population obesity and ESRD death rates. Population trends in age, race, hypertension, and diabetes were on the basis of data from the Centers for Disease Control and Prevention’s National Health and Nutrition Examination Survey and the US Census.
Results
The increase in ESRD incidence rates within age and race groups has leveled off and/or declined in recent years, but our model indicates that population changes in age and race distribution, obesity and diabetes prevalence, and ESRD survival will result in a 11%–18% increase in the crude incidence rate from 2015 to 2030. This incidence trend along with reductions in ESRD mortality will increase the number of patients with ESRD by 29%–68% during the same period to between 971,000 and 1,259,000 in 2030.
Conclusions
The burden of ESRD will increase in the United States population through 2030 due to demographic, clinical, and lifestyle shifts in the population and improvements in RRT. Planning for ESRD resource allocation should allow for substantial continued growth in the population of patients with ESRD. Future interventions should be directed to preventing the progression of CKD to kidney failure.
Keywords: United States Renal Data System, end stage kidney disease, computer simulation, demographic trends
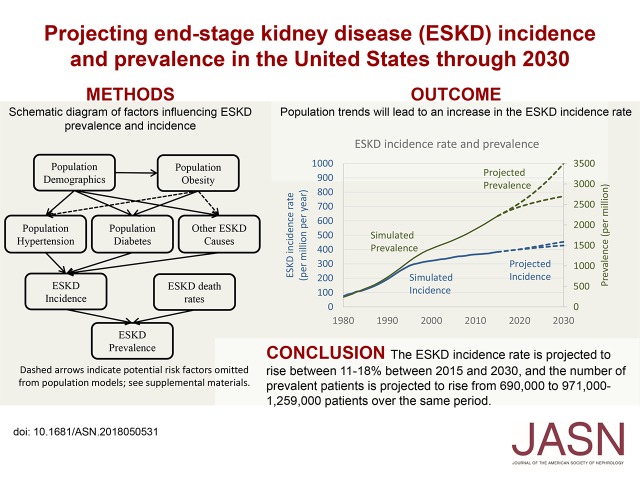
Visual Abstract
At the end of 2015, there were 687,093 people with ESRD in the United States, defined in the US Renal Data System (USRDS) and in this study as patients formally registered to receive maintenance dialysis or transplantation as RRTs.1 In 2013, 79% of patients with ESRD had Medicare as either the primary (416,808 patients) or secondary (57,677 patients) payer. Patients with ESRD represent 1% of the Medicare population but account for 7% of Medicare’s expenditures.2 It is important to estimate future trends in this large population with substantial costs to properly allocate the resources needed for their care.
Although the crude (overall) ESRD incidence rate has been increasing, the age-, sex-, and race-adjusted incidence of ESRD has leveled off and declined since 2009.3 However, US Census4 projections on the basis of declining death rates in the general population and changes in the racial demographics of the country indicate an aging, more racially diverse general population, which forms a growing at-risk pool of potential patients with ESRD.
We are using a simulation model that incorporates contemporary trends in population demographics, obesity, diabetes, and hypertension to project ESRD incidence and prevalence. This work incorporates more specific diagnosis data within age and race groups in an effort to improve and update the estimates currently in the literature on ESRD prediction and projection.
Methods
Simulation Modeling Approach
To project incidence and prevalence of ESRD in the United States between 2013 and 2030, we developed a compartmental model to simulate the incidence and prevalence of certain conditions, such as diabetes and ESRD. This model is described in detail in Supplemental Appendix 1. There were two primary simulation models: a model of diabetes prevalence, primarily on the basis of population size and obesity, and a model of ESRD prevalence. The diabetes prevalence results were used as inputs in a separate simulation model of the ESRD population. Additional inputs for the ESRD model included US Census counts and projections of the number of people in each race and age group in the general population, National Health and Nutrition Examination Survey (NHANES) data on hypertension prevalence and “other” (i.e., nonhypertension and nondiabetes) diagnosis ESRD incidence rates, and ESRD death rates. Transition rates between compartments were modeled as changing from year to year using a restricted cubic spline estimate with knots in 1988 and 1999. Parameters for these spline estimates were determined using Nelder–Mead optimization5 (via the “optim” function in R6) on the sum of squared error in diabetes prevalence on the basis of the NHANES data for the diabetes model and the USRDS data on ESRD incidence rates for the ESRD model. Prevalence was modeled using incidence and death as the primary means of entry and exit from the prevalent population as shown in Supplemental Figure 1. The simulation model was then used with US Census projections, extrapolated “other” diagnosis ESRD incidence rates, and hypothetical obesity and ESRD death rate projections to project ESRD incidence and prevalence through 2030. Uncertainty in projected ESRD incidence and prevalence was calculated using ranges of projected inputs instead of through confidence intervals, which produced unrealistically narrow estimates (Supplemental Appendix 2). Programming for the simulation model was performed using the R v. 2.15.0 statistical package.6
Demographic Categories
There are many population factors that may influence trends in ESRD incidence and prevalence, but age, race, hypertension, and diabetes are consistent and strong predictors of ESRD. Some other factors identified as important in the literature include sex, ethnicity, and body mass index (Supplemental Appendix 3). Our simulation model projections incorporate age and race group trends in hypertension and diabetes separately and combine the results for estimates of overall ESRD incidence and prevalence. The ESRD data come from the Centers for Medicare & Medicaid Services data as briefly described in Supplemental Appendix 4.
General Population Size Estimation and Projections
Census data for our analyses used US Census Statistical Abstracts of the United States,7 and projections beyond 2010 were taken from US Census projections.8,9 These counts were smoothed to reduce the effect of changes in question format and/or sampling methods in 2000.
Obesity Prevalence and Projections
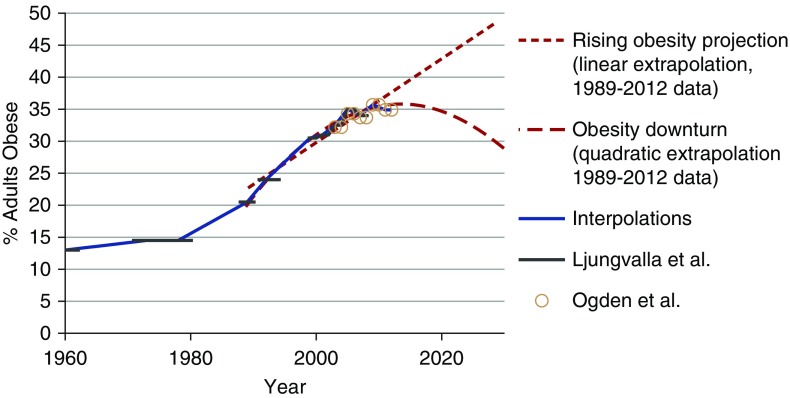
The prevalence of obesity, defined as a body mass index of 30 kg/m2 or more, may have started to level off,10 or it may continue to increase.11 There is an established progression of obesity to diabetes to kidney disease that makes obesity trends of particular interest when making predictions about the ESRD population (Supplemental Appendix 5).
For the simulation models, past obesity prevalence data were obtained from the NHANES for each age and race group.12 The two dashed lines in Figure 1 projecting the prevalence of obesity for the overall population are not intended to be specific predictions of future obesity prevalence. These projections deliberately represent an extreme range of plausible trends in the prevalence of obesity to estimate the maximum influence that changes in obesity prevalence might have on the ESRD population. We expect that the actual trend in obesity prevalence will be between these two projections. The linear and quadratic regressions used for these projections both had an R2 above 0.95 for observed trends between 1989 and 2013. These projections were performed and used separately within each age and race group and then combined to estimate the effects of these extreme projections on the sizes of the diabetes and ESRD populations.
Figure 1.
Obesity has risen, but the models cover a wide range of possible future trends. Estimated and projected trends in the prevalence of obesity (body mass index of 30+ kg/m2; percentage) between 1960 and 2030 in the general United States population. Estimated obesity prevalence from Ljungvalla et al.32 and Ogden et al.10 using the National Health and Nutrition Examination Survey data.
ESRD Incidence Attributed to Diabetes or Hypertension
ESRD incidence was obtained from the USRDS Renal Data Extraction and Referencing (RenDER) system.13 The incidence rates of ESRD for which the primary cause was attributed to diabetes or hypertension were estimated each year since 2012 separately for each age and race group. The model incorporates changes over time in the incidence of ESRD attributed to diabetes among the population with diabetes, but it does not distinguish the causes of these changes whether they are due to improved treatment of patients with diabetes or simply earlier diagnosis of diabetes, both of which could contribute to delayed onset of ESRD in this population. Additional detail on the diabetes data and modeling is available in Supplemental Figure 2 and Supplemental Appendix 5. In the simulation model, we used simulated estimates of diabetes prevalence in the general population on the basis of both linear and quadratic obesity assumptions. Similarly, we used observed hypertension prevalence data along with linear extrapolations constructed within each age and race group. Details on the hypertension data and results are available in Supplemental Appendix 6 and Supplemental Figure 3.
ESRD Death Projections
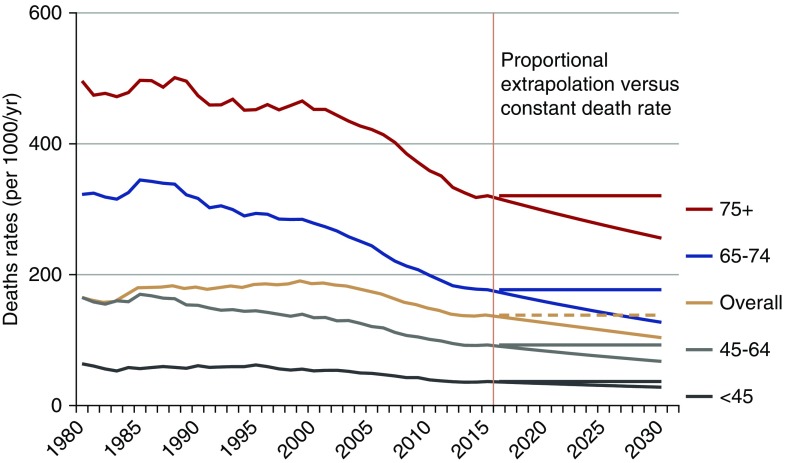
ESRD death rates were obtained from the USRDS RenDER system.13 Deaths of patients with ESRD are required to be reported by their dialysis or transplant center; Supplemental Appendix 4 has more information. The death rate among patients with ESRD has decreased over the past two decades both overall and within specific age groups, but there are some signs that this decrease may have slowed in 2013.14 We ran two models: first, assuming that the smoothened, pre-2015 downward trend continues unabated and second, assuming that the 2015 death rate remains constant through 2030. These observed trends and projections are illustrated in Figure 2, which shows both projections for each age group.
Figure 2.
Death rates among ESRD patients have fallen. Age-specific ESRD death rates (per 1000/year) by year (1980–2030), with two projections after 2012 (proportional decrease and constant death rate). The 1980–2013 data from the US Renal Data System RenDER13 with extrapolations after 2012 on the basis of proportional decrease in death rates and constant death rates.
Population Movement and Loss to Follow-Up
Although data are supposed to be reported for all United States patients with ESRD, some (<1%) are lost to follow-up each year. In addition, patients are “lost” to one age group and “gained” by another age group as patients get older or die. The net gains and losses from each age/race group were projected using a linear model attenuating the slope by 10% of its value each year, a method that has proven successful in other research areas.15
This study was conducted as part of the USRDS Coordinating Center contract with the National Institutes of Health (the National Institute of Diabetes and Digestive and Kidney Diseases); research as part of the contract has been approved by the University of Michigan’s Institutional Review Board (HUM0086162).
Results
Diabetes Prevalence Projections
The use of obesity data to predict trends in diabetes prevalence seemed to produce results that were fairly consistent with observed results through 2016 for most age and race groups as shown in Supplemental Figure 2. On the basis of the linear and quadratic projected trends in obesity prevalence after 2015 (illustrated in Figure 1), diabetes prevalence in the total population is expected to be between 11% and 13% in 2030 compared with 11% in 2015 and 2016 on the basis of the NHANES data.
Diabetes prevalence is expected to increase for most age groups, although the obesity projections have more of an effect on the older age group projections, where diabetes is more common. Diabetes prevalence in 2030 is projected to be approximately 3% among adults under age 45 years old, 19%–22% (depending on obesity projections) for those 45–64 years old, 26%–32% for those 65–74 years old, and 18%–27% for those over age 75 years old.
ESRD Incidence Projections
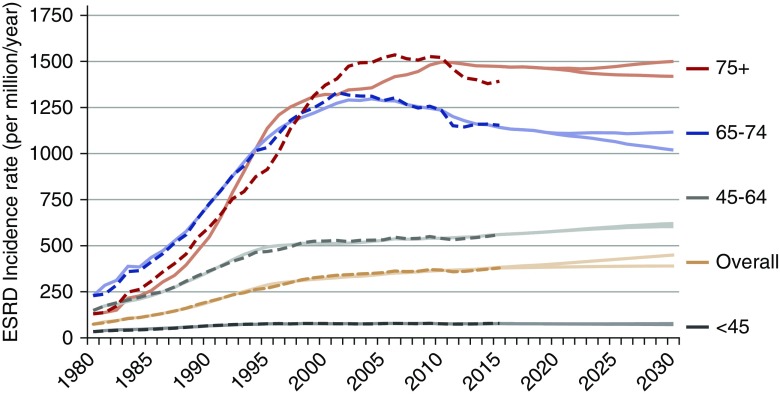
Figure 3 shows the annual ESRD incidence rate from 1980 to 2030 by age. The ESRD incidence rate increased appreciably between 1985 and 2005 for adults age 65 years old and older. The temporal trend was projected to be rather flat for those under age 45 years old: from 77 per million per year in 2015 to 72–77 per million per year in 2030. The incidence rate is projected to increase for those ages 45–64 years old from 561 per million per year in 2015 to 604–620 per million per year in 2030. There was a decline in the projected incidence for those aged 65–74 years old from 1142 per million per year in 2015 to 1019–1116 per million per year in 2030. The rate among those age 75 years old and over was more variable; the simulation model (solid curves in Figure 3) did not predict the sudden decrease observed among patients in that age group between 2010 and 2013 from 1518 to 1391 per million per year (dashed curves in Figure 3). Thus, the incidence rate projected between 2015 and 2030 was fairly flat: from 1473 per million per year in 2015 to 1419–1500 per million per year in 2030.
Figure 3.
Age-specific incidence rates have leveled off. Annual ESRD incidence rate (per million per year) from 1980 to 2030 by age, with two assumptions about the projected trend in obesity prevalence after 2012. Dashed lines represent reported data, and solid lines represent simulated data. Incident counts are from the US Renal Data System RenDER system13 (accessed January 2016). Population counts are from smoothed Centers for Disease Control and Prevention–bridged US Census data. Simulation results are on the basis of increasing obesity trend versus decreasing obesity projections.
ESRD Prevalence Projections
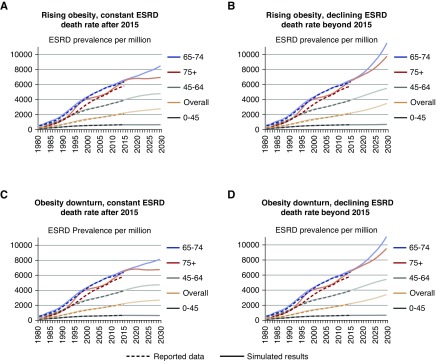
ESRD death rate projections (as illustrated in Figure 2) and ESRD incidence projections (Figure 3) were used to estimate the trends in ESRD prevalence (Supplemental Appendix 1). The increasing incidence rate along with the constant or decreasing ESRD death rates mean that the prevalence of ESRD (per million) is projected to continue to increase after 2015 as shown in Figure 4 and separately by race in Supplemental Figure 4. Each panel in Figure 4 shows simulated and projected results from one of four scenarios representing different assumptions about obesity trends and ESRD death rate trends after 2015. For adults under 45 years old, the prevalence is expected to vary between a 15-year proportional decrease of 2% to an increase of 7%. The prevalence of ESRD is expected to rise 19%–39% for adults 45–64 years old, 23%–75% for those 65–74 years old, and 4%–51% for adults over 74 years old.
Figure 4.
ESRD prevalence is increasing. (A–D) ESRD prevalence proportion (per million) by assumptions of obesity and ESRD death rate trends after 2012, age group (color coded), and year (observed [dashed curves] and simulated through 2012; projected after 2012 [solid curves]). The 1980–2012 ESRD prevalent counts are from the US Renal Data System RenDER.13 Population data are from smoothed Centers for Disease Control and Prevention–bridged US Census data. Simulation results are on the basis of increasing obesity trend versus decreasing obesity projections and constant ESRD death rate versus continued proportional decrease.
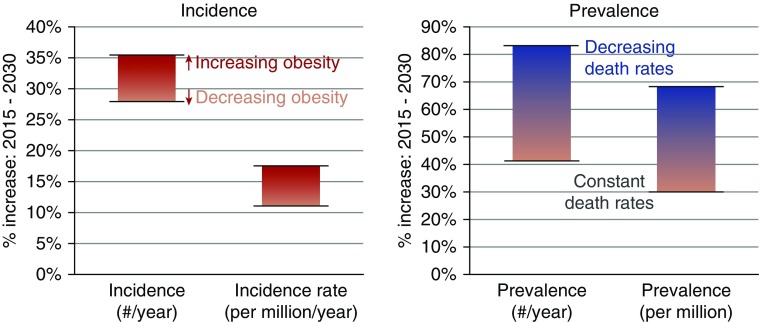
Figure 5 summarizes the results of the different projections (2015–2030) of proportional increases in the annual incidence count and rate and the annual prevalence count and proportion. The ranges shown in the vertical bars in Figure 5 represent results from the different assumptions of future trends in obesity prevalence and ESRD death rates. The projected number of patients with prevalent ESRD is expected to increase more than the prevalence (proportion), because US Census projections indicate that the size of the United States population (the denominator) will increase. The differing obesity projections changed the 2030 prevalence count by 28,000–33,000 patients, whereas the differing death rate projections changed the 2030 prevalence count by 255,000–260,000 patients.
Figure 5.
ESRD incidence and prevalence should rise by 2030. Ranges of projected increases in incidence/prevalence. Each bar represents the range of results across four sets of simulations, each with a different set of assumptions. The range of projected incidence and incidence rates are shown on the basis of the increasing obesity versus decreasing obesity assumptions. Separate bars are shown for the prevalence under differing assumptions about the ESRD death rates (constant versus decreasing death rates); the obesity assumptions made smaller differences in ESRD prevalence.
Figure 6.
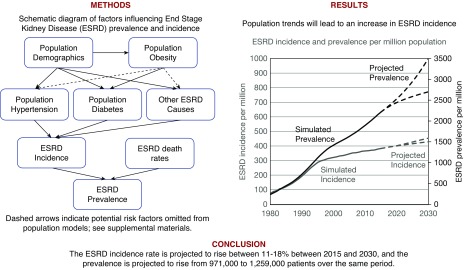
Visual abstract of factors incorporated into the simulation as influencing ESRD incidence and prevalence. Causal relationships between obesity and hypertension or other ESRD causes and additional losses (e.g., lost to follow-up) were handled as described in Supplemental Appendix 1.
As sensitivity analyses, we used data on population diabetes prevalence from the Centers for Disease Control and Prevention (CDC) National Health Interview Survey instead of the NHANES; we used two race groups (white and nonwhite) instead of three, and we used different smoothing methods across the age and race group estimates of population obesity. Results from all three sensitivity analyses supported continued growth in ESRD incidence and prevalence as in the main analyses (Supplemental Figure 5 and Supplemental Appendix 7). The two-race simulations exhibited less instability. They also generally predicted smaller growth, as did using the lower CDC diabetes prevalence estimates. The variation stemming from using different smoothing methods on the obesity estimates within each age and race group was negligible (results not shown).
Discussion
Population obesity, hypertension, diabetes, age, and race can be used to model ESRD incidence and prevalence. On the basis of these inter-relationships, we project that the annual number of incident patients, the annual number of prevalent patients, and the crude incidence rate and prevalence of ESRD will increase in the United States through 2030. There will likely be steady or decreasing age-specific incidence rates of ESRD during this period, possibly due to improvements in care, but these will be offset by increases in the older and the nonwhite United States population, even if obesity prevalence is controlled.
Some prior work developing projections of ESRD incidence and prevalence has used methods insensitive to underlying changes in population and specific causes of incidence. Port et al.16 successfully bracketed the actual 2000 ESRD prevalence by plotting both linear and exponential growth curves on data through 1997. A stepwise autoregressive method with exponential smoothing came within 10% of the 2010 prevalence on the basis of 1982–1997 data.17
The simulation model by Gilbertson et al.18 used linear projections of the diabetic and nondiabetic populations to project ESRD incidence and prevalence in a compartmental model. Their compartments were defined by incidence, prevalence, diabetes status, and mortality over seven age groups, three race groups, and two diagnosis groups (diabetic and nondiabetic). Their results were generally within 10% of the USRDS-reported ESRD incidence and prevalence in 2015.
Our simulations use more recent data, include more population data, and separate hypertension from other causes of ESRD. These results indicate that the overall incidence rate will continue to increase between 11% (rising to 428 per million per year in 2030 versus 386 per million per year in 2013) and 18% (rising to 453 per million per year in 2030) depending on obesity trends. Incidence counts are expected to increase to 154,000–163,000 per year, a 27%–34% increase over the 2015 incidence count of 121,542. ESRD prevalence is expected to increase to between 2700 and 3500 per million, an increase of 29%–68% over the 2015 prevalence of 2087 per million. The increasing size of the United States population will also affect the ESRD population size. The number of patients with prevalent ESRD is projected to continue to increase to between 971,000 and 1,259,000 patients by 2030, an increase of 41%–83% over the 2015 prevalence count of 687,093 patients with ESRD. The differing obesity projections varied the 2030 prevalence count by 28,000–33,000 patients, a difference in the ESRD prevalence proportion of 79–92 per million. The differing death rate projections had a larger effect than the differing obesity projections, and they varied the 2030 prevalence count by 255,000–260,000 patients or a difference in the ESRD prevalence proportion of 710–723 per million. Constant death rate projections yielded lower prevalence than decreasing death rate projections; in other words, if new or existing treatments decrease ESRD death rates, we can expect a substantially larger ESRD population.
The United States population is expected to continue to age both through the baby boomer effect and through generally increased lifespans. Because age is strongly associated with ESRD incidence, the aging population will offset the decreasing age-specific incidence rates shown in Figure 3, resulting in an increasing crude incidence rate of ESRD.19 This is not new; the age-, sex-, and race-adjusted incidence rate of ESRD has been decreasing since 2006,20 but the aging population has resulted in an increasing overall crude incidence rate and count. Similar trends have been seen in Japan.21
Another consequence of the aging United States population is an aging ESRD population. In 2013, approximately 40% of all patients with ESRD were older than 65 years old. In 2030, we project that this proportion will increase to 55%–61% depending mainly on whether the death rate in the ESRD population continues to remain constant (55%–56%) or decline (61%) (Supplemental Figure 6). The aging ESRD population will likely affect the types of care provided to the dialysis population, resulting in increases in the resources required for the dialysis population beyond the quantitative increases projected in these analyses. Although the patient count is expected to increase up to 88% by 2030, the cost to Medicare, already exceeding $30 billion/year, may grow well beyond this percentage increase due to the complications associated with caring for an increasingly older population, unless costs per patient are somehow reduced (e.g., through increasing use of more economical treatment modalities for ESRD, such as peritoneal dialysis and home hemodialysis, both of which are cheaper than in-center hemodialysis).22,23
Our findings indicate an increase in ESRD prevalence through 2030. It is imperative to develop new treatment and prevention options that will ameliorate this projected trend. The best long-term approach is to prevent patients from reaching ESRD in the first place, perhaps through better obesity, diabetes, and hypertension prevention and management programs. If genetic markers, such as APOL1, are causal risk factors in the etiology of ESRD24, then treatments that address these factors could result in lower ESRD incidence overall and substantially reduced racial disparities in ESRD incidence. A number of studies of sodium-glucose cotransporter 2 inhibitors among patients who are diabetic and patients who are not diabetic have shown slowed progression to kidney disease end points, preventing albuminuria and/or substantial reduction in kidney function as measured by the eGFR.25 These treatments and other new treatments could continue or accelerate current trends in decreasing age-specific ESRD incidence.
We expect that we will also need alternative treatments that will both improve patient outcomes and reduce the resources needed for the ESRD population. In-center dialysis is one of the more expensive options for ESRD care in the long term.26 Patient survival and other outcomes are generally better with a transplant compared with dialysis,27 and increasing use of these options would reduce the overall resources needed to care for this population. Recent improvements in transplantation allocation have helped reduce racial disparities and are likely to produce better results for the people who receive kidney transplants.28,29 Work is progressing on alternatives to dialysis and donated organ transplantation, including artificial kidneys.30 We need to continue to develop innovative, patient-centered approaches that provide more options to continue providing the needed care for these patients.
The projections in this study assume that recent trends in the population and in the process of transitioning to ESRD will continue and that death rates among patients with ESRD will stay within the wide range assumed in our analysis. Although we attempted to portray the effects of reasonably wide ranges of future trends in obesity and ESRD care, new disruptive changes in the treatment among any of these populations will have cascading effects through the entire system that will not be reflected in these analyses. These effects may lag the introduction of the treatment, especially if the treatment is “upstream” in the causal chain, such as with the SGLT2 or APOL1 studies. Alternatively, large increases in transplantation instead of dialysis, through technological advancements or legislative changes, would reduce the overall death rate of ESRD, resulting in larger ESRD population sizes than we have projected. Any effects of these new developments, however, would have to be extreme to substantially affect the ESRD population by 2030.
An alternative treatment for people with ESRD is conservative management (i.e., managing symptoms without RRT [dialysis or transplantation]). This option was not included in our projections. Frail, elderly patients may be choosing conservative management more frequently over time instead of dialysis or transplantation.31 If this is true, then the incidence of RRT and early death rates among those patients may be lower than our projections.
The aging population; the increasing proportion of blacks in the United States population; the rising prevalence of comorbid conditions, such as diabetes and hypertension; and decreasing ESRD death rates (e.g., due to improved treatment of patients with ESRD) have made an increasing prevalence of ESRD in the United States population very likely, even with future improvements in slowing CKD progression to ESRD. On the basis of our findings, any plans for ESRD resource allocation should allow for substantial continued growth in the size of the population of patients with prevalent ESRD through 2030 through increasing ESRD incidence and possibly, also through decreasing ESRD death rates. This has strong implications for planning of dialysis infrastructure (dialysis facilities, provisions for home hemodialysis, increased peritoneal dialysis use, etc.) and Medicare and Medicaid budgeting. We need to continue developing innovative approaches to prevent ESRD and care for patients with ESRD to address this growing need.
Disclosures
The employer of K.P.M. and B.M.R., Arbor Research Collaborative for Health, has received funding for projects that they have worked on from Amgen, Kyowa Hakko Kirin, Baxter Healthcare, AstraZeneca, Fresenius Medical Care Asia-Pacific Ltd, Janssen, Keryx, Proteon, Roche, and Vifor Fresenius Medical Care Renal Pharma. All support is provided without restrictions on publications. All grants are made to Arbor Research Collaborative for Health and are not made to K.P.M. or B.M.R. directly. H.M. is a consultant at Arbor Research Collaborative for Health. R.S. is the Director of the US Renal Data System (USRDS) Coordinating Center at the University of Michigan. Co-Deputy Directors include Vahakn Shahinian (University of Michigan) and B.M.R. National Institute of Diabetes and Digestive and Kidney Diseases Project Officers are Kevin C. Abbott and Lawrence Y.C. Agodoa. The USRDS Coordinating Center is located at the Kidney Epidemiology and Cost Center, University of Michigan in partnership (subcontract) with Arbor Research Collaborative for Health (Ann Arbor, MI). W.H.H. has nothing to declare.
Supplementary Material
Acknowledgments
The authors would like to acknowledge the contributions of Drs. Rafael Meza, Debbie Gipson, and Michael Heung, all of whom provided insightful comments and advice during the development of this manuscript.
This project was funded in part with federal funds from National Institute of Diabetes and Digestive and Kidney Diseases (NIDDK), National Institutes of Health (NIH), Department of Health and Human Services contract HHSN276201400001C. The data reported here have been supplied by the US Renal Data System (USRDS), which is funded by the NIDDK through NIH contract HHSN276201400001C.
The interpretation and reporting of these data are the responsibility of the authors and in no way should be seen as an official policy or interpretation of the US Government. The funder had no role in the study design, data collection, data analysis, data interpretation, or writing of the report.
Footnotes
Published online ahead of print. Publication date available at www.jasn.org.
See related editorial, “Growth of the ESKD Population: Progress or Peril?,” on pages 3–4.
This article contains the following supplemental material online at http://jasn.asnjournals.org/lookup/suppl/doi:10.1681/ASN.2018050531/-/DCSupplemental.
Supplemental Material
Supplemental Appendix 1. Simulation modeling approach.
Supplemental Appendix 2. Discussion of confidence intervals around population estimates.
Supplemental Appendix 3. ESRD demographics.
Supplemental Appendix 4. CMS ESRD reporting requirements.
Supplemental Appendix 5. Diabetes.
Supplemental Appendix 6. Hypertension and other ESRD causes.
Supplemental Appendix 7. Sensitivity to racial categories, source of diabetes information.
Supplemental Figure 1. Compartmental model.
Supplemental Figure 2. Annual diabetes prevalence from 1980 to 2013 by age group for racial groups used in simulation: (A) white, (B) black, and (C) other.
Supplemental Figure 3. Prevalence of hypertension by year, age, and race group on the basis of NHANES data.
Supplemental Figure 4. (A–D) ESRD prevalence proportion (per million) by assumptions of obesity and ESRD death rate trends after 2012, age/race group (color coded), and year (observed [dashed curves] and simulated through 2012; projected after 2012 [solid curves]).
Supplemental Figure 5. ESRD projections based on different data sources and race groups.
Supplemental Figure 6. Age distribution of prevalent ESRD patients, by obesity assumption and death rate assumption.
References
- 1.United States Renal Data System : Medicare expenditures for persons with ESRD. In: 2017 USRDS Annual Data Report: Epidemiology of Kidney Disease in the United States, Bethesda, MD, National Institutes of Health, National Institute of Diabetes and Digestive and Kidney Diseases, 2017. Available at: http://www.usrds.org. Accessed February 8, 2018 [Google Scholar]
- 2.United States Renal Data System : Medicare expenditures for persons with ESRD. In: 2015 USRDS Annual Data Report: Epidemiology of kidney disease in the United States, Bethesda, MD, National Institutes of Health, National Institute of Diabetes and Digestive and Kidney Diseases, 2015. Available at: http://www.usrds.org. Accessed February 8, 2018 [Google Scholar]
- 3.United States Renal Data System : Incidence, prevalence, patient characteristics, and treatment modalities. In: 2015 USRDS Annual Data Report: Epidemiology of kidney disease in the United States, Bethesda, MD, National Institutes of Health, National Institute of Diabetes and Digestive and Kidney Diseases, 2015. Available at: http://www.usrds.org. Accessed February 8, 2018 [Google Scholar]
- 4.United States Census Bureau : Older People Projected to Outnumber Children for First Time in U.S. History, 2018. Available at: https://www.census.gov/newsroom/press-releases/2018/cb18-41-population-projections.html. Accessed May 1, 2018
- 5.Nelder JA, Mead R: A simplex method for function minimization. Comput J 7: 308–313, 1965 [Google Scholar]
- 6.R Core Team : R: A Language and Environment for Statistical Computing, 2015. Available at: http://www.R-project.org/. Accessed September 1, 2015
- 7.U.S. Census Bureau : Statistical Abstract Series. Available at: https://www.census.gov/library/publications/time-series/statistical_abstracts.html. Accessed January 8, 2016
- 8.U.S. Census Bureau: 2000 National Population Projections: Detailed Data Files (Total Population by Age, Sex, Race, and Hispanic Origin). Available at: http://www.census.gov/population/projections/data/national/np-d1.html. Accessed January 8, 2016
- 9.U.S. Census Bureau : 2014 National Projections: Summary Tables. Table 1. Available at: http://www.census.gov/population/projections/data/national/2014/summarytables.html. Accessed January 8, 2016
- 10.Ogden CL, Carroll MD, Kit BK, Flegal KM: Prevalence of childhood and adult obesity in the United States, 2011-2012. JAMA 311: 806–814, 2014 [DOI] [PMC free article] [PubMed] [Google Scholar]
- 11.Hales CM, Fryar CD, Carroll MD, Freedman DS, Ogden CL: Trends in obesity and severe obesity prevalence in US youth and adults by sex and age, 2007-2008 to 2015-2016. JAMA 319: 1723–1725, 2018 [DOI] [PMC free article] [PubMed] [Google Scholar]
- 12.Centers for Disease Control and Prevention (CDC): National Center for Health Statistics (NCHS). National Health and Nutrition Examination Survey Data. Available at: http://www.cdc.gov/nchs/hdi.htm. Accessed February 8, 2016
- 13.USRDS Renal Data Extraction and Referencing (RenDER) System : Version 3.0. Available at: http://www.usrds.org/render/xrender_home.asp. Accessed May 1, 2018
- 14.United States Renal Data System: Mortality. In: 2017 USRDS Annual Data Report: Epidemiology of Kidney Disease in the United States, Bethesda, MD, National Institutes of Health, National Institute of Diabetes and Digestive and Kidney Diseases, 2017. Available at: http://www.usrds.org. Accessed February 8, 2018 [Google Scholar]
- 15.Møller B, Fekjaer H, Hakulinen T, Sigvaldason H, Storm HH, Talbäck M, et al.: Prediction of cancer incidence in the Nordic countries: Empirical comparison of different approaches. Stat Med 22: 2751–2766, 2003 [DOI] [PubMed] [Google Scholar]
- 16.Port FK: End-stage renal disease: Magnitude of the problem, prognosis of future trends and possible solutions. Kidney Int Suppl 50[Suppl]: S3–S6, 1995 [PubMed] [Google Scholar]
- 17.Xue JL, Ma JZ, Louis TA, Collins AJ: Forecast of the number of patients with end-stage renal disease in the United States to the year 2010. J Am Soc Nephrol 12: 2753–2758, 2001 [DOI] [PubMed] [Google Scholar]
- 18.Gilbertson DT, Liu J, Xue JL, Louis TA, Solid CA, Ebben JP, et al.: Projecting the number of patients with end-stage renal disease in the United States to the year 2015. J Am Soc Nephrol 16: 3736–3741, 2005 [DOI] [PubMed] [Google Scholar]
- 19.United States Renal Data System: Incidence, prevalence, patient characteristics, and treatment modalities. In: 2016 USRDS Annual Data Report: Epidemiology of Kidney Disease in the United States, Bethesda, MD, National Institutes of Health, National Institute of Diabetes and Digestive and Kidney Diseases, 2016. Available at: http://www.usrds.org. Accessed February 8, 2018 [Google Scholar]
- 20.United States Renal Data System: Incidence, prevalence, patient characteristics, and treatment modalities. In: 2017 USRDS Annual Data Report: Epidemiology of Kidney Disease in the United States, Bethesda, MD, National Institutes of Health, National Institute of Diabetes and Digestive and Kidney Diseases, 2017. Available at: http://www.usrds.org. Accessed February 8, 2018 [Google Scholar]
- 21.Wakasugi M, Kazama JJ, Narita I: Anticipated increase in the number of patients who require dialysis treatment among the aging population of Japan. Ther Apher Dial 19: 201–206, 2015 [DOI] [PubMed] [Google Scholar]
- 22.McFarlane PA, Pierratos A, Redelmeier DA: Cost savings of home nocturnal versus conventional in-center hemodialysis. Kidney Int 62: 2216–2222, 2002 [DOI] [PubMed] [Google Scholar]
- 23.Sinnakirouchenan R, Holley JL: Peritoneal dialysis versus hemodialysis: Risks, benefits, and access issues. Adv Chronic Kidney Dis 18: 428–432, 2011 [DOI] [PubMed] [Google Scholar]
- 24.Genovese G, Friedman DJ, Ross MD, Lecordier L, Uzureau P, Freedman BI, et al. : Association of trypanolytic ApoL1 variants with kidney disease in African Americans. Science 329: 841–845, 2010 [DOI] [PMC free article] [PubMed] [Google Scholar]
- 25.Pecoits-Filho R, Perkovic V: Are SGLT2 inhibitors ready for prime time for CKD? Clin J Am Soc Nephrol 13: 318–320, 2017 [DOI] [PMC free article] [PubMed] [Google Scholar]
- 26.Held PJ, McCormick F, Ojo A, Roberts JP: A cost-benefit analysis of government compensation of kidney donors. Am J Transplant 16: 877–885, 2016 [DOI] [PMC free article] [PubMed] [Google Scholar]
- 27.Wolfe RA, Ashby VB, Milford EL, Ojo AO, Ettenger RE, Agodoa LYC, et al.: Comparison of mortality in all patients on dialysis, patients on dialysis awaiting transplantation, and recipients of a first cadaveric transplant. N Engl J Med 341: 1725–1730, 1999 [DOI] [PubMed] [Google Scholar]
- 28.Melanson TA, Hockenberry JM, Plantinga L, Basu M, Pastan S, Mohan S, et al.: New kidney allocation system associated with increased rates of transplants among black and Hispanic patients. Health Aff (Millwood) 36: 1078–1085, 2017 [DOI] [PMC free article] [PubMed] [Google Scholar]
- 29.The Organ Procurement and Transplantation Network: The New Kidney Allocation System (KAS) Frequently Asked Questions, 2015. Available at: https://optn.transplant.hrsa.gov/media/1235/kas_faqs.pdf. Accessed September 25, 2017
- 30.NIH National Institute of Biomedical Imaging and Bioengineering: Artificial Kidney Development Advances, Thanks to Collaboration by NIBIB Quantum Grantees. Science Highlight, 2018. Available at: https://www.nibib.nih.gov/news-events/newsroom/artificial-kidney-development-advances-thanks-collaboration-nibib-quantum. Accessed February 8, 2018
- 31.Noble HR, Agus A, Brazil K, Burns A, Goodfellow NA, Guiney M, et al.: PAlliative Care in chronic Kidney diSease: The PACKS study--quality of life, decision making, costs and impact on carers in people managed without dialysis. BMC Nephrol 16: 104, 2015 [DOI] [PMC free article] [PubMed] [Google Scholar]
- 32.Ljungvalla Å, Zimmerman FJ.: Bigger bodies: long-term trends and disparities in obesity and body-mass index among US adults, 1960–2008. Social science & medicine 75: 109–119, 2012 [DOI] [PubMed] [Google Scholar]
Associated Data
This section collects any data citations, data availability statements, or supplementary materials included in this article.


