Abstract
Background
A challenge for single-cell genomic studies in kidney and other solid tissues is generating a high-quality single-cell suspension that contains rare or difficult-to-dissociate cell types and is free of both RNA degradation and artifactual transcriptional stress responses.
Methods
We compared single-cell RNA sequencing (scRNA-seq) using the DropSeq platform with single-nucleus RNA sequencing (snRNA-seq) using sNuc-DropSeq, DroNc-seq, and 10X Chromium platforms on adult mouse kidney. We validated snRNA-seq on fibrotic kidney from mice 14 days after unilateral ureteral obstruction (UUO) surgery.
Results
A total of 11,391 transcriptomes were generated in the comparison phase. We identified ten clusters in the scRNA-seq dataset, but glomerular cell types were absent, and one cluster consisted primarily of artifactual dissociation–induced stress response genes. By contrast, snRNA-seq from all three platforms captured a diversity of kidney cell types that were not represented in the scRNA-seq dataset, including glomerular podocytes, mesangial cells, and endothelial cells. No stress response genes were detected. Our snRNA-seq protocol yielded 20-fold more podocytes compared with published scRNA-seq datasets (2.4% versus 0.12%, respectively). Unexpectedly, single-cell and single-nucleus platforms had equivalent gene detection sensitivity. For validation, analysis of frozen day 14 UUO kidney revealed rare juxtaglomerular cells, novel activated proximal tubule and fibroblast cell states, and previously unidentified tubulointerstitial signaling pathways.
Conclusions
snRNA-seq achieves comparable gene detection to scRNA-seq in adult kidney, and it also has substantial advantages, including reduced dissociation bias, compatibility with frozen samples, elimination of dissociation-induced transcriptional stress responses, and successful performance on inflamed fibrotic kidney.
Keywords: RNA-sequencing, fibrosis, single cell
Great progress has been made recently in characterizing the kidney in development, homeostasis, and cancer using single-cell RNA sequencing (scRNA-seq).1–5 The high throughput and sensitivity of scRNA-seq make it well suited to comprehensively map cell-state changes during disease, but three limitations prevent wider adoption of this transformative technology for the analysis of kidney disease. First, current protocols do not accurately capture all kidney cell types, because dissociation itself may damage sensitive cells while at the same time, failing to release others that are surrounded by collagenous matrix.1 Although sampling a much larger number of cells can partially overcome this limitation, it may not be feasible financially. Second, current enzymatic and mechanical methods for single-cell dissociation introduce stress-induced transcriptional artifacts. Although cold-active proteases have mitigated this concern in easy to dissociate embryonic kidney,6 this has not been shown to work in adult or diseased kidney. Moreover, cold-active proteases still bias toward the selection of easily dissociated cell types. Finally, current approaches are incompatible with frozen archival material, which complicates analysis when tissue availability is unpredictable or the diagnosis requires time—such as renal biopsies.7
Methods
Single-Cell Dissociation and Methanol Fixation
Kidney from a C57BL/6 mouse was minced into 1-mm pieces with a razor blade and incubated at 37°C in enzyme dissociation buffer containing 250 U/ml Liberase (Roche) and 40 U/ml DNase I. After 10 minutes, the solution was transferred to a Miltenyi C-tube, and the gentleMACS D1 program was run (Miltenyi). Cells were further digested for an additional 10 minutes with trituration, and the reaction was stopped by adding 10% FBS. The dissociated cells were pelleted by centrifugation (500×g for 5 minutes), washed twice, passed through a 35-μm strainer (Falcon), and pelleted again by centrifugation (500×g for 5 minutes). Cells were resuspended in PBS plus 1% BSA and purified by FACS with optimal gates set for side scatter and forward scatter. Two million cells per kidney were collected for cell fixation. The methanol fixation protocol was adapted from Alles et al.8 In brief, cells were resuspended in 200 μl ice-cold PBS; 100% MeOH (800 μl) was prechilled to −20°C and added to the cell suspension dropwise. The MeOH-cell mixture was kept on ice for 15 minutes and then transferred to a −80°C freezer. After 7 days of storage, cells were moved from −80°C to ice and pelleted by centrifugation (2000×g for 5 minutes) at cold room. Cells were washed twice in PBS plus 0.01% BSA, filtered through 40-μm cell strainer (pluriSelect), counted, diluted, and processed for DropSeq.
Single-Nuclei Isolation
Nuclei were isolated with Nuclei EZ Lysis buffer (NUC-101; Sigma-Aldrich) supplemented with protease inhibitor (5892791001; Roche) and RNase inhibitor (N2615; Promega and AM2696; Life Technologies). Samples were cut into <2-mm pieces and homogenized using a Dounce homogenizer (885302–0002; Kimble Chase) in 2 ml of ice-cold Nuclei EZ Lysis buffer, and they were incubated on ice for 5 minutes with an additional 2 ml of lysis buffer. The homogenate was filtered through a 40-μm cell strainer (43–50040–51; pluriSelect) and then centrifuged at 500×g for 5 minutes at 4°C. The pellet was resuspended and washed with 4 ml of the buffer, and then, it was incubated on ice for 5 minutes. After another centrifugation, the pellet was resuspended in Nuclei Suspension Buffer (1× PBS, 0.07% BSA, and 0.1% RNase inhibitor), filtered through a 20-μm cell strainer (43–50020–50; pluriSelect), and counted.
Single-Cell DropSeq, sNuc-DropSeq, DroNc-seq, and sNuc-10×
We used soft lithography techniques9 to fabricate DropSeq and DroNc-seq silicon masters (The Institute of Materials Science and Engineering of Washington University in St. Louis) and cast microfluidic devices with polydimethylsiloxane.10,11 The devices were tested using regular DropSeq beads and DroNc-seq beads (ChemGenes) before use. To run DropSeq on MeOH fixed cells, we followed the protocol developed by the McCarroll laboratory (http://mccarrolllab.com/dropseq/). For sNuc-DropSeq and DroNc-seq, we made the following modifications from the original protocol. First, Ficoll PM-400 was added to the nuclei suspension buffer rather than the lysis buffer. Second, nuclei were loaded at a concentration of 200 nuclei per microliter for sNuc-DropSeq and 300 nuclei per microliter for DroNc-seq. Third, the flow rates were adjusted for each inlet channel. For sNuc-DropSeq, we used 15,000 μl/h for oil and 3000 μl/h for beads and nuclei. For DroNc-seq, we used 13,000 μl/h for oil and 2000 μl/h for beads and nuclei. Fourth, the emulsion was kept on ice for 30 minutes to allow release of nuclear RNA before the droplets were broken. After these changes, the nucleus doublet rate was maintained below 6% according to a test run from species mixing experiment. For single-nucleus 10× Chromium (sn10×), we followed the single-cell protocol provided by the manufacturer (10× Genomics) to generate high-quality cDNA libraries.
Unilateral Ureteral Obstruction Surgery
All mouse experiments were performed according to the animal experimental guidelines issued by the Animal Care and Use Committee at Washington University. Unilateral ureteral obstruction (UUO) surgeries were performed on 8-week-old C57Bl6 mice as described.12 Briefly, anesthesia was achieved with continuous evaporated isoflurane (2%) using Anesthesia System RC2 (922100; VetEqip) during surgery. Buprenorphine (0.05 mg/kg), meloxicam (1 mg/kg), and lidocaine (1%) were given subcutaneously to achieve analgesia. After flank incision, the right kidney was exposed and freed from the perirenal fat tissue, and the ureter was tied off at the level of the lower pole using two 4.0 silk ties. Wounds were closed by staples. Mice were euthanized 14 days after UUO surgery.
Bioinformatic Analyses
Bioinformatic analyses are in Supplemental Material.
Data Availability
All relevant data have been deposited in Gene Expression Omnibus under accession number GSE119531 and the RBK consortium database fully accessible at https://doi.org/10.25548/14-4KG6. A searchable database, including gene expression projected onto the t-distributed stochastic neighbor embedding (tSNE) diagrams, is also available at http://humphreyslab.com/SingleCell/.
Results and Discussion
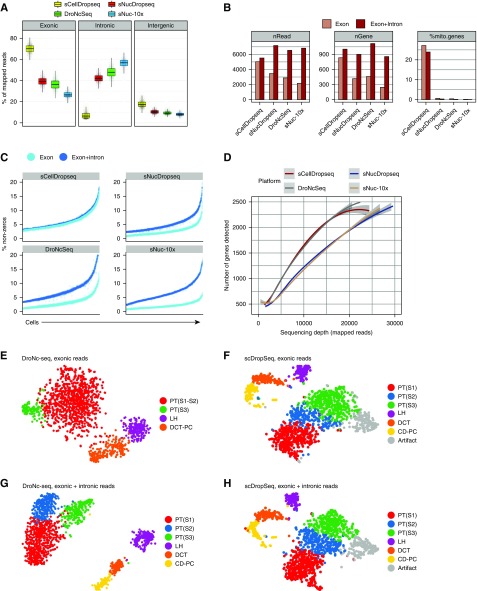
We isolated single cells from 8-week-old mouse kidney, purified by FACS to eliminate cell debris, fixed in methanol, stored at −80°C for 1 week, and then, performed DropSeq. Additionally, we modified a nuclear isolation protocol11 for kidney, prepared nuclear suspensions (Supplemental Figure 1) from snap-frozen kidney that had been stored for 1 week at −80°C, and performed single-nucleus RNA sequencing (snRNA-seq). A total of 11,391 transcriptomes were generated. Figure 1A shows that, for single-cell DropSeq (scDropSeq), a majority of mapped reads were exonic, whereas for single-nucleus DropSeq (snDropSeq), DroNc-seq, and sn10×, a majority of reads where intronic. The average number of mapped reads was similar across platforms but only if both exon and intron reads were included (Figure 1B). Surprisingly, the average number of genes detected per cell was also comparable across all four platforms as long as we used both mapped exon and intron reads, although nuclei contain substantially less mRNA than whole cells (Figure 1B). Because mitochondria are cytosolic, we only detected mitochondrial transcripts using scDropSeq, where they made up 24% of all scDropSeq genes (Figure 1B). After subtracting mitochondrial genes, all three single-nucleus techniques actually achieved superior per cell gene detection than scDropSeq. The importance of mapping both exonic and intronic reads for improved quality of the snRNA-seq datasets is illustrated by the improvement in the percentage of nonzero reads across all three platforms (Figure 1C). At lower mapped read depths, both scDropSeq and DroNc-seq detected 10%–25% more unique genes per cell than snDropSeq or sn10×; however, the difference narrowed at higher read depths (Figure 1D).
Figure 1.
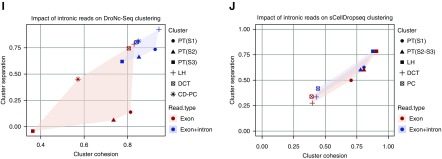
Single nucleus RNA sequencing performs equivalent to or better than single cell RNA sequencing as long as intronic reads are mapped. (A) Reads mapped to exonic, intronic, and intergenic regions according to the platform. (B) Average number of reads per cell (nRead), average number of unique genes per cell (nGene), and average percentage of mitochondrial reads per cell across platforms and according to using exonic reads only or exonic and intronic reads. (C) Percentage of nonzero reads per cell across all techniques on the basis of exonic reads alone or exonic and intronic reads. (D) Mapped reads to a gene plot30 using different platforms. Single-cell DropSeq (scDropSeq) and DroNc-seq show an advantage in the low- (10,000 mapped reads per cell) to middle-range (20,000 mapped reads per cell) sequencing depths. (E) The t-distributed stochastic neighbor embedding (tSNE) plot of 1469 epithelial cells from the DroNc-seq dataset on the basis of mapped exonic reads alone. (F) tSNE of 1469 matched epithelial cells from the scDropSeq dataset (also on the basis of exonic reads alone). (G) Improved clustering from 1469 epithelial cells from the DroNc-seq dataset using exonic plus intronic reads. (H) Few changes in clustering of 1469 matched epithelial cells from the scDropSeq dataset using exonic plus intronic reads. Cluster cohesion (average within-cluster coclustering) and separation (difference between within-cluster coclustering and maximum between-cluster coclustering)13 plotted for (I) nuclei and (J) cells. Gene expression quantification, including introns, increases cohesion and separation of nuclei but not cell clusters. CD-PC, collecting duct-principal cell; DCT, distal convoluted tubule; LH, loop of Henle; PT, proximal tubule.
We compared unsupervised clustering results using a matched set of epithelial cell and nucleus transcriptomes. Using the tubular epithelial cells common to our scDropSeq and DroNc-seq datasets, we selected the 1469 best-matching cell-nucleus pairs by calculating dropout weighted Pearson correlations as described.13 Using exonic reads alone, we could identify only four clusters from the DroNc-seq dataset, whereas the scDropSeq dataset yielded seven clusters (Figure 1, E and F). The inclusion of introns improved DroNc-seq clusters to six cell types but did not change the number of clusters for scDropSeq (Figure 1, G and H). Although scDropSeq yielded one more cluster than DroNc-seq, this was an artifact cluster expressing stress response genes induced during dissociation. Including intronic reads improved cluster cohesion (the average within cluster coclustering) and separation (the average coclustering difference with the nearest cluster) for DroNc-seq but not scDropSeq (Figure 1, I and J).13
Ambient mRNA released during tissue dissociation can contaminate scRNA-seq data. For example, highly expressed genes (for example, Slc34a1) from the highly abundant proximal tubule can be detected in all cell clusters in a recent dataset2 (Supplemental Figure 2A). We found similar tubular contamination across platforms in our data, although the degree of contamination was somewhat reduced in snRNA-seq compared with scRNA-seq (Supplemental Figure 2, B–E).
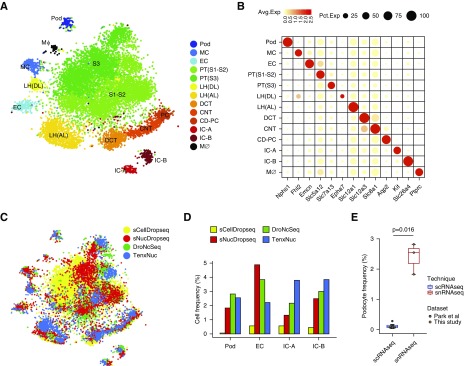
We used integrated analysis to identify conserved cell types generated using different platforms (scRNA-seq and snRNA-seq techniques) after batch correction with aligned canonical correlation analysis.14 We identified 13 clusters in the combined dataset, including podocytes, endothelial cells and mesangium, nine tubule clusters, and one macrophage cluster (Figure 2, A and B, Supplemental Material). Comparison of this dataset with three other recent kidney RNA sequencing datasets confirmed our cluster annotations (Supplemental Figure 3).2,3,15 Projecting the source of each cell onto the tSNE revealed the relative contribution of each platform to each cluster (Figure 2C). All three nuclear approaches had much better sensitivity to detect podocytes, endothelial cells, and intercalated cells (Figure 2D). In fact, when the scDropSeq data were clustered separately, there were no independent podocyte or endothelial cell clusters at all, whereas all three single-nucleus platforms identified these cell types (Supplemental Figure 4). We combined podocyte frequencies obtained from our scDropSeq as well as those from Park et al.2 and compared them with the frequencies observed in our snRNA-seq datasets. This revealed 20-fold more podocytes from snRNA-seq compared with scRNA-seq (2.4% versus 0.12%; P=0.02) (Figure 2E).
Figure 2.
Reduced dissociation bias from single-nucleus techniques. (A) The t-distributed stochastic neighbor embedding (tSNE) projection of the combined datasets reveals 13 separate clusters. CD-PC, collecting duct-principal cell; CNT, connecting tubule; DCT, distal convoluted tubule; EC, endothelial cell; IC-A, intercalated cell type A; IC-B, intercalated cell type B; LH(AL), loop of Henle ascending loop; LH(DL), loop of Henle descending loop; MΦ, macrophage; MC, mesangial cell; Pod, podocyte; PT, proximal tubule. (B) Marker gene expression across clusters for the combined dataset. (C) tSNE showing the contribution of data from each platform to all clusters. (D) Percentage of cells contributed by each platform reveals a very low contribution to podocytes, endothelial cells, and intercalated cells type A and type B from single-cell DropSeq (scDropSeq) compared with single-nucleus platforms. (E) We combined podocyte frequencies obtained from our scDropSeq (n=1) as well as those from Park et al.2 (n=7) and compared them with the frequencies observed in our single-nucleus RNA sequencing (snRNA-seq) datasets (n=3). This revealed 20-fold more podocytes from snRNA-seq (2.4%) compared with single-cell RNA sequencing (scRNA-seq; 0.12%; P=0.02).
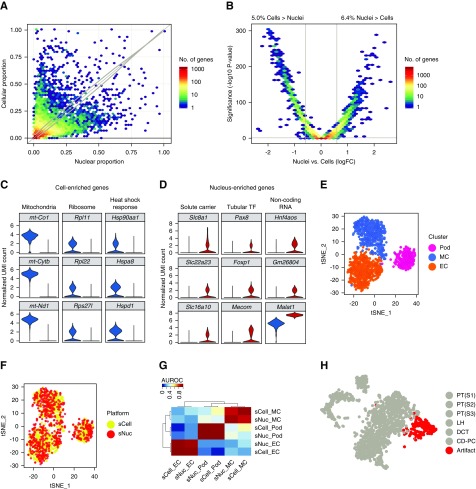
We quantitated differential gene detection in cells versus nuclei and asked how this might influence interpretation of results.16 Following a recently described analytic approach,13 we found that a majority of expressed genes (9588; 71.4%) showed similar detection (<20% difference) in nuclei and cells, whereas only 452 genes (3.4%) were detected in at least 25% more cells than nuclei, and 266 genes (2.0%) were detected in at least 25% more nuclei than cells (Figure 3A). Similarly, only 5.0% (676 genes) of detected genes were expressed more highly in cells than in nuclei (fold change >1.5; adjusted P value <0.05), and 863 genes (6.4%) were expressed more highly in nuclei than in cells (Figure 3B). Examples of genes enriched in the scDropSeq dataset included mitochondrial and ribosomal genes as well as genes in the heat shock pathway (Figure 3C). Surprisingly, nucleus-enriched genes included many genes that drive cell identity, such as solute carriers and transcription factors, consistent with a recent report from the brain.13 We could also detect long noncoding RNAs preferentially in nucleus compared with whole cell (Figure 3D).16
Figure 3.
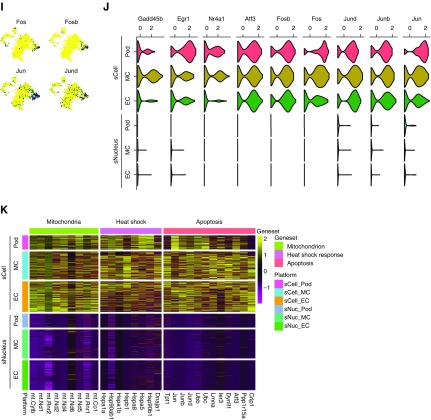
Single nucleus RNA-seq detects similar genes to single cell RNA-seq without artifactual transcriptional stress responses. (A) Binned scatterplot showing the proportion of genes detected with greater reliability in cells versus nuclei. The gray lines show the variation in detection expected by chance (95% confidence interval). (B) Binned scatterplot showing that 5.0% of genes are significantly more highly expressed (fold change >1.5; adjusted P value <0.05) in cells and that 6.4% of genes are significantly more highly expressed in nuclei. (C) Cell-enriched genes include mitochondrial and ribosomal genes as well as heat shock response genes. (D) Nuclei-enriched genes predominantly encode drivers of cell identity, such as solute carriers, transcription factors, and long noncoding RNA. (E) The 650 glomerular cells from DroNc-seq and single-nucleus DropSeq (snDropSeq) plus the 650 matched cells from a glomerular cell atlas3 coprojected by the t-distributed stochastic neighbor embedding (tSNE) reveal podocyte (Pod), mesangial cell (MC), and endothelial cell (EC) clusters. (F) Equal representation of cell and nucleus RNA sequencing data in all clusters. (G) Strong replicability of glomerular cell types between cell and nucleus datasets as defined by the area under the receiver operator characteristic curve (AUROC) score.18 (H) tSNE of epithelia from single-cell DropSeq (scDropSeq) highlighting an artifactual cluster defined by stress response gene expression induced during proteolytic dissociation. CD-PC, collecting duct-principal cell; DCT, distal convoluted tubule; LH, loop of Henle; PT, proximal tubule. (I) Immediate early gene expression in the artifactual cluster. (J) Reanalysis of the glomerular cell atlas3 reveals strong stress response gene expression among podocytes, mesangial cells, and endothelial cells. The same cells isolated by nuclear dissociation lack a stress response signature. (K) Heat map comparison of the same glomerular cell types showing strong mitochondria, heat shock, and apoptosis gene expression signature among the single-cell but not the single-nucleus dataset. FC, fold change; TF, transcription factor; UMI, unique molecular identifier.
We next asked whether these differences might alter cell classification using a recently published mouse glomerular single-cell atlas generated using DropSeq.3 We extracted podocytes, endothelial cells, and mesangial cells (650 cells total) from our snDropSeq and DroNc-seq datasets and used a random forest model to choose the 650 best-matching cells from the glomerular cell atlas.17 The combined datasets clustered into three distinct cell types (Figure 3E, Supplemental Figures 5) with equivalent contributions to each from the cell and nucleus datasets (Figure 3F). Using MetaNeighbor, we validated that each glomerular cell type identified by scDropSeq had a very high area under the receiver operator characteristic curve score for the corresponding cell type identified by snDropSeq and very low area under the receiver operator characteristic curve scores for the other two cell types (Figure 3G).18 This indicates that our snRNA-seq dataset replicates cell classification with a high degree of confidence, despite differences in abundance of some genes in nuclei versus whole cell.
Stress response genes are induced during proteolytic tissue dissociation at 37°C.6 In our scDropSeq dataset, an entirely new cluster was formed on the basis of stress response genes (Figure 3, H and I). Nuclear dissociation is carried out on ice, preventing new gene transcription. We could detect abundant stress response gene expression in all cells from the mouse glomerular atlas, which was absent from data generated by snDropSeq (Figure 3J, Supplemental Figure 7). Comparison of differential gene expression among glomerular cell types showed that mitochondrial genes, heat shock genes, and genes associated with apoptosis were detected in scDropSeq data but absent from snDropSeq data (Figure 3K).
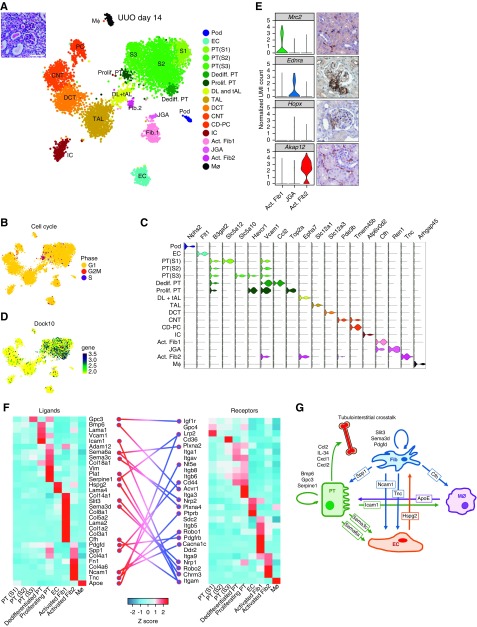
We validated our snRNA-seq protocol on fibrotic and inflamed UUO day 14 kidney; 6147 single-nucleus transcriptomes were generated on the sn10× platform, with an average of 763 unique genes and 1206 unique molecular identifiers per nucleus. Unsupervised analysis identified 17 unique cell clusters by tSNE (Figure 4A, Supplemental Material). These included two novel proximal tubule populations, one of which was characterized by a strong proliferative gene signature (Figure 4B); therefore, we annotated this cluster as proliferating proximal tubule cells. It also expressed injury markers, including Havcr1 and Vcam1 (Figure 4C). The other novel proximal tubule cluster was not cycling but expressed a strong cell movement transcriptional signature. We annotated this as a dedifferentiated proximal tubule cluster. Intriguingly, this cluster expressed some injury markers (Vcam1) but not others (Havcr1), and also, it expressed many secreted proinflammatory cytokines, including the macrophage chemoattractant Ccl2,19 the macrophage proliferative cytokine Il34,20 and the neutrophil chemoattractants Cxcl1 and Cxcl2.21 Differential gene expression between these two novel proximal tubule cell states showed that the proliferating cluster was dominated by cell cycle gene ontology terms, whereas the dedifferentiated cluster was characterized primarily by regulation of cell movement (Supplemental Figure 7). As an example, the rhoGEF Dock10 was enriched in the dedifferentiated cluster (Figure 4D), and this gene regulates cell morphogenesis via the Cdc42 pathway.22
Figure 4.
snRNA-seq of day 14 unilateral ureteral obstruction (UUO) kidney identifies rare cell types and and intercellular communication networks. (A, inset) Periodic acid–Schiff stain of UUO kidney showing dilated and cast-filled tubules and expanded and fibrotic interstitium. (A) The t-distributed stochastic neighbor embedding (tSNE) shows 17 separate cell clusters. (B) Projection of cell cycle state onto the tSNE, revealing limited proliferation primarily in the proliferating proximal tubule cluster. (C) Violin plot showing cluster-specific gene expression. (D) Dock10 expression through the proximal tubule but enriched within the dedifferentiating proximal tubule cluster. (E) Three stromal clusters could be identified, including juxtaglomerular apparatus cells expressing Endra and the stem cell marker Hopx. Immunohistochemistry images are from the Human Protein Atlas (https://www.proteinatlas.org/). (F) Cell-specific ligand-receptor analysis reveals intercellular signaling pathways. (G) Known and new intercellular signaling within the tubulintersitial compartment as revealed by this snRNA-seq analysis. Act., activating; CD-PC, collecting duct-principal cell; CNT, connecting tubule; DCT, distal convoluted tubule; Dediff., dedifferentiated; DL + tAL, descending limb + thin ascending limb; EC, endothelial cell; Fib., fibroblast; IC, intercalated cell; JGA, juxtaglomerular apparatus; MΦ, macrophage; PC, principal cell; Pod, podocyte; Prolif, proliferating; PT, proximal tubule; TAL, thick ascending limb; UMI, unique molecular identifier.
We could detect rare juxtaglomerular apparatus cells on the basis of expression of Ren1 as well as the endothelin A receptor (Figure 4E). Intriguingly, juxtaglomerular apparatus cells also expressed Hopx, a marker of adult stem cells in the intestine, brain, and hair follicle.23–25 Renin lineage cells have been proposed to serve as podocyte progentors.26 We also identified two distinct activated fibroblast populations. One of these expressed mannose receptor 2, which binds and internalizes collagen and attenuates renal fibrosis (Figure 4E).27 The other activated fibroblast cell type expressed tenascin C, which has been recently identified as an extracellular matrix glycoprotein that promotes renal fibrosis.28 Both of these cell types expressed α-smooth muscle actin, suggesting that they are distinct subsets of renal myofibroblasts.29
Finally, we analyzed receptor-ligand pairs in a cell-specific manner to illustrate how snRNA-seq can reveal unexpected intercellular communication pathways. We uncovered known (Bmp6, Pdgfd, and Spp1) and novel (Sema3c, Sema6a, Gpc, and Slit3) signaling relationships (Figure 4F). Figure 4G summarizes these fibrotic kidney tubulointerstitial crosstalk pathways.
In summary, snRNA-seq provides reduced dissociation bias and equivalent gene detection compared with scRNA-seq. This is important, because single-cell transcriptomics is costly—minimizing cell number while maximizing cell representation will reduce expenses. We show that, although snRNA-seq enriches for a smaller proportion (<7%) of different genes than scRNA-seq, many of these are either mitochondrial or artifactual stress response genes, and cell identification is not impaired. Finally, we have used our snRNA-seq protocol on an inflamed fibrotic kidney to illustrate novel cell states and a rare cell type, and with our intercellular communication map, we take an initial step in addressing a major challenge for kidney single-cell technologies: to synthesize these rich datasets with spatial information.
Disclosures
None.
Supplementary Material
Acknowledgments
Primary support for this work was from grant 173970 from the Chan Zuckerberg Initiative. Additional support was from National Institutes of Health/National Institute of Diabetes and Digestive and Kidney Diseases (NIDDK) grants DK103740 (to B.D.H.) and DK107374 (to B.D.H.) and NIDDK Diabetic Complications Consortium (www.diacomp.org) grants DK076169 and DK115255.
Footnotes
Published online ahead of print. Publication date available at www.jasn.org.
This article contains the following supplemental material online at http://jasn.asnjournals.org/lookup/suppl/doi:10.1681/ASN.2018090912/-/DCSupplemental.
Supplemental Material
Supplemental Figure 1. Nuclear preparation from adult mouse kidney.
Supplemental Figure 2. Comparison of tubular mRNA contamination across platforms.
Supplemental Figure 3. Correlation of combined single-cell and single-nucleus RNA-seq clusters with microdissected tubule segment RNA-seq, mouse kidney single-cell atlas, and mouse glomerular single-cell atlas.
Supplemental Figure 4. Clustering of all four datasets by tSNE.
Supplemental Figure 5. Violin plot showing cell-specific markers in glomerular clusters from the combined single-cell and single-nucleus dataset.
Supplemental Figure 6. Immediate early gene expression in the mouse glomerular cell atlas generated by scDropSeq.
Supplemental Figure 7. Gene ontology terms for differentially expressed genes between the proliferating and dedifferentiated proximal tubule clusters.
References
- 1.Wu H, Malone AF, Donnelly EL, Kirita Y, Uchimura K, Ramakrishnan SM, et al.: Single-cell transcriptomics of a human kidney allograft biopsy specimen defines a diverse inflammatory response. J Am Soc Nephrol 29: 2069–2080, 2018 [DOI] [PMC free article] [PubMed] [Google Scholar]
- 2.Park J, Shrestha R, Qiu C, Kondo A, Huang S, Werth M, et al.: Single-cell transcriptomics of the mouse kidney reveals potential cellular targets of kidney disease. Science 360: 758–763, 2018 [DOI] [PMC free article] [PubMed] [Google Scholar]
- 3.Karaiskos N, Rahmatollahi M, Boltengagen A, Liu H, Hoehne M, Rinschen M, et al. : A single-cell transcriptome atlas of the mouse glomerulus. J Am Soc Nephrol 29: 2060–2068, 2018 [DOI] [PMC free article] [PubMed] [Google Scholar]
- 4.Young MD, Mitchell TJ, Vieira Braga FA, Tran MGB, Stewart BJ, Ferdinand JR, et al.: Single-cell transcriptomes from human kidneys reveal the cellular identity of renal tumors. Science 361: 594–599, 2018 [DOI] [PMC free article] [PubMed] [Google Scholar]
- 5.Lindström NO, Guo J, Kim AD, Tran T, Guo Q, De Sena Brandine G, et al.: Conserved and divergent features of mesenchymal progenitor cell types within the cortical nephrogenic niche of the human and mouse kidney. J Am Soc Nephrol 29: 806–824, 2018 [DOI] [PMC free article] [PubMed] [Google Scholar]
- 6.Adam M, Potter AS, Potter SS: Psychrophilic proteases dramatically reduce single-cell RNA-seq artifacts: A molecular atlas of kidney development. Development 144: 3625–3632, 2017 [DOI] [PMC free article] [PubMed] [Google Scholar]
- 7.Malone AF, Wu H, Humphreys BD: Bringing renal biopsy interpretation into the molecular age with single-cell RNA sequencing. Semin Nephrol 38: 31–39, 2018 [DOI] [PMC free article] [PubMed] [Google Scholar]
- 8.Alles J, Karaiskos N, Praktiknjo SD, Grosswendt S, Wahle P, Ruffault PL, et al.: Cell fixation and preservation for droplet-based single-cell transcriptomics. BMC Biol 15: 44, 2017 [DOI] [PMC free article] [PubMed] [Google Scholar]
- 9.McDonald JC, Duffy DC, Anderson JR, Chiu DT, Wu H, Schueller OJ, et al.: Fabrication of microfluidic systems in poly(dimethylsiloxane). Electrophoresis 21: 27–40, 2000 [DOI] [PubMed] [Google Scholar]
- 10.Macosko EZ, Basu A, Satija R, Nemesh J, Shekhar K, Goldman M, et al.: Highly parallel genome-wide expression profiling of individual cells using nanoliter droplets. Cell 161: 1202–1214, 2015 [DOI] [PMC free article] [PubMed] [Google Scholar]
- 11.Habib N, Avraham-Davidi I, Basu A, Burks T, Shekhar K, Hofree M, et al.: Massively parallel single-nucleus RNA-seq with DroNc-seq. Nat Methods 14: 955–958, 2017 [DOI] [PMC free article] [PubMed] [Google Scholar]
- 12.Ikeda Y, Sun Z, Ru X, Vandenberghe LH, Humphreys BD: Efficient gene transfer to kidney mesenchymal cells using a synthetic adeno-associated viral vector. J Am Soc Nephrol 29: 2287–2297, 2018 [DOI] [PMC free article] [PubMed] [Google Scholar]
- 13.Bakken TE, Hodge RD, Miller JM, Yao Z, Nguyen TN, Aevermann B, et al. : Equivalent high-resolution identification of neuronal cell types with single-nucleus and single-cell RNA-sequencing. bioRxiv, 2018 [Google Scholar]
- 14.Butler A, Hoffman P, Smibert P, Papalexi E, Satija R: Integrating single-cell transcriptomic data across different conditions, technologies, and species. Nat Biotechnol 36: 411–420, 2018 [DOI] [PMC free article] [PubMed] [Google Scholar]
- 15.Lee JW, Chou CL, Knepper MA: Deep sequencing in microdissected renal tubules identifies nephron segment-specific transcriptomes. J Am Soc Nephrol 26: 2669–2677, 2015 [DOI] [PMC free article] [PubMed] [Google Scholar]
- 16.Chen LL, Carmichael GG: Altered nuclear retention of mRNAs containing inverted repeats in human embryonic stem cells: Functional role of a nuclear noncoding RNA. Mol Cell 35: 467–478, 2009 [DOI] [PMC free article] [PubMed] [Google Scholar]
- 17.Shekhar K, Lapan SW, Whitney IE, Tran NM, Macosko EZ, Kowalczyk M, et al. : Comprehensive classification of retinal bipolar neurons by single-cell transcriptomics. Cell 166: 1308–1323.e0, 2016 [DOI] [PMC free article] [PubMed] [Google Scholar]
- 18.Crow M, Paul A, Ballouz S, Huang ZJ, Gillis J: Characterizing the replicability of cell types defined by single cell RNA-sequencing data using MetaNeighbor. Nat Commun 9: 884, 2018 [DOI] [PMC free article] [PubMed] [Google Scholar]
- 19.Haller H, Bertram A, Nadrowitz F, Menne J: Monocyte chemoattractant protein-1 and the kidney. Curr Opin Nephrol Hypertens 25: 42–49, 2016 [DOI] [PubMed] [Google Scholar]
- 20.Baek JH, Zeng R, Weinmann-Menke J, Valerius MT, Wada Y, Ajay AK, et al.: IL-34 mediates acute kidney injury and worsens subsequent chronic kidney disease. J Clin Invest 125: 3198–3214, 2015 [DOI] [PMC free article] [PubMed] [Google Scholar]
- 21.Chung AC, Lan HY: Chemokines in renal injury. J Am Soc Nephrol 22: 802–809, 2011 [DOI] [PubMed] [Google Scholar]
- 22.Jaudon F, Raynaud F, Wehrlé R, Bellanger JM, Doulazmi M, Vodjdani G, et al.: The RhoGEF DOCK10 is essential for dendritic spine morphogenesis. Mol Biol Cell 26: 2112–2127, 2015 [DOI] [PMC free article] [PubMed] [Google Scholar]
- 23.Takeda N, Jain R, LeBoeuf MR, Wang Q, Lu MM, Epstein JA: Interconversion between intestinal stem cell populations in distinct niches. Science 334: 1420–1424, 2011 [DOI] [PMC free article] [PubMed] [Google Scholar]
- 24.Takeda N, Jain R, Leboeuf MR, Padmanabhan A, Wang Q, Li L, et al.: Hopx expression defines a subset of multipotent hair follicle stem cells and a progenitor population primed to give rise to K6+ niche cells. Development 140: 1655–1664, 2013 [DOI] [PMC free article] [PubMed] [Google Scholar]
- 25.Jain R, Barkauskas CE, Takeda N, Bowie EJ, Aghajanian H, Wang Q, et al.: Plasticity of Hopx(+) type I alveolar cells to regenerate type II cells in the lung. Nat Commun 6: 6727, 2015 [DOI] [PMC free article] [PubMed] [Google Scholar]
- 26.Pippin JW, Sparks MA, Glenn ST, Buitrago S, Coffman TM, Duffield JS, et al.: Cells of renin lineage are progenitors of podocytes and parietal epithelial cells in experimental glomerular disease. Am J Pathol 183: 542–557, 2013 [DOI] [PMC free article] [PubMed] [Google Scholar]
- 27.López-Guisa JM, Cai X, Collins SJ, Yamaguchi I, Okamura DM, Bugge TH, et al.: Mannose receptor 2 attenuates renal fibrosis. J Am Soc Nephrol 23: 236–251, 2012 [DOI] [PMC free article] [PubMed] [Google Scholar]
- 28.Fu H, Tian Y, Zhou L, Zhou D, Tan RJ, Stolz DB, et al.: Tenascin-C is a major component of the fibrogenic niche in kidney fibrosis. J Am Soc Nephrol 28: 785–801, 2017 [DOI] [PMC free article] [PubMed] [Google Scholar]
- 29.Humphreys BD: Mechanisms of renal fibrosis. Annu Rev Physiol 80: 309–326, 2018 [DOI] [PubMed] [Google Scholar]
- 30.Ziegenhain C, Vieth B, Parekh S, Reinius B, Guillaumet-Adkins A, Smets M, et al. : Comparative analysis of single-cell RNA sequencing methods. Mol Cell 65: 631–643.e4, 2017 [DOI] [PubMed] [Google Scholar]
Associated Data
This section collects any data citations, data availability statements, or supplementary materials included in this article.
Supplementary Materials
Data Availability Statement
All relevant data have been deposited in Gene Expression Omnibus under accession number GSE119531 and the RBK consortium database fully accessible at https://doi.org/10.25548/14-4KG6. A searchable database, including gene expression projected onto the t-distributed stochastic neighbor embedding (tSNE) diagrams, is also available at http://humphreyslab.com/SingleCell/.


