Abstract
The aberrant activation of hedgehog (HH) signaling is a leading cause of the development of medulloblastoma, a pediatric tumor of the cerebellum. The FDA-approved HH inhibitor, Vismodegib, which targets the transmembrane transducer SMO, has shown limited efficacy in patients with medulloblastoma, due to compensatory mechanisms that maintain an active HH-GLI signaling status. Thus, the identification of novel actionable mechanisms, directly affecting the activity of the HH-regulated GLI transcription factors is an important goal for these malignancies. In this study, using gene expression and reporter assays, combined with biochemical and cellular analyses, we demonstrate that mitogen-activated kinase kinase kinase 1 (MEKK1), the most upstream kinase of the mitogen-activated protein kinase (MAPK) phosphorylation modules, suppresses HH signaling by associating and phosphorylating GLI1, the most potent HH-regulated transcription factor. Phosphorylation occurred at multiple residues in the C-terminal region of GLI1 and was followed by an increased association with the cytoplasmic proteins 14-3-3. Of note, the enforced expression of MEKK1 or the exposure of medulloblastoma cells to the MEKK1 activator, Nocodazole, resulted in a marked inhibitory effect on GLI1 activity and tumor cell proliferation and viability. Taken together, the results of this study shed light on a novel regulatory mechanism of HH signaling, with potentially relevant implications in cancer therapy.
Keywords: hedgehog, medulloblastoma, GLI1, mitogen-activated kinase kinase kinase 1, phosphorylation
Introduction
The Sonic hedgehog (SHH) pathway regulates postnatal cerebellar development and its aberrant activation causes SHH-dependent medulloblastoma (SHH-MB), an aggressive pediatric cerebellar tumor (1). Hedgehog signaling is activated by the interaction of the HH ligand with the inhibitory receptor patched (PTCH). This allows the activation of the transmembrane transducer smooth-ened (SMO), which primes a signaling cascade that involves changes in the interactions between the cytoplasmic transducer SUFU and the GLI transcription factors: GLI1, GLI2 and GLI3. GLI1 and GLI2 act as activators, while GLI3 is a suppressor of hedgehog (HH)-dependent transcription (2).
GLI1 is the most potent activator, and plays a key role in tumorigenesis (3). Mutations typically found in SHH-MB include loss of function mutations of PTCH or SUFU or activating mutations of SMO or GLI2 amplifications (4). Tumors carrying PTCH or SMO mutations are eligible to be treated with the drug, Vismodegib, an FDA-approved SMO inhibitor. However, despite the initial positive response, these tumors promptly develop compensatory mechanisms (i.e., SMO mutations or the activation of collateral pathways) that restore HH signaling to the post-receptor level (5). Furthermore, Vismodegib is not effective in tumors carrying genetic alterations of SUFU or GLI, thus implying that the identification of molecules with the ability to block the signaling at the post-receptor level, i.e., at the GLI level, would be a preferable choice. In this regard, different inhibitors have been characterized to date, some directly targeting GLI, others targeting GLI modifiers (6).
GLI transcription factors are finely regulated at the post-translational level by various modifications, such as phosphorylation (7), ubiquitination (8), acetylation (9,10) and SUMOylation (11). It has previously been demonstrated that targeting some of these GLI modifications may prove to be an additional avenue with which to inhibit HH-regulated transcriptional output (12). For instance, we have previously found that the pharmacological induction of GLI1 acetylation, using selective HDAC inhibitors, efficiently turns off HH signaling, counteracts tumor growth and improves survival in preclinical models of HH-dependent tumors (13).
Phosphorylation is another key modification that plays a relevant role in the regulation of GLI function. Indeed, phosphorylation regulates proteolytic cleavage, stability, compartmentalization and the activity of GLI, which in most cases are followed by transcriptional repression (3). Hence, drugs targeting specific kinases may be used as alternative tools to prevent GLI function in medulloblastoma and other HH-driven malignancies. In this context, our group and others have found that human GLI1 is a substrate for the energy sensor AMP kinase at serine 408 (Ser408) and that this modification destabilizes GLI1 and reduces tumor formation (14,15), thus implying that AMPK agonists may be used to restrain SHH-MB growth. However, since Ser408 is conserved only in primates, preclinical studies using these compounds to test their efficacy in relevant animal models of medulloblastoma are unfortunately not feasible.
In a recent study, it was shown that also the mitogen-activated kinase kinase kinase 2 and 3, two members of the most upstream mitogen-activated protein kinase (MAPK) phosphorylation modules, phosphorylate and inhibit GLI1 and medulloblastoma growth (16). In this study, we investigated the role of another key member of the same phosphorylation module, the mitogen-activated kinase kinase kinase 1 (MEKK1) (17), in HH-dependent function and tumorigenesis. We demonstrate that MEKK1 binds and phosphorylates GLI1 at multiple residues, thus causing the inhibition of HH/Gli1 signaling and reducing HH-dependent medulloblastoma cell growth.
Materials and methods
Plasmids and reagents
The pcDNA3 MEKK1 WT, pcDNA3 MEKK1 KD plasmids were a gift from Dr G. Johnson (Addgene plasmid #12180); 8xGLI-Luc was provided by the H. Sasaki Laboratory, RIKEN Center for Developmental Biology, Kobe, Japan; 12xGLI-Luc, TK-Renilla, P1A WT-Luc and P1A Mut-Luc were from Dr R. Tofgard, Karolinska Institute, Stockholm, Sweden; FlagGLI2 was a gift from Dr A. Dlugosz, University of Michigan, Ann Arbor, MI, USA (18); pcDNA3 FlagGLI1, pcDNA3 FlagGLI1(424-1106), pcDNA3 FlagGLI1(2-413), pcDNA3 GLI1(2-413)Vp16, Gal4GLI1(424-1106) and the 5xGal-Luc reporters were as previously described in the study by Canettieri et al (9).
The pcDNA3 His-MLK3, CMV sport6-TAK1, CMV sport6-ASK1, pcDNA3TPL2 plasmids were provided by Dr U. Jhala, University of San Diego, San Diego, CA, USA. Sag was purchased from Adipogen Life Sciences (Liestal, Basel, Switzerland). Nocodazole was purchased from Sigma-Aldrich, St. Louis, MO, USA (cat. no. M1404) and calf intestinal alkaline phosphatase was purchased from New England Biolabs (cat. no. M0290S), Ipswich, MA, USA.
Cell culture and treatments
The NIH3T3 and 293T cell lines (cat. no. RL-1658 and cat. no. CRL-3216, respectively) were purchased from ATCC (Manassas, VA, USA) and were cultured and maintained according to the manufacturer’s recommendations; the Med1-MB cells (19), a mouse medulloblastoma cell line of the SHH subgroup (SHH-MB) were generated in the Laboratory of Dr Matthew Scott (Standford University, Standford, CA, USA) from patched PTCH+/−;LacZ mouse and were cultured and maintained as previously described (13,19,20). For Sag treatment, the NIH3T3 cells were incubated in 0.5% of fetal bovine serum, overnight, to allow a full HH response and were then exposed to 200 nM Sag for the indicated periods of time (24 h Fig. 3B, 36 h and 48 h Fig. 4B). For Nocodazole treatments, the cells were incubated with 1 µg/ml Nocodazole or the vehicle control (DMSO for the indicated periods of time (24 h Fig. 4A; 36 h and 48 h Fig. 4B, 48 h Fig. 9C).
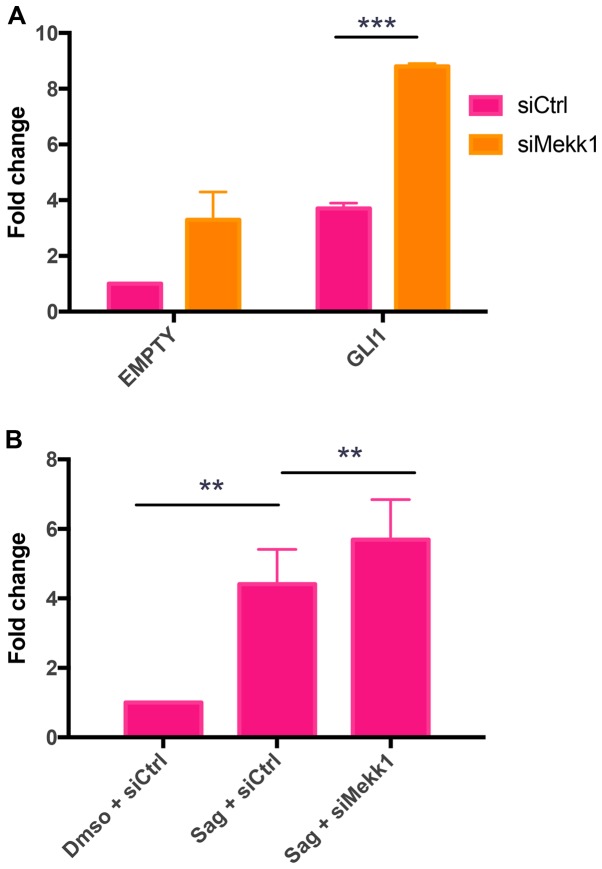
Figure 3.
MEKK1 ablation increases HH/GLI1 activity. (A) NIH3T3 cells were transiently transfected with control siRNA (siCtrl, 100 nM) or Mekk1 siRNA (siMekk1, 100 nM) and 12x-GLI and TK Renilla luciferase reporters. Cells were harvested and analyzed for luciferase activity. Data are expressed as the fold change of the ratio between luciferase to Renilla activity. (B) GLI1 mRNA expression levels in Sag-treated NIH3T3 cells expressing control siRNA (siCtrl, 100 nM) or Mekk1 siRNA (siMekk1, 100 nM) were evaluated by RT-qPCR. GLI1 mRNA levels were normalized to HPRT mRNA levels and expressed as fold change relative to control sample. Data are the means ± SD of at least 3 independent experiments, each performed in triplicate. **P<0.01 and ***P<0.001 (determined by ANOVA with Tukey’s post hoc test).
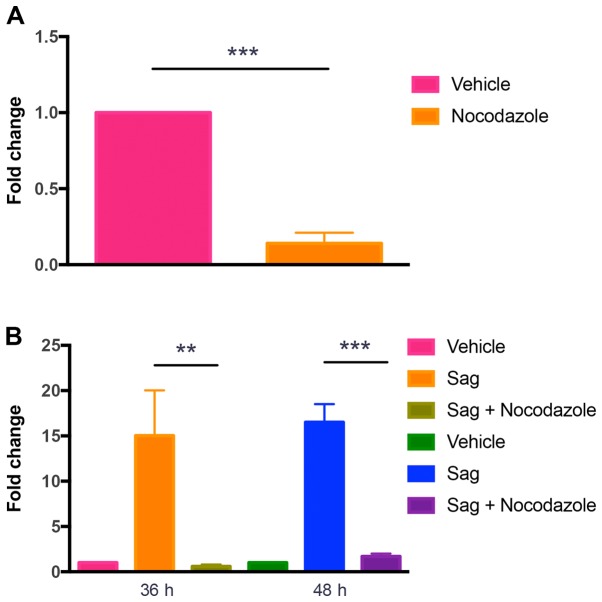
Figure 4.
Pharmacological MEKK1 activation inhibits GLI1 activity. (A) Luciferase reporter activity in 293T cells transiently transfected with 12x-GLI luciferase and TK Renilla reporters. Cells were treated with Nocodazole (1 µg/ml) for 24 h and analyzed for luciferase activity. Data are expressed as the fold change of the ratio between luciferase to Renilla activity. (B) GLI1 mRNA expression levels in Sag-treated NIH3T3 cells exposed to Nocodazole (0.1 µg/ml) for 36 and 48 h. GLI1 were analyzed by RT-qPCR and normalized to GAPDH mRNA levels. Results are expressed as the fold change relative to the control (vehicle) sample. Data are the means ± SD of at least 3 independent experiments, each performed in triplicate. **P<0.01 and ***P<0.001 [calculated using the Student’s t-test (A) or ANOVA with Tukey’s post hoc test (B)].
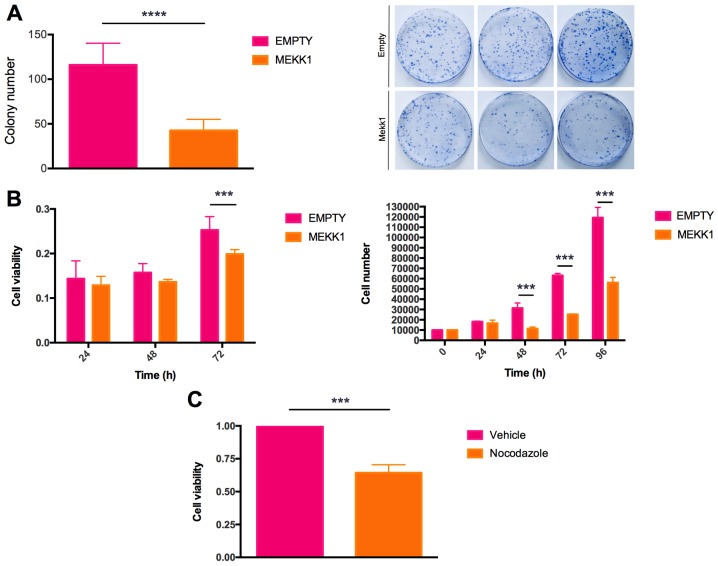
Figure 9.
MEKK1 counteracts in vitro medulloblastoma cells growth and viability. (A) Colony formation assay on Med1-MB cells stably transfected with expression plasmids encoding MEKK1 or empty vector. Left panel, colonies were quantified with ImageJ software (Version 1.50i), using 4 images per dish. The bar graph represents the average of three biological replicates. Right, representative colony formation assay. (B) Left panel, MTT assay measuring cell proliferation activity of Med1-MB cells expressing MEKK1 or control plasmids at 24 h, 48 h and 72 h in each group. Right panel, growth curve on Med1-MB cells expressing MEKK1 or empty vector. (C) MTT assay on Med1-MB cells treated with Nocodazole (0.1 µg/ml) for 48 h. Results are expressed as the means ± SD of 3 independent experiments, each performed in triplicate. ***P<0.001 and ****P<0.0001 [calculated by a Student’s t-test (A and C) or ANOVA with Tukey’s post hoc test (B)].
Luciferase/Renilla assays
The 293T or NIH3T3 cells were transfected with the plasmids indicated in the figures, using Lipofectamine 2000 reagent or Lipofectamine and Plus reagent (Invitrogen/Thermo Fisher Scientific, Waltham, MA, USA) respectively, according to the manufacturer’s recommendations. After 24 h (Figs. 1, 2B, 3A and 6A) or 48 h (Fig. 4A) from transfection Luciferase/Renilla assays were performed as previously described (9,21).
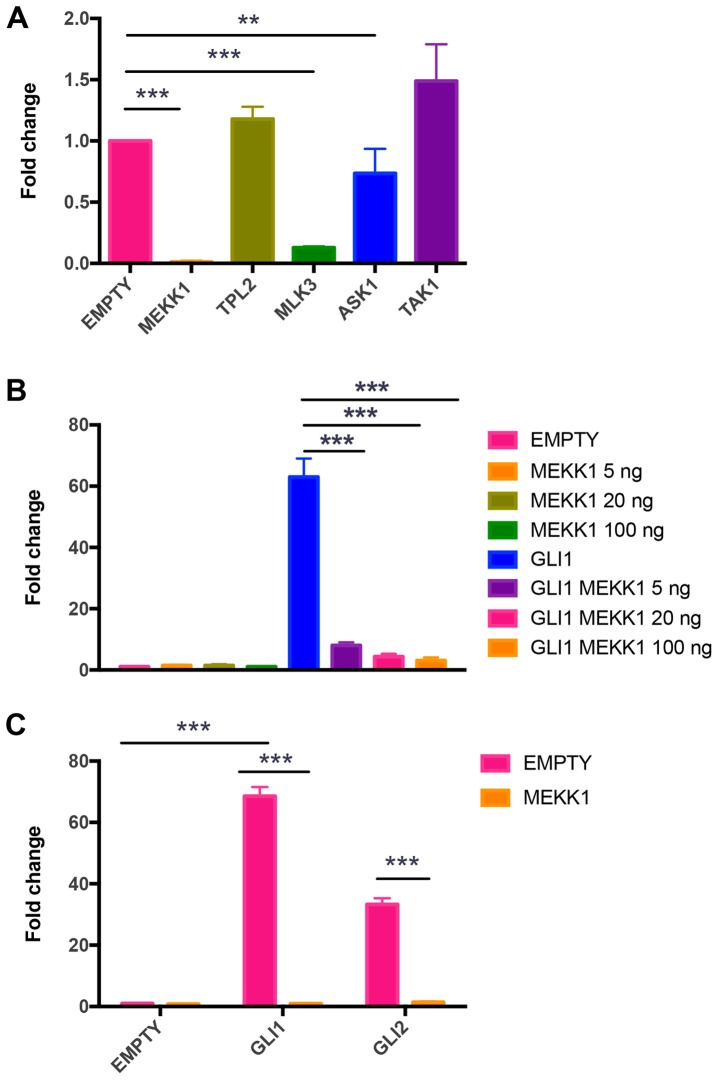
Figure 1.
Regulation of the GLI1 promoter by MEKK1. (A) 293T cells were co-transfected with the expression plasmid encoding Flag-GLI1 and expression vectors for MEKK1, TPL2, MLK3, ASK1, TAK1 or control vector (Flag-pcDNA3), and a 12x-GLI luciferase promoter reporter. Plasmid TK-Renilla was transfected to normalize the transfection efficiency. Data are expressed as the fold change of the ratio between luciferase to Renilla activity. (B) 293T cells were transfected with 8x-GLI luciferase promoter reporter and TK Renilla plasmids and with vectors expressing Flag-pcDNA3 or Flag-GLI1 and increasing amounts of MEKK1 plasmid (5, 20 and 100 ng), where indicated. Data are shown as the fold change of the ratio of luciferase reporter to Renilla activity. (C) 293T cells were co-transfected with 8x-GLI luciferase reporter and TK Renilla plasmids and Flag-GLI1 or Flag-GLI2 expression vectors or control vector (Flag-pcDNA3). Data are expressed as the fold change of the ratio between luciferase to Renilla activity. Results are the means ± SD of 3 independent experiments, each performed in triplicate. **P<0.01 and ***P<0.001 (determined by ANOVA with Tukey’s post hoc test).
Figure 2.
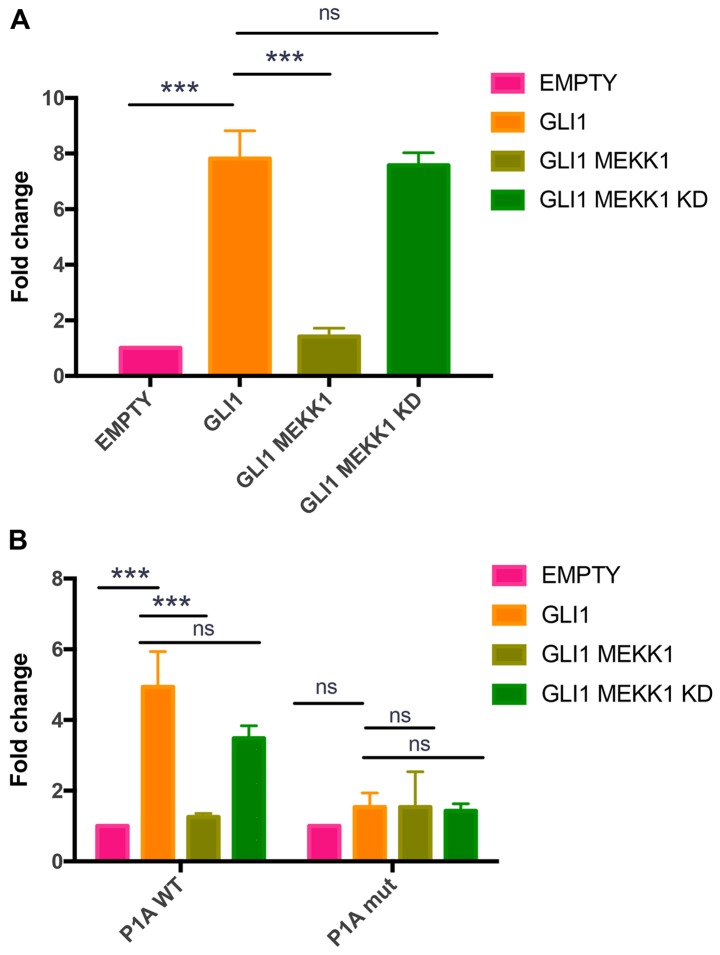
MEKK1 inhibits promoter-specific PTCH1 transcription. (A) NIH3T3 cells were transfected with Flag-GLI1 or control vector and MEKK1 expression plasmids. Relative expression of PTCH1 mRNA was evaluated by RT-qPCR. Data were normalized to HPRT mRNA levels and are expressed as the fold change relative to control sample. (B) 293T cells were transiently transfected with P1A WT and P1A mutant promoter luciferase constructs, and the TK Renilla encoding gene as reporters, and plasmids encoding GLI1, MEKK1 WT or KD or empty vector. Data are expressed as the fold change of the ratio between luciferase to Renilla activity. The results are the means ± SD of 3 independent experiments, each performed in triplicate. ***P<0.001; ns, not significant (calculated by ANOVA with Tukey’s post hoc test).
Figure 6.
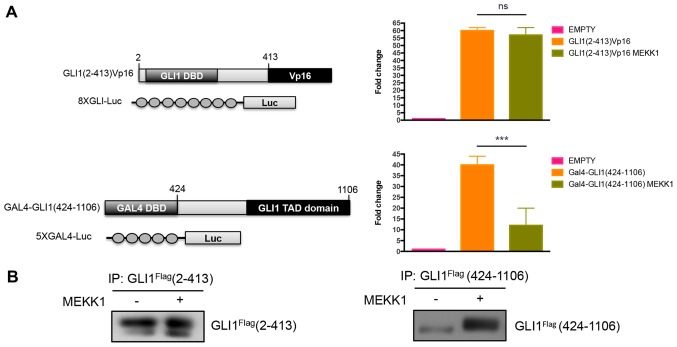
MEKK1 inhibits GLI1 transcriptional activity and phosphorylates the C-terminal region of GLI1. (A) Left panel, schematic representation of fusion vectors expressing GLI1(2-413)Vp16 and 8xGLI luciferase reporter or Gal4-GLI1(424-1106) and 5xGal4 luciferase reporter plasmids. Right panel, luciferase assay on 293T cells transfected with GLI1(2-413)Vp16 and 8xGli-Luc or Gal4-GLI1(424-1106) and 5xGal4-Luc vectors, with or without MEKK1 expression plasmid. Plasmid encoding TK Renilla was transfected to normalize transfection efficiency. Data are expressed as the fold change of the ratio between luciferase to Renilla activity. (B) Western blot analysis of immunoprecipitates from 293T cells transfected with expression vectors for Flag-GLI1(2-413) or Flag-GLI1(424-1106), with or without MEKK1. Flag-GLI1 was revealed with anti-Flag antibody. Results are expressed as the means ± SD of at least 3 independent experiments, each performed in triplicate. ***P<0.001; ns, not significant (calculated by ANOVA with Tukey’s post hoc test).
RNA analysis and reverse transcription-quantitative PCR (RT-qPCR)
The NIH3T3 or 293T cells were treated with Sag or transfected with pcDNA3, pcDNA3 Flag GLI1, pcDNA3 MEKK1, pcDNA3 MEKK1 KD, as indicated in the figures, and RNA was then extracted using TRIzol reagent. Reverse transcription was performed using the SensiFAST cDNA Syntesis kit (cat. no. BIO-65054) and qPCR was performed as previously described (9,22), using SYBR-Green reagent SensiFAST (cat. no. BIO-94020) (both from Bioline, Memphis, TN, USA). Each amplification reaction was performed in triplicate and the average of the three threshold cycles was used to calculate the amount of transcript in the sample (using ViiA™ 7 software; Life Technologies/Thermo Fisher Scientific). The results were expressed as the fold induction relative to the control samples using the ΔΔCt method (23) as previously described (6). HPRT or GAPDH were used where indicated as endogenous controls. The thermocycling conditions used for the PCR were as follows: 95°C, 2 min; (95°C, 5 sec; 60°C, 15 sec) 40 cycles SYBR-Green oligos used are listed below: hGLI1 forward, GGTGGTTCACATGCGCAG and reverse, GGTGCGTCTTCAGGTTTTGC; hPTCH forward, TAGGAGTGGAGTTC ACCGTT and reverse, ATCCAGGACGGGTGCAAACAT; hHPRT forward, GAAGAGCTATTGTAATGACCAGTC and reverse, CAAGCTTGCGACCTTGACCATC; mGli1 forward, AAGCCAACTTTATGTCAGGG and reverse, AGAGCCCGCTTCTTTCTTAA; mHprt forward, GCTTCCTCCTCAGACCGCTT and reverse, GGTCATAACCTGGTTCATCATC; and mGapdh forward, GACGGCCGCATCTTCTTGT and reverse, CCTGGTGACCAGGCGC.
Immunoprecipitation, western blot analysis and antibodies
The 293T cells were lysed with RIPA buffer (0.5% sodium-dehoxycolate, 50 mM Tris HCl pH 7.6, 1% NP-40, 0.1% SDS, 140 mM NaCl and 5 mM EDTA pH 8), supplemented with protease and phosphatase inhibitors (5 mM sodium pyro-phosphate, 1 mm b-glycero phosphate and 1 mM sodium orthovanadate). Immunoprecipitation was performed by incubation for 2 h in 1 mg of lysate with anti-Flag M2 Affinity Gel (cat. no. A2220, IP 30 µl; Sigma-Aldrich). Proteins were eluted and analyzed by SDS-PAGE (polyacrylamide percentages: 6% Fig. 5; 12% Fig. 6B; 10% Fig. 8B), blotted onto a nitrocellulose membrane (Perkin-Elmer, Waltham, MA, USA). The membranes were blocked in 5% milk in Tris-buffered saline with 0.1% Tween-20, and incubated overnight at 4°C with the primary antibodies. The following antibodies were used: anti-Flag M2 (1:1,000; cat. no. A8592; Sigma-Aldrich), anti-phosphoserine (1:500; cat. no. 16-455; Millipore, Billerica, MA, USA), anti-14-3-3ε (1:1,000; cat. no. sc-1020), anti-MEKK1 (1:1,000; cat. no. sc-449) (both from Santa Cruz Biotechnology, Inc., Santa Cruz, CA, USA), anti-GLI1 (1:1,000; cat. no. 2553S; Cell Signaling Technology, Danvers, MA, USA). Filters were incubated with the following secondary antibodies for 30′ at room temperature: Anti-mouse HRP-conjugated (1:10,000; cat. no. A-90-116P); anti-rabbit HRP-conjugated (1:10,000; cat. no. A120-108P) (both from Bethyl Laboratories, Inc., Montgomery, TX, USA). Signals were detected with Western Lightning Plus-ECL (Perkin-Elmer).
Figure 5.
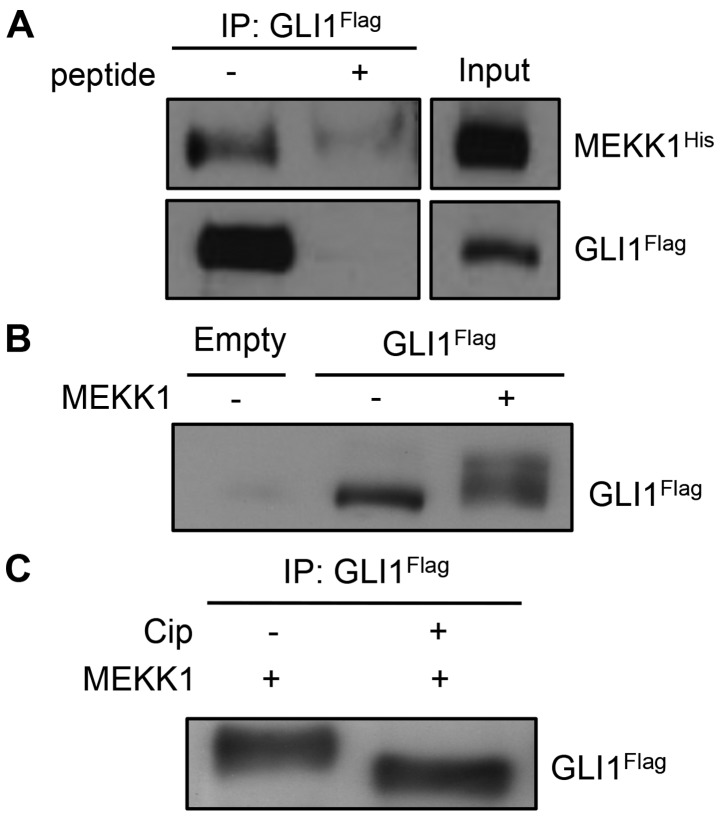
MEKK1 binds and phosphorylates GLI1. (A) 293T cells were trans-fected with constructs encoding Flag-GLI1 and His-MEKK1 and cell lysates were immunoprecipitated with anti-Flag antibody without or with 0.1 mg/ml blocking peptide. MEKK1 and GLI1 were revealed with anti MEKK1 and anti-Flag antibodies, respectively. Input: 5%. (B) Western blot analysis of cellular lysates from 293T cells expressing Flag-Gli1 alone or in combination with His-MEKK1. Flag-GLI1 was revealed with anti-Flag antibody. (C) 293T cells transfected with plasmids encoding Flag-GLI1 and His-MEKK1. Cell lysates were immunoprecipitated and immunocomplexes were incubated in the absence or presence of calf intestinal phosphatase (CIP).
Figure 8.
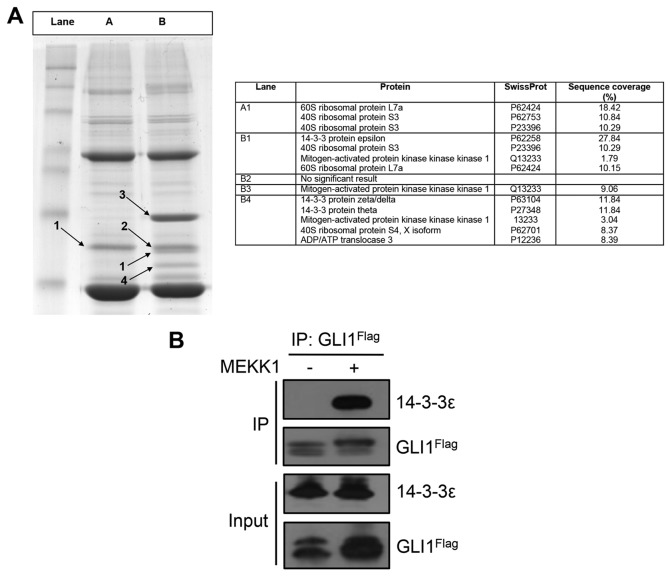
(A) Left panel, Coomassie-blue stained SDS-PAGE gel, showing proteins associated to Flag-GLI1(424-1106), in the absence or presence of MEKK1 in 293T cells. Lane A, proteins associated with Flag-GLI1(424-1106); lane B, proteins associated with Flag-GLI1(424-1106) + MEKK1. Numbered black arrows indicate bands cut out from the gel and processed. Right panel, mass spectrometry results for the selected gel bands. (B) Co-immunoprecipitation assay of Flag-GLI1 with endogenous 14-3-3ε proteins in 293T cells, with or without MEKK1. Lysates were immunoprecipitated with anti-Flag antibody and endogenous 14-3-3ε proteins binding is shown.
Mass spectrometry
Plasmids expressing Flag-GLI1 (424-1106), MEKK1 or empty vector were transfected in to the 293T cells using Lipofectamine 2000. After 24 h, the cells were washed with PBS and lysed in 1% NP-40, 50 mM HEPES pH 7.5, 150 mM NaCl, 1 mM EDTA, 10% glycerol, 10 mM NaF, 1 mM Na3VO4, 1 mM DTT and protease inhibitors. Lysates were centrifuged and the supernatants incubated with anti-Flag M2 agarose conjugated beads (A2220; Sigma-Aldrich) overnight at 4°C. At the end of incubation, the agarose beads were washed extensively with lysis buffer and then with PBS. The immunocomplexes were eluted with 0.1 mg/ml Flag peptide, precipitated with 5% TCA and the pellet washed twice with acetone and analyzed as previously described (9,24).
MTT assay
The Med1-MB cells were treated with Nocodazole (0.1 µg/ml) or transfected with MEKK1 or the empty vector, using Lipofectamine 2000. For the transfected cells, after 2 weeks of selection with G418 0.8 mg/ml, stable cell lines were used for MTT assay. For this purpose, the cells were seeded in triplicate in 96-well plates at a density of 2×10⁴ cells/ml. At the indicated time-points (24 or 48 or 72 h Fig. 9B; 48 h Fig. 9C), 10 µl of a 5 mg/ml MTT stock solution (purchased from Sigma-Aldrich; cat. no. M2128) was added to each well and the plates were incubated for 3 h at 37°C. Following incubation, 100 µl of DMSO were added to each well to solubilize the crystals. The plates were shaken for 15 min and the absorbance was read with a Wallac Victor 2 1420 Spectrophotometer (Perkin-Elmer) at 570 nm.
RNA interference
RNA knockdown was performed with pools of siRNA duplexes (50 to 100 nM) transfected into the NIH3T3 cells using Lipofectamine 2000. The following siRNA purchased from Dharmacon were used: siControl cat. no. D-001206-13-20; siMekk1 cat. no. L-040605-00-0020.
Colony formation assay
The Med1-MB cells were transfected using Lipofectamine 2000 as previously described (13) with a control vector or MEKK1. After 24 h, the cells were counted and equally diluted on new plates in presence of Neomycin (0.8 mg/ml). After 10 days, the foci were stained with Coomassie blue (cat. no. B0149; Sigma-Aldrich) for 10 min at room temperature rinsed with PBS, and counted using ImageJ Software 1.50i. The experiments were performed 3 times in triplicate.
Statistical analysis
Statistical significance was determined using a paired Student’s t-test or one-way ANOVA followed by Tukey’s post hoc test using GraphPad Prism 6.0 software. A value of P<0.05 was considered to indicate a statistically significant difference.
Results
The kinase MEKK1 inhibits HH-GLI1 activity
We examined the effect of 5 different MAP3K (MEKK1, TPL2, MLK3, ASK1 and TAK1) on the activity of ectopically expressed GLI1, using a luciferase reporter vector containing 12 repeats of a GLI-Bs, upstream of the TK promoter (12xGLI-Luc) (Dr R. Tofgard, Karolinska Institute). Among the kinases tested, ASK1, MLK3 and MEKK1 exerted a significant inhibitory effect, while the others did not markedly affect GLI1 activity (Fig. 1A). Since the most potent effect was achieved by MEKK1, we focused our study on this kinase. We confirmed the inhibition on a different GLI-Luc reporter, containing 8 repeats of the GLI binding site (8xGLI-Luc), indicating that the effect was specific for GLI-Bs (Fig. 1B). The inhibition was dose-dependent and was very robust at the doses of the transfected plasmids as low as 5 ng (Fig. 1B). We then examined the effect of the ectopic expression of MEKK1 on the activity of GLI2, the early effector of HH signaling. As shown in Fig. 1C, this transcription factor was also potently inhibited by the kinase, suggesting the involvement of a conserved region of the two proteins.
To determine whether MEKK1 also has an effect on a native HH responsive promoter, we examined the transcriptional response of the PTCH1 gene, which is induced by HH signaling through a conserved GLI binding site in its promoter region (9). The overexpression of GLI1 in mouse NIH3T3 cells caused an increase in the endogenous PTCH1 mRNA levels, as measured by RT-qPCR (Fig. 2A). Consistently, the ectopic expression of GLI1 led to an increase in PTCH-Luc reporter (P1A) activity. In both cases, the induction achieved with the overexpression of GLI1 was prevented by the co-expression of WT MEKK1, but not of a kinase death (KD) mutant (Fig. 2), indicating that MEKK1 inhibition requires the catalytic activity of the protein. GLI1 and MEKK1 failed to exert any significant effect on a PTCH-Luc vector mutated on the GLI binding site (P1Amut) (Fig. 2B), demonstrating that the inhibition is specific for GLI target genes and cannot be attributed to effects on other promoter regions. To confirm the effects of endogenous MEKK1 on HH signaling, we performed siRNA-mediated knockdown. The ablation of the kinase resulted in increased basal and GLI1-induced activity of a GLI-Luc reporter and of basal and Sag-induced levels of GLI1 mRNA (Fig. 3), indicating that endogenous MEKK1 exerts an inhibitory effect on GLI1 activity. To further support this observation, we examined the effect of Nocodazole, a MEKK1 activator (25), on HH-GLI signaling. The exposure of the cells to Nocodazole caused a robust decrease in GLI1-induced luciferase activity of a GLI-Luc reporter (Fig. 4A) and of the Sag-induced expression of GLI1 mRNA (Fig. 4B), further demonstrating the ability of endogenous MEKK1 to modulate the HH signaling.
MEKK1 binds and pxhosphorylates GLI1
Having observed that MEKK1 inhibits GLI1 activity, we first wished to determine whether this effect was related to the ability of the kinase to associate with this transcription factor. Immunoprecipitation of Flag-GLI1 revealed an association of the transcription factor with ectopically expressed His-MEKK1. This binding was readily competed by the addition of the Flag peptide (Fig. 5A) in molar excess, demonstrating the specificity of the interaction.
We then examined whether MEKK1 phosphorylates GLI1, by co-transfecting Flag tagged GLI1 together with MEKK1 or its empty vector into 293T cells. As shown in Fig. 5B, following Flag immunoprecipitation, the band corresponding to GLI1 exhibited a retarded migration in the presence of MEKK1 compared to the control. To prove that this retarded band was due to GLI1 phosphorylation, we incubated the immunocomplex from Flag immunoprecipitation with calf intestinal phosphatase (CIP) and observed that the GLI1 band was no longer retarded by the kinase (Fig. 5C), leading us to conclude that MEKK1 phosphorylates GLI1.
To elucidate which region of GLI1 is regulated by MEKK1, we then performed biochemical and functional analyses of the N-terminal (2-413) and C-terminal (424-1106) fragments of GLI1. Since the N-terminal region contains the GLI DNA binding domain, but not a transactivation domain, we used a chimeric construct consisting of this region fused to the VP16 transactivation domain (TAD) co-transfected with an 8xGLI-Luc reporter. Conversely, since the C-terminal region contains the TAD domain of GLI1, but not the DNA binding domain (DBD), we used a vector containing the C-terminus fused to a Gal4 DBD together with a 5x Gal4-Luc reporter (Fig. 6A) (9). The ectopic expression of MEKK1 inhibited Gal4-GLI1(424-1106), but not GLI1(2-413)-Vp16 activity (Fig. 6A), indicating that the MEKK1 regulation occurs in the C-terminal portion. Consistently, we observed that MEKK1 caused a retardation of the electrophoretic migration of the C-Terminal GLI1 fragment, but did not affect the mobility of the N-Terminal region (Fig. 6B). Thus, MEKK1 binds and phosphorylates GLI1 at its C-terminal region.
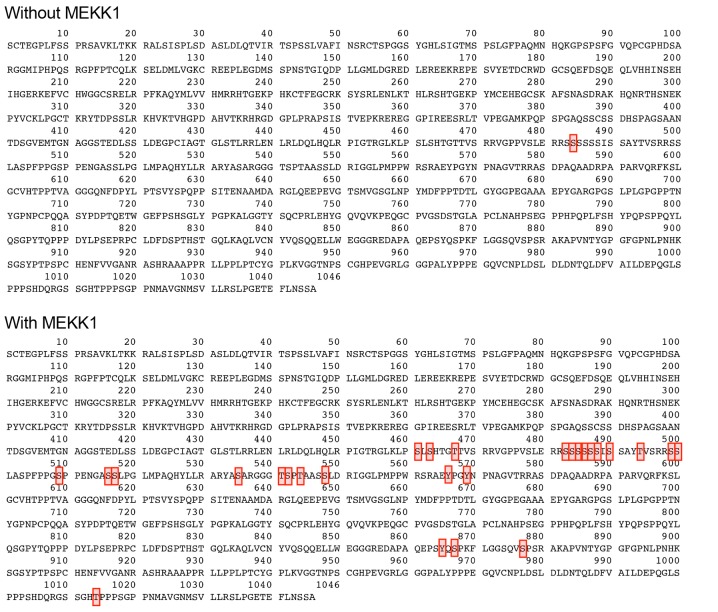
To identify the modified residue/s of GLI1 and understand the molecular consequences of the phosphorylation, we performed mass spectrometric analysis on immunoprecipitated Flag-GLI1 C-Term in 293T cells. We observed that GLI1 was phosphorylated in 27 residues in the presence of MEKK1, whereas only one residue was found phosphorylated in the absence of the kinase (Fig. 7). We also found that a few proteins co-purified with immunoprecipitated GLI1 + MEKK1, but not with GLI1 alone. Mass spectrometric analysis of these bands revealed that 14-3-3 ε,ζ/δ, τ were specifically detected in the GLI1 + MEKK1 lane (Fig. 8A, lane B). These data were further validated by a co-immunoprecipitation experiment that revealed the association between Flag-GLI1 and endogenous 14-3-3ε (Fig. 8B). Furthermore, we found that MEKK1 also co-purified with immunoprecipitated GLI1 (Fig. 8A, lane B), confirming the previously described binding assay (Fig. 5A).
Figure 7.
Phosphorylation status of GLI1 in absence or presence of MEKK1. Aminoacidic sequence of GLI1 showing phosphorylated residues (highlighted in red). Mass spectrometric analysis was performed on 293T cells transfected with plasmid encoding Flag-GLI1 C-terminal region (AA 424-1106), with or without MEKK1. Cell lysates were immunoprecipitated with anti-Flag antibody and analyzed.
MEKK1 exerts an inhibitory effect on cultured medulloblastoma cells
To determine the effects of the MEKK1/GLI1 regulation on tumor growth and viability, we performed colony formation and MTT assays. We utilized the Med1-MB cells, a SHH medulloblastoma cell line derived from a tumor originated in a PTCH1+/− mouse. The mutation of the PTCH1 gene in these cells causes an upregulation of the signaling pathway and hence high levels of GLI1, but not of the other GLIs. Thus, selective GLI1 inhibitors prevent the growth of these cells (19,20).
We stably transfected the Med1-MB cells with MEKK1 or control vectors and analyzed cell proliferation and viability. As shown in Fig. 9A and B, the Med1-MB cells expressing MEKK1 exhibited a number of colonies and a percentage of viable cells which were significantly lower than those of the cells transfected with the control vector, indicating that this kinase efficiently counteracted the growth and viability of HH-dependent tumor cells.
We also examined the effect of the MEKK1 agonist, Nocodazole, on medulloblastoma cells and found that this drug significantly decreased the number of viable cells compared to the control (Fig. 9C). Collectively, these data indicate that the activation of MEKK1 exerts significant anticancer effects by inhibiting GLI1 function.
Discussion
HH signaling is found aberrantly activated in a number of tumors and is considered an attractive target for cancer therapy (26). The limited efficacy of the SMO inhibitor, Vismodegib, has prompted efforts to identify novel drugs with the ability to directly target the GLI transcription factors or GLI-regulated pathways.
In this study, we provide evidence that the kinase MEKK1 has the ability to bind and promote GLI1 phosphorylation, resulting in inhibition of its activity. MEKK1 is a member of the MAP3K family, the most upstream components of the mitogen-activated protein kinase (MAPK) phosphorylated modules, consisting of MAPK, MAPK kinase (MKK) and MAPK kinase kinase (MKKK) (27). MKKKs phosphorylate and activate MKKs, which in turn phosphorylate and activate MAPKs. Twenty different MAP3Ks have been characterized and each of these is regulated by various cues, such as growth factors, cytokines, antigens, stress insults, changes in extracellular matrix and cell-cell contacts.
MEKK1 is a 196 kDa protein that activates both the JNK and ERK pathways, although JNK appears to be preferentially regulated. MEKK1 is activated by a variety of stimuli, including growth factors, microtubule disruption, heat shock, hypermolarity and UV irradiation (28). Previous studies have documented a crosstalk between the HH and MAPK cascades (29) and its role in various tumors, including cancers of the skin, gastrointestinal, pancreas, liver, breast and brain (30).
It has been demonstrated that a positive synergy exists between the two signaling pathways, mainly mediated by ERK1/2 kinases, which have been shown to induce GLI1 phosphorylation and activation, thus implying that a proper combination of specific pathway inhibitors could be a possible therapeutic options for these type of tumors (28). In contrast to these observations, in this study, we provide evidence that MEKK1, which has the ability to activate both ERK and JNK, inhibits GLI1 function through multiple phosphorylation events, occurring at the C-terminal domain of the transcription factor. Mass spectrometric analysis revealed almost 30 sites in the C-term of GLI1 were phosphorylated in cells expressing MEKK1. Unfortunately, our attempts to identify a phosphorylation-defective mutant failed and we could not mutagenize all the modified residues, due to stability issues and generation of unreliable data. However, we observed that upon MEKK1 phosphorylation, GLI1 associated with 14-3-3 proteins, suggesting that this binding may be responsible, at least in part, for the observed inhibitory effect. In support of this hypothesis, a previous study described an association between GLI and 14-3-3 upon PKA phosphorylation that was associated by transcriptional inhibition (31), although the underlying mechanism was not fully elucidated.
In addition to its kinase activity, it has been observed that MEKK1 may also ubiquitylate some substrates such as c-JUN and promote their degradation (32), suggesting that a proteolytic-mediated effect could also account for the observed GLI1 inhibition. However, the steady state levels of GLI1 do not appear reduced in the presence of this kinase, thus ruling out degradation-dependent mechanisms. Recently it has been described that two other mitogen-activated protein kinase kinase kinase (MAP3Ks), MEKK2 and MEKK3, play a critical role in regulating HH signaling. MEKK2/MEKK3 are conserved for the 55% in the amino-acid sequence and 95% in the kinase domain, both are co-expressed in many cell type and they share substrate specificity (16). MEKK2/3 are activated in response to the FGF signaling and directly phosphorylates GLI1 resulting in the suppression of GLI1 transcriptional activity and the suppression of HH-dependent medulloblastoma tumor cell growth (16). In contrast to these findings, we did not observe an involvement of MEKK1 in the response to FGF stimulation (data not shown), indicating the differential recruitment of these MAP3Ks in response to various cues.
Finally, a relevant finding of this study was the significant antitumor effect of ectopically expressed MEKK1 observed in medulloblastoma cells. This evidence suggests that MEKK1 can be now included among the druggable targets with the ability to turn off HH signaling at a post-receptor level in tumors. The ability of Nocodazole to inhibit HH signaling and to counteract SHH-MB growth supports this hypothesis and opens the door to future studies aimed at analyzing the potential of Nocodazole and other MEKK1 agonists as novel therapeutic options for this type of malignancies.
Acknowledgments
The authors would like to thank Dr Matthew Scott and Dr Yoon-Jae Cho for the Med1-MB cells and Dr U Jhala for the MAP3Ks plasmid. EA would like to thank the Fondazione ‘Enrico ed Enrica Sovena’ for the scholarship given to ZNY for supporting her PhD research work.
Funding
This study was funded by the generous support of AIRC IG 17575, IG 20801; Istituto Pasteur - Fondazione Cenci-Bolognetti, Sapienza University of Rome and Italian MIUR (Ministero dell’Istruzione, dell’Università e della Ricerca), AFM-Telethon grant #21025. SMS was supported by the PhD Degree Program in Biotechnology in clinical medicine, University of Rome La Sapienza.
Availability of data and materials
All data generated or analyzed during this study are included within the manuscript or are available from the corresponding author on reasonable request.
Authors’ contributions
LA and LaDM designed and performed experiments, analyzed the data and edited the manuscript. DD, SM, SMS, FDP, RB, ZNY, MC and MP performed the experiments. AG, MES and JRYIII performed the mass spectrometry experiments and analyzed the data. LuDM, EDS, SCh, CC, EA and MM analyzed the data and edited the manuscript. SCo and GC designed the experiments, analyzed the data and wrote the manuscript. All authors have read and approved the final manuscript.
Ethics approval and consent to participate
Not applicable.
Patient consent for publication
Not applicable.
Competing interests
The authors declare that they have no competing interests.
References
- 1.Dellovade T, Romer JT, Curran T, Rubin LL. The hedgehog pathway and neurological disorders. Annu Rev Neurosci. 2006;29:539–563. doi: 10.1146/annurev.neuro.29.051605.112858. [DOI] [PubMed] [Google Scholar]
- 2.Ryan KE, Chiang C. Hedgehog secretion and signal transduction in vertebrates. J Biol Chem. 2012;287:17905–17913. doi: 10.1074/jbc.R112.356006. [DOI] [PMC free article] [PubMed] [Google Scholar]
- 3.Hui CC, Angers S. Gli proteins in development and disease. Annu Rev Cell Dev Biol. 2011;27:513–537. doi: 10.1146/annurev-cellbio-092910-154048. [DOI] [PubMed] [Google Scholar]
- 4.Northcott PA, Jones DT, Kool M, Robinson GW, Gilbertson RJ, Cho YJ, Pomeroy SL, Korshunov A, Lichter P, Taylor MD, et al. Medulloblastomics: The end of the beginning. Nat Rev Cancer. 2012;12:818–834. doi: 10.1038/nrc3410. [DOI] [PMC free article] [PubMed] [Google Scholar]
- 5.Northcott PA, Korshunov A, Pfister SM, Taylor MD. The clinical implications of medulloblastoma subgroups. Nat Rev Neurol. 2012;8:340–351. doi: 10.1038/nrneurol.2012.78. [DOI] [PubMed] [Google Scholar]
- 6.Di Magno L, Manzi D, D’Amico D, Coni S, Macone A, Infante P, Di Marcotullio L, De Smaele E, Ferretti E, Screpanti I, et al. Druggable glycolytic requirement for Hedgehog-dependent neuronal and medulloblastoma growth. Cell Cycle. 2014;13:3404–3413. doi: 10.4161/15384101.2014.952973. [DOI] [PMC free article] [PubMed] [Google Scholar]
- 7.Chen Y, Jiang J. Decoding the phosphorylation code in Hedgehog signal transduction. Cell Res. 2013;23:186–200. doi: 10.1038/cr.2013.10. [DOI] [PMC free article] [PubMed] [Google Scholar]
- 8.Gulino A, Di Marcotullio L, Canettieri G, De Smaele E, Screpanti I. Hedgehog/Gli control by ubiquitination/acetylation interplay. Vitam Horm. 2012;88:211–227. doi: 10.1016/B978-0-12-394622-5.00009-2. [DOI] [PubMed] [Google Scholar]
- 9.Canettieri G, Di Marcotullio L, Greco A, Coni S, Antonucci L, Infante P, Pietrosanti L, De Smaele E, Ferretti E, Miele E, et al. Histone deacetylase and Cullin3-REN(KCTD11) ubiquitin ligase interplay regulates Hedgehog signalling through Gli acetylation. Nat Cell Biol. 2010;12:132–142. doi: 10.1038/ncb2013. [DOI] [PubMed] [Google Scholar]
- 10.Coni S, Antonucci L, D’Amico D, Di Magno L, Infante P, De Smaele E, Giannini G, Di Marcotullio L, Screpanti I, Gulino A, et al. Gli2 acetylation at lysine 757 regulates hedgehog-dependent transcriptional output by preventing its promoter occupancy. PLoS One. 2013;8:e65718. doi: 10.1371/journal.pone.0065718. [DOI] [PMC free article] [PubMed] [Google Scholar]
- 11.Liu H, Yan S, Ding J, Yu TT, Cheng SY. DeSUMOylation of Gli1 by SENP1 attenuates sonic Hedgehog signaling. Mol Cell Biol. 2017;37:37. doi: 10.1128/MCB.00579-16. [DOI] [PMC free article] [PubMed] [Google Scholar]
- 12.Di Magno L, Coni S, Di Marcotullio L, Canettieri G. Digging a hole under Hedgehog: Downstream inhibition as an emerging anticancer strategy. Biochim Biophys Acta. 18562015:62–72. doi: 10.1016/j.bbcan.2015.06.003. [DOI] [PubMed] [Google Scholar]
- 13.Coni S, Mancuso AB, Di Magno L, Sdruscia G, Manni S, Serrao SM, Rotili D, Spiombi E, Bufalieri F, Petroni M, et al. Selective targeting of HDAC1/2 elicits anticancer effects through Gli1 acetylation in preclinical models of SHH Medulloblastoma. Sci Rep. 2017;7:44079. doi: 10.1038/srep44079. [DOI] [PMC free article] [PubMed] [Google Scholar]
- 14.Di Magno L, Basile A, Coni S, Manni S, Sdruscia G, D’Amico D, Antonucci L, Infante P, De Smaele E, Cucchi D, et al. The energy sensor AMPK regulates Hedgehog signaling in human cells through a unique Gli1 metabolic checkpoint. Oncotarget. 2016;7:9538–9549. doi: 10.18632/oncotarget.7070. [DOI] [PMC free article] [PubMed] [Google Scholar]
- 15.Xu Q, Liu X, Zheng X, Yao Y, Wang M, Liu Q. The transcriptional activity of Gli1 is negatively regulated by AMPK through Hedgehog partial agonism in hepatocellular carcinoma. Int J Mol Med. 2014;34:733–741. doi: 10.3892/ijmm.2014.1847. [DOI] [PMC free article] [PubMed] [Google Scholar]
- 16.Lu J, Liu L, Zheng M, Li X, Wu A, Wu Q, Liao C, Zou J, Song H. MEKK2 and MEKK3 suppress Hedgehog pathway-dependent medulloblastoma by inhibiting GLI1 function. Oncogene. 2018;37:3864–3878. doi: 10.1038/s41388-018-0249-5. [DOI] [PMC free article] [PubMed] [Google Scholar]
- 17.Uhlik MT, Abell AN, Cuevas BD, Nakamura K, Johnson GL. Wiring diagrams of MAPK regulation by MEKK1, 2, and 3. Biochem Cell Biol. 2004;82:658–663. doi: 10.1139/o04-114. [DOI] [PubMed] [Google Scholar]
- 18.Hutchin ME, Kariapper MS, Grachtchouk M, Wang A, Wei L, Cummings D, Liu J, Michael LE, Glick A, Dlugosz AA. Sustained Hedgehog signaling is required for basal cell carcinoma proliferation and survival: Conditional skin tumorigenesis recapitulates the hair growth cycle. Genes Dev. 2005;19:214–223. doi: 10.1101/gad.1258705. [DOI] [PMC free article] [PubMed] [Google Scholar]
- 19.Hayden Gephart MG, Su YS, Bandara S, Tsai FC, Hong J, Conley N, Rayburn H, Milenkovic L, Meyer T, Scott MP. Neuropilin-2 contributes to tumorigenicity in a mouse model of Hedgehog pathway medulloblastoma. J Neurooncol. 2013;115:161–168. doi: 10.1007/s11060-013-1216-1. [DOI] [PMC free article] [PubMed] [Google Scholar]
- 20.Tang Y, Gholamin S, Schubert S, Willardson MI, Lee A, Bandopadhayay P, Bergthold G, Masoud S, Nguyen B, Vue N, et al. Epigenetic targeting of Hedgehog pathway transcriptional output through BET bromodomain inhibition. Nat Med. 2014;20:732–740. doi: 10.1038/nm.3613. [DOI] [PMC free article] [PubMed] [Google Scholar]
- 21.D’Amico D, Antonucci L, Di Magno L, Coni S, Sdruscia G, Macone A, Miele E, Infante P, Di Marcotullio L, De Smaele E, et al. Non-canonical Hedgehog/AMPK-Mediated Control of Polyamine Metabolism Supports Neuronal and Medulloblastoma Cell Growth. Dev Cell. 2015;35:21–35. doi: 10.1016/j.devcel.2015.09.008. [DOI] [PMC free article] [PubMed] [Google Scholar]
- 22.Vargas Romero P, Cialfi S, Palermo R, De Blasio C, Checquolo S, Bellavia D, Chiaretti S, Foà R, Amadori A, Gulino A, et al. The deregulated expression of miR-125b in acute myeloid leukemia is dependent on the transcription factor C/EBPα. Leukemia. 2015;29:2442–2445. doi: 10.1038/leu.2015.117. [DOI] [PMC free article] [PubMed] [Google Scholar]
- 23.Livak KJ, Schmittgen TD. Analysis of relative gene expression data using real-time quantitative PCR and the 2(−Delta Delta C(T)) method. Methods. 2001;25:402–408. doi: 10.1006/meth.2001.1262. [DOI] [PubMed] [Google Scholar]
- 24.Screaton RA, Conkright MD, Katoh Y, Best JL, Canettieri G, Jeffries S, Guzman E, Niessen S, Yates JR, III, Takemori H, et al. The CREB coactivator TORC2 functions as a calcium- and cAMP-sensitive coincidence detector. Cell. 2004;119:61–74. doi: 10.1016/j.cell.2004.09.015. [DOI] [PubMed] [Google Scholar]
- 25.Yujiri T, Fanger GR, Garrington TP, Schlesinger TK, Gibson S, Johnson GL. MEK kinase 1 (MEKK1) transduces c-Jun NH2-terminal kinase activation in response to changes in the microtubule cytoskeleton. J Biol Chem. 1999;274:12605–12610. doi: 10.1074/jbc.274.18.12605. [DOI] [PubMed] [Google Scholar]
- 26.Briscoe J, Thérond PP. The mechanisms of Hedgehog signalling and its roles in development and disease. Nat Rev Mol Cell Biol. 2013;14:416–429. doi: 10.1038/nrm3598. [DOI] [PubMed] [Google Scholar]
- 27.Garrington TP, Johnson GL. Organization and regulation of mitogen-activated protein kinase signaling pathways. Curr Opin Cell Biol. 1999;11:211–218. doi: 10.1016/S0955-0674(99)80028-3. [DOI] [PubMed] [Google Scholar]
- 28.Yujiri T, Sather S, Fanger GR, Johnson GL. Role of MEKK1 in cell survival and activation of JNK and ERK pathways defined by targeted gene disruption. Science. 1998;282:1911–1914. doi: 10.1126/science.282.5395.1911. [DOI] [PubMed] [Google Scholar]
- 29.Xue Z, Vis DJ, Bruna A, Sustic T, van Wageningen S, Batra AS, Rueda OM, Bosdriesz E, Caldas C, Wessels LFA, et al. MAP3K1 and MAP2K4 mutations are associated with sensitivity to MEK inhibitors in multiple cancer models. Cell Res. 2018;28:719–729. doi: 10.1038/s41422-018-0044-4. [DOI] [PMC free article] [PubMed] [Google Scholar]
- 30.Michaut M, Chin SF, Majewski I, Severson TM, Bismeijer T, de Koning L, Peeters JK, Schouten PC, Rueda OM, Bosma AJ, et al. Integration of genomic, transcriptomic and proteomic data identifies two biologically distinct subtypes of invasive lobular breast cancer. Sci Rep. 2016;6:18517. doi: 10.1038/srep18517. [DOI] [PMC free article] [PubMed] [Google Scholar]
- 31.Asaoka Y, Kanai F, Ichimura T, Tateishi K, Tanaka Y, Ohta M, Seto M, Tada M, Ijichi H, Ikenoue T, et al. Identification of a suppressive mechanism for Hedgehog signaling through a novel interaction of Gli with 14-3-3. J Biol Chem. 2010;285:4185–4194. doi: 10.1074/jbc.M109.038232. [DOI] [PMC free article] [PubMed] [Google Scholar]
- 32.Xia Y, Wang J, Xu S, Johnson GL, Hunter T, Lu Z. MEKK1 mediates the ubiquitination and degradation of c-Jun in response to osmotic stress. Mol Cell Biol. 2007;27:510–517. doi: 10.1128/MCB.01355-06. [DOI] [PMC free article] [PubMed] [Google Scholar]
Associated Data
This section collects any data citations, data availability statements, or supplementary materials included in this article.
Data Availability Statement
All data generated or analyzed during this study are included within the manuscript or are available from the corresponding author on reasonable request.


