

SUMMARY
The induction of limb repair in adult vertebrates is a pressing, unsolved problem. Here, we characterize the effects of an integrated device that delivers drugs to severed hindlimbs of adult Xenopus laevis, which normally regenerate cartilaginous spikes after amputation. A wearable bioreactor containing a silk protein-based hydrogel that delivered progesterone to the wound site immediately after hindlimb amputation for only 24 hr induced the regeneration of paddle-like structures in adult frogs. Molecular markers, morphometric analysis, X-ray imaging, immunofluorescence, and behavioral assays were used to characterize the differences between the paddle-like structures of successful regenerates and hypomorphic spikes that grew in untreated animals. Our experiments establish a model for testing therapeutic cocktails in vertebrate hindlimb regeneration, identify pro-regenerative activities of progesterone-containing bioreactors, and provide proof of principle of brief use of integrated device-based delivery of small-molecule drugs as a viable strategy to induce and maintain a long-term regenerative response.
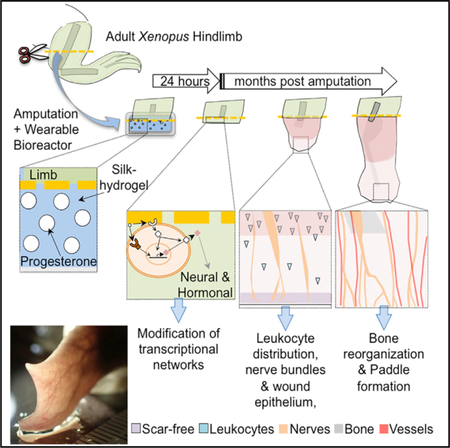
Graphical Abstract
In Brief
The complexity of vertebrate limbs drives the search for regenerative treatments that trigger endogenous processes of repair. Herrera-Rincon et al. show that a wearable bioreactor containing progesterone, applied for only 24 hr, induces months of regenerative growth and patterning of amputated hindlimbs in the frog Xenopus laevis.
INTRODUCTION
The repair of damaged limbs and organs in humans is of paramount importance, as 2 million Americans are living with limb amputations (Ziegler-Graham et al., 2008). An ideal solution would trigger the native limb-building pathways in vivo, to restore a functional limb from the patient’s own cells. Despite concerted efforts on the mechanisms of regeneration (Kawakami et al., 2006; Leppik et al., 2015), there are few reports of rebuilding and/or repairing damaged or lost limbs in non-regenerative animals, and there is a pressing need for a tractable vertebrate model in which to test potential interventions.
Many animals possess a remarkable capacity for appendage regeneration, which is not found in humans despite a high degree of gene homology (Brockes and Kumar, 2008). Xenopus laevis exhibits a regeneration response similar to that of urodele axolotls, which can reform a functional limb after amputation. However, this capability declines markedly throughout development, and in later tadpole and post-metamorphic animals, the resultant regenerate is a hypomorphic cartilage ‘‘spike’’ (Dent, 1962). We have previously shown the induction of tail regeneration in non-regenerative Xenopus stages by targeting the bioelectric state with small-molecule drugs (Adams et al., 2007, 2013; Tseng et al., 2010); however, those studies involved juvenile frogs and used whole-animal exposure to inductive cocktails, a strategy that is limiting because of the extensive use of bioelectric signaling throughout the body. We thus sought to develop a methodology to test targeted delivery of small-molecule electroceuticals in adult animals to overcome their lack of regenerative response with an early, local, and brief intervention.
We recently showed that a wearable bioreactor (Hechavarria et al., 2010) positively affects regenerative capabilities (Golding et al., 2016). Progesterone (Prog) is a potent neurosteroid that showed promise for peripheral nerve regeneration (promoting nerve repair) (Koenig et al., 2000) and bridging in severed rabbit facial nerves (Chávez-Delgado et al., 2003), canine sciatic nerves (Rosales-Cortes et al., 2003), and non-neural tissue remodeling by modulating the inflammatory response to drive wound healing, angiogenesis (McEwen, 1991; Routley and Ashcroft, 2009), and bone remodeling (Hennighausen and Robinson, 2001). In addition, Prog can regulate bioelectric cell state via changes in ion flux (Luoma et al., 2012; Patrat et al., 2002), and bioelectric signaling has been proved to drive regeneration and patterning in multiple assays in Xenopus and other model systems (Herrera-Rincon and Levin, 2016; Levin, 2011, 2014; Lobikin et al., 2015; McLaughlin and Levin, 2018; Tseng and Levin, 2013; Tseng et al., 2007, 2010). Due to its potent and broad actions on neural and non-neural tissue remodeling, as well as its ability to influence bioelectric signaling, we asked whether treatment with a Prog-containing silk device immediately after amputation would improve cellular dynamics and regenerative potential after hindlimb amputation in adult Xenopus.
We report a comprehensive multifactor analysis of the regenerative effects of a compound treatment: cocktail + delivery methodology on adult hindlimb regeneration in Xenopus. We show that a brief exposure—only 24 hr—to this intervention modifies transcriptional networks within the blastema and induces sustained changes in the regenerative capacity over time. Our data establish a platform to test ‘‘master regulator’’ therapeutics, in which a very brief treatment ‘‘kick-starts’’ a long program of growth and remodeling. These findings reveal that the adult Xenopus limb is capable of considerable growth and morphogenesis and illustrates a road map for interventions that can be used to probe and improve the mechanisms of complex appendage regeneration in vertebrate models.
RESULTS
Prog Receptor Is Present in Xenopus Adult Limbs, and Prog Levels at the Amputation Site Are Significantly Increased after 24 hr of Prog-Containing Bioreactor Treatment
Hindlimb-amputated animals were either treated with silk-hydrogel devices loaded with Prog (Prog-device group) or an untreated control group (control or Ctrl; Figure 1A). Additional amputated animals treated with a silk-hydrogel device but no drug (Sham group) were also evaluated 24 hr after device attachment. We first sought to confirm that the receptor was present in adult Xenopus limb tissue. The X. laevis classical Prog receptor (xPR-1) participates in the rapid events that mediate oocyte maturation (Bayaa et al., 2000; Martinez et al., 2006; Tian et al., 2000). A fluorescent ligand for PR (Prog 3-[O-carboxymethyl]oxime:BSA-fluorescein isothiocyanate conjugate [PFITC]) and hormone displacement assays revealed PR expression in intact limbs of adult Xenopus. On cross-sections, we detected a high density of labeled cells on the lamellar bone of the limb, especially in the bone marrow (Figure 1B). Other low-positive areas for PR included parts of the epithelial tissue, the connective tissue under the epithelium, and a reduced number of muscle cells. Co-staining with DAPI showed that most of the binding sites were in the nuclei of the bone marrow mesenchymal cells (Figure 1C). Co-incubation with a saturating concentration of Prog (Figure 1D) demonstrated that the hormone displaced the fluorescent ligand from binding to the PR; no labeled cells were detected on parallel sections. Conversely, co-incubation with PFITC in the presence of the non-specific hormone hydrocortisone (physiological ligand of glucocorticoid receptor; Figure 1E) led to a pattern of positive cells that was similar to what was observed after incubation with PFITC in the absence of hydro-cortisone. We conclude that the Prog receptor is present in the limbs of adult frogs.
Figure 1. 24-Hr Combined Progesterone-Device Treatment Changes Early Cellular Response, Decreasing the Early Leukocyte Invasion and Leading to a Scar-free Wound Healing with Higher Nerve Supply at Later Stages.

(A) Schematic showing the experimental design and integrative methodology for assessment of the regenerative potential. The orange dashed line indicates amputation plane. The black dashed lines delineate gross morphological outcomes for the two experimental groups.
(B–E) Expression of progesterone receptor (PR) on frog limbs revealed by fluorescent ligand binding assays and hormone displacement studies.
(B) Low-magnification image of a cross-section of intact frog hindlimb after incubation with the fluorescent ligand for PR (progesterone 3-(O-carboxymethyl) oxime:BSA-fluorescein isothiocyanate conjugate [PFITC]) and counterstained with DAPI. In the center of the bone is the marrow containing PR+ mesenchymal cells (white arrowheads).
(C) High-magnification image through the bone marrow of an intact frog hindlimb showing nuclear colocation for PFITC and DAPI labeling (white arrowheads).
(D) Parallel section to (B) after PFITC co-incubation with a saturating concentration of the physiological agonist progesterone. No positive cells were detected.
(E) Cross-section of frog hindlimb after PFITC co-incubation with an unspecific hormone, hydrocortisone. Since no competitive binding occurs, the fluorescent ligand reaction showed a similar positive pattern to the single PFITC incubation, as detected when compared to (B). Scale bar, 100 μm.
(F–H) H&E staining at 0.5 months post-amputation (mpa), showing the overall organization of the soft tissue after no subsequent treatment (Ctrl group, F) and after treatment with the silk-hydrogel device loaded with progesterone (Prog-device group, G). Two weeks after amputation, differences in the fibroblastema region (asterisk) were present between the two groups—mostly collagen accumulation in untreated animals‒and frequent areas of irregular cells (asterisk) in Prog-device treated animals. In (H), a scheme with the main histological elements, as seen on sections along the longitudinal axis, is presented.
(I–K) Immune infiltration (after XL2 immunofluorescence) in the early fibroblastema of Ctrl (I) and Prog-device (J) animals. The number of leukocytes was significantly lower (K) in the apical region (or distal from the amputation plane, blue dashed line) of the blastema in the treated animals.
(L–N) The number of H3P-expressing proliferative cells (white arrows) normalized to the total number of cells (DAPI labeled, blue) between Ctrl (L) and Prog-device (M) animals at late-blastema stage (3 mpa) showed no significant differences (N).
(O–Q) The nerve patterning, as detected after tubulin (Tub) immunofluorescence on longitudinal sections, was less organized in Ctrl (O) group than after Prog-device treatment (P). The former was characterized by the presence of specialized groups or bundles of nerve fibers, with higher area per positive unit (Q).
(I, J, L, M, O, and P) Scale bars, 100 μm. (I and J) Amputation plane is right, medial is up. (L and M) Amputation plane is up, medial is left. (O and P) Amputation plane is left, lateral is up. (F–Q) Micrographs show longitudinal sections (see Figure S5A for scheme). (K, N, and Q) Values are represented with scatterplots, in which each dot represents one histological section and each dot style represents one animal (with at least three histological sections). Statistical analysis was performed on the pooled individual sections. Horizontal line indicates mean. p values after t test (equal variances; N) or Mann-Whitney test (unequal variances; K and Q) are indicated as *p < 0.05, **p < 0.01, ns, p > 0.05.
See also Figure S1.
Next, we evaluated the local release (versus a systemic wider effect) of the drug contained in the bioreactor. We used ELISA for Prog quantification on two remote tissues (brain and blood) and on the amputation site (proximal blastema) after 24 hr of device exposure, in animals belonging to the Ctrl, Sham, and Prog-device groups. The analysis of blood and brain showed no significant differences in Prog levels among Ctrl, Sham, and Prog-device treated amputated animals (one-way ANOVA for blood: F = 2.52, p = 0.16; for brain: F = 0.89, p = 0.46; Figures S1A and S1B). Conversely, levels of Prog at the blastema were significantly different among three experimental groups 24 hr after device exposure (one-way ANOVA, F = 182.9, p < 0.01; Figure S1C). While Ctrl and Sham expressed similar Prog levels in the blastema, without significant differences, the hormone levels were clearly higher for Prog-device animals, resulting in significant differences with respect to both Ctrl (p < 0.01 after Bonferroni’s post hoc test) and Sham (p < 0.01 after Bonferroni’s post hoc test) groups. These results demonstrate that the levels of Prog are significantly increased at the injury site (where the composite bioreactor is applied) only for the animals treated with 24 hr of composite drug device. We conclude that the increased presence of Prog is not itself an outcome of injury and that our device delivers Prog effectively to the local area, but does not disperse it widely throughout the animal.
Prog-Containing Bioreactor Modifies Cell Response and Tissue Remodeling during Early Phases of Regeneration
To characterize the effects of Prog-loaded bioreactor on early stages of regeneration, we surveyed the growing fibroblastema region above the amputation plane with a panel of cellular markers (Figures 1F–1Q and S1D–S1I). Early in the regenerative process, at 0.5 months post-amputation (mpa), coinciding with the wound epidermis and early blastema stage in the adult regenerative salamander (Young et al., 1985), hematoxylin and eosin (H&E) staining of untreated Ctrl animals revealed the early formation of a cartilage callus around the bone, covered by a thin wound epithelium. Conversely, examination of treated animals showed that groups of irregularly oriented cells frequently occupied part of the subepithelial area, rather than the typical fibrous scar detected in the untreated group (Figures 1F–1H). Proliferation was not significantly increased at this stage after Prog-device treatment, as detected by phosphorylated histone H3 (H3P) immunostaining (Figures S1D–S1F). However, we observed a clear difference in the distribution of the immune cells throughout the anteroposterior axis of the regenerate (from amputation plane to wound epithelium). Close to the amputation plane (or proximal region, first quarter), the number of XL2+ cells was significantly higher in the treated group (with an average of 239 ± 54 leukocytes for Ctrl versus 367 ± 22 cells for the Prog-device group; t test p < 0.05). Conversely, the number of XL2+ cells in the blastema core (or distal from the amputation plane, third posterior quarters) was clearly lower in the treated animals (with an average of 846 ± 319 leukocytes for Ctrl versus 404 ± 101 cells for the Prog-device group; Mann-Whitney test p < 0.05; Figures 1I–1K).
Next, we assessed the cellular populations and responses in each condition at the bud-outgrowth stage (2.5–3 mpa). The proliferation index was calculated as the percentage of H3P+ cells relative to the total number of cells (H3P+ cells/DAPI+ cells * 100). The normalized percentage of proliferative cells expressing H3P in Prog-device animals was not significantly different from the untreated Ctrl group (0.4% ± 0.2% versus 0.3% ± 0.3%, t test p = 0.65; Figures 1L–1N). Then, considering the key role of the vascular system in supplying the actively growing regions of the bud (Tschumi, 1957), we examined the organization of blood vessels in regenerating structures. Lacking suitable anti-bodies against Xenopus endothelial cells, we stained for smooth muscle cells (which line the arteries) as a means of detecting vascularization (Di Rosa et al., 1995). a-Smooth muscle actin (SMA; Figures S1G–S1I) staining revealed that although non-statistically significant, there appeared to be considerably more major blood vessels in the appendages of treated animals following the longitudinal axis, while the vascularization pattern in the Ctrl group was predominantly formed by minor arteries (the mean area of SMA+ vessels in the Prog-device group was 91.2 ± 48.2 compared to 45.3 ± 160.8 in Ctrl, t test p = 0.1). Because successful limb regeneration in Amphibia is intimately linked to an adequate innervation of the regenerating tissues (Tanaka and Reddien, 2011), we next evaluated the degree and localization of innervation in the regenerate growth by means of anti-acetylated a-tubulin (Tub) immunofluorescence (Figures 1O–1Q). Nerve patterning in the Ctrl group was characterized by irregular single nerve fibers. An extensive and organized innervation was detected after Prog-device treatment, with the presence of specialized groups or large-diameter bundles of nerve fibers (mean area of Tub+ units or fibers was 6.8 ± 4.6 in Prog-device animals versus 2.6 ± 1.2 in Ctrl, Mann-Whitney test p < 0.05).
Our results suggest that the Prog-device intervention decreases immune infiltration toward the apical region of the blastema area and induces a scar-free wound healing with the robust presence of regenerating nerves, which are key markers of specialized tissue organization.
Prog-Containing Bioreactor Alters Anatomical Outcome and Bone Remodeling during the Different Regeneration Stages
To determine whether the effects of the combined treatment of the hydrogel device plus Prog led to differences in anatomical outcome, animals were allowed to regenerate during a 9.5-month period (similar to the time required for post-metamorphic adult land-phase Ambystoma to regenerate completely [Young et al., 1985], but shorter than the time needed to develop a full-length limb in Xenopus, which can take ~ 2 years).
We analyzed different macroscopic parameters for soft-tissue growth and bone patterning (Figures 2A–2E, S2, S3, and S4; Table S1) at representative stages of the whole regenerative process: 0.5 and 1 mpa (early stages: wound healing and blastema formation), 2.5 and 5 mpa (middle stages: bud outgrowth and shape formation), and 7.5 and 9.5 mpa (late stages and complete regenerate stage).
Figure 2. Gross Morphological Outcomes and Bone Reorganization Show Tendency to Pattern Formation in Animals Treated with the Combined Drug Device.

(A and B) Soft-tissue patterning for Ctrl (top) and Prog-device treated (bottom) animals during a 9.5-month regeneration period.
(A) Amputation plane is indicated with an orange line. Lateral panels show the appearance of the regenerate at 2.5 mpa, when differences between groups become obvious. White arrows point out the typical unpigmented area covering wider regenerates. Scale bar, 1 cm.
(B) Data represent the mean and SD (Ctrl group n > 6 animals for 0.5–2.5 mpa, n = 3 for 5–9.5 mpa; Prog-device group n > 6 animals for 0.5–9.5 mpa). p values after two-way ANOVA are indicated as *p < 0.05, **p < 0.01, ns, no significant difference.
(C–E) Reorganization of the regenerated bone and remaining tissues after treatment and comparisons to the naturally occurring joint formation between femur and tibiofibula bones in intact limbs.
(C) Left: X-ray image of right leg of intact or uncut animals. Typical deviation angle (a, close to 90 ) for joint formation between femur and tibiofibula bones is indicated. An orange dashed line indicates the plane where amputation is performed. Right: X-ray images for Ctrl and Prog-device animals at 7.5 mpa, to evaluate the reintegration of the regenerated bone and remaining tissues (old bone and soft tissue) during limb regeneration (for schematic representation and axis explanation, see Figure S2B).
(D) Deviation angle created by the new bone growth for Prog-device animals is significantly more open than the one for regular spikes in Ctrl or no-device animals.
(E) Graph representing the old-bone displacement (d) during the course of the regeneration, from the longitudinal axis (0) to the medial edge of the soft tissue (−0.5). Values are represented with scatterplots, in which each dot represents one animal. p values after t test (D) or post hoc Bonferroni’s test (E, p < 0.01 for one-way ANOVA) are indicated as *p < 0.05, **p < 0.01, ns, no significant difference.
See also Figures S2, S3, and S4.
Macroscopic differences between untreated Ctrl (Figure 2A, top) and Prog-device treated (Figure 2A, bottom) animals were detected from the onset of regeneration. Wound and epidermis closure occurred during the first 2 weeks for Ctrl animals. Wound healing in Prog-device animals was delayed, being completed after 1 mpa. At 2.5 mpa, corresponding to the proliferative phase and bud outgrowth, noticeable differences were present between groups. While Ctrl regenerates displayed a typical thin-rod shape (Figure 2A, insert in top right panel), Prog-device treated regenerates with their increased outgrowth became more symmetrically cone-shaped (Figure 2A, insert in bottom right panel). As they progress through regeneration and as previously shown (Dent, 1962), untreated animals formed hypomorphic regenerates, consisting of an invariable single and long cartilaginous spike-like structure. In sharp contrast, a common morphological event for Prog-device animals was the progressive flattening (along the dorsoventral axis) of the pyramidal cone shape, growing a variety of altered patterned shapes during the 9.5-month period.
We quantitatively analyzed several parameters of gross anatomy: maximal length of growth (Figure 2B, top), percentage of width change between the amputation plane (W1) and the base of the regenerate (W2; Figure 2B, middle) and the percentage of unpigmented area (Figure 2B, bottom; diagrams and additional details of these measurements are provided in Figure S2A and Table S1). The rate of growth of regenerate tissue was similar in both groups, reaching a plateau between 5 and 7.5 mpa. The percentage of width change was one of the most characteristic differences between groups, with the largest difference at 2.5 mpa (Figure 2A inserts). The pigmentation pattern of the epidermis covering the incipient bud defined clear differences in the regenerative phenotype. At the onset of the regeneration, wounds in the untreated Ctrl group were almost fully covered within 1 or 2 weeks by a pigmented epithelium close to the normal body and stump epidermis. However, the epithelium covering the regenerate edge in Prog-device animals remained with a differential aspect and was unpigmented during the course of the regeneration. A comparative analysis of the percentage of unpigmented skin-covered area of regenerate revealed a significant increase in treated animals, particularly at 2.5 and 9.5 mpa (p < 0.01 after Bonferroni’s post hoc test).
Next, we assayed the extent and pattern of regeneration of new skeletal structures. X-ray analysis revealed several parameters of bone outgrowth at the different phases during the 9.5-month period (Figures 2C–2E, S3, and S4). Differences between groups started at 2.5 months, both for size (maximal length of bone from the amputation plane [BLEN] and maximal area occupied by new bone growth, mostly non-ossified bone or regenerated cartilage [BAREA]) and growth orientation. Considering the recent findings that bone degradation is a key step of regeneration occurring spontaneously after amputation (Sammarco et al., 2015), we next examined the effect that our treatment had on this process. As new bone regrows from above the amputation plane (Figure S4, red asterisk), which started earlier in the Prog-device group, the total area occupied by new or non-ossified bone was higher for most of the treated animals (Figure S4). As expected, given the variability of genetic background (as this population of Xenopus is not isogenic), many of the individual Prog-device animals responded actively to the treatment (responders), reaching values that were clearly higher than Ctrl values, while other treated animals did not (non-responders). The bimodal response between regenerative indicators was consistent across regeneration metrics for most individual frogs (see also Regeneration Index [RI]). For the seven Prog-device animals (PD1–PD7) that were grown up to 9.5 months, a total of five individuals were classified as responders (PD1, PD2, PD4, PD5, and PD7; 71% of the population), and two of them were clearly non-responders (PD3 and PD6; 29% of the population). The highest responders displayed profound differences with respect to Ctrl animals for most of the assays (e.g., morphological, molecular, anatomical, behavioral), while the lowest responders were similar to the Ctrl group for most of the parameters (see Tables S2 and S3 for values reached for each independent frog for each independent criterion of the RI).
At 5 mpa, differences in bone orientation were also visible. New bone in Ctrl animals grew following the same angle and axis as the remaining old bone. However, the newly formed bone in Prog-device animals typically widened at its distal end and deviated from the midline of the intact tibiofibula. Considering the impact of the reintegration mechanism on the joint formation during regeneration (Tsutsumi et al., 2015), we decided to analyze in depth this reorganization of the regenerated bone and remaining tissues for both experimental groups at 7.5 mpa and compare it to the naturally occurring joint formation between the femur and tibiofibula bones (Figures 2C–2E and S3B). The deviation angle (α, 90 in Uncut animals) created by the new bone growth with the remaining old femur for Prog-device animals is significantly more open than the one for regular spikes in Ctrl (untreated amputated; t test p < 0.05), with low deviation from the middle axis. The geometric displacement (d) of the old bone from the longitudinal axis (0) to the medial edge of the soft tissue (−0.5) showed substantial differences between groups. Months after amputation, the old bone in most of the Prog-device animals was displaced toward the medial edge of the soft tissue. This was not seen in Ctrl animals, where the old bone (femur) remained at the middle axis, as it did when the amputation was done (magenta asterisk in A). This trajectory displacement occurs at the most distal part of the femur in Uncut animal limbs to create the joint with tibiofibula bones.
Our macroscopic analyses indicate that the 24-hr treatment with the Prog-containing bioreactor triggers long-term reorganization of both soft tissue and bone outgrowth in most of the treated animals, promoting the formation of significant wider structures covered by a differential unpigmented epithelium and new bone patterning that suggest reorganization that is consistent with joint formation.
Prog-Containing Bioreactor Induces the Formation of Complex, Patterned Structures
Considering the timing for regeneration in adult salamanders and the clear plateau reached after 7.5 mpa, we set the end of the test period at 9.5 mpa. At this stage, untreated Ctrl regenerates displayed cartilaginous spikes, as expected, with a modest level of bone beyond the amputation plane (Figure 3A). In contrast, complex, patterned structures were observed in the treated animals, including broad paddle-like regenerates (Figure 3B), spur-like deviations (Figure 3C), and thick regenerate spikes (Figure 3D). The unpigmented appearance of the epithelium in treated animals was still present, allowing direct visualization of the vascularization pattern, expanding toward the most distal edge of the regenerates. Their unique anatomical outcome was accompanied by a robust bone outgrowth (Figures 3B–3D, X-ray images at right). The skeletal patterning was characterized by two distinct regions: proximal, or nearest the amputation site and extending approximately one-third the length of the regenerate, a swelling of weakly ossified bone, and distal, with non-ossified bone or regenerated cartilage traveling toward the most posterior end. The close correspondence between external morphology and X-ray images revealed that the area of bone swelling was coincident with the pigmented portion of the epidermal layer, and the section occupied by immature bone remained under unpigmented epithelium.
Figure 3. Instead of the Typical Spikes Formed in the Absence of Treatment, Combined Prog-Device Treated Animals Regenerate Complex Patterned Paddle-like Structures.

(A–D) Anatomical outcome (left) and X-ray images (right) of regenerates formed in adult Xenopus hindlimb amputation after no treatment (Ctrl, A) and after 24-hr combined treatment of drug-loaded device (Prog-device, B–D).
(A) Red arrow indicates the hypomorphic cartilaginous structure, spike, lacking specialized tissues.
(B–D) Green arrows on soft tissue images (left panels) indicate the dense and sprouted vascularization, easily visualized due to unpigmented epithelium covering the regenerates of treated PD7 (B), PD5 (C), and PD1 (D) animals. X-ray images (right panels) show the new bone growth within the regenerates of treated PD7 (B), PD5 (C), and PD1 (D) animals (weakly ossified bone close to the amputation plane, green arrows; non-ossified bone or regenerated cartilage traveling toward the distal part, turquoise arrows in B–D; magenta arrow in A indicates the absence of bone regeneration in the distal spike). Individual identification of each animal is indicated in white (Ctrl: untreated control, PD: Prog-device treated, followed by the individual number).
(E) Shape profiles, as obtained after MorphoJ software measurements (see Figure S2B for details), for un-treated (red) and Prog-device treated animals (green). Each circle indicates the average position for each landmark, after computations for n = 3 and n = 7 animals in Ctrl and Prog-device groups, respectively. Quantification and statistical analysis of these shape states showed significant differences in the Mahalanobis distance (p < 0.05) for the profile of the shape of the regenerate.
(F) Application of RI to regenerates at both 2.5 and 9.5 mpa (two-way ANOVA, p < 0.01 for ‘‘group’’ factor). Scatterplots are presented in which each dot represents one animal.
(G and H) Quantification of regenerated limb length (a′ + b′) relative to uncut limbs (a + b) revealed that the regenerating hindlimb stops growing at a point at which, under normal growth conditions, the animal’s digits appear (yellow arrows) (G). Values in (H) are represented with scatterplot, in which each dot represents one animal.
See also Tables S1 and S2.
To characterize and quantitatively compare the regenerate shapes between groups, we used morphometric analysis (Figure S2B). Compilation of the resultant ‘‘average shape’’ (Figure 3E) for each group clearly showed that untreated animals developed shapes with drastic narrowing as the structure grew, forming a typical curvature at the tip. Conversely, the Prog-device treated group developed, on average, broader regenerates with less curvature at the end. Quantification and statistical analysis of these shape states showed significant differences in the Mahalanobis distance (p < 0.05) for the profile of the shape of the regenerate.
To facilitate a wholistic analysis of the complex, multifaceted response among the cohorts, we next integrated all of the observed and quantifiable differences between untreated Ctrl and Prog-device treated animals into a composite regenerative index (RI; ranging from 0, a typical hypomorphic spike, to 10, a patterned paddle-like regenerate; see STAR Methods and Tables S3 and S4). We calculated the RI of both experimental groups at two different time points, based on our previous findings of strong differences emerging at 2.5 and 9.5 mpa (Figure 3F; Tables S2 and S3). Our findings clearly revealed a significant difference between untreated and treated groups (two-way ANOVA, p < 0.01 for ‘‘group’’ factor). At 2.5 mpa, the mean RI for the Ctrl group was 1.4 ± 0.4 versus 6.9 ± 1.1 for the Prog-device animals. At 9.5 mpa, Ctrl animals displayed a mean RI of 1.0 ± 0.6, while Prog-device animals showed an average RI of 6.7 ± 1.1. The application of the RI confirmed a bimodal response to the treatment in the Prog-device treated group. The responder individuals reached the highest index scores (PD7 and PD5 in Figures 3B and 3D, respectively, with RI = 10), while non-responders (PD1 in Figure 3D) had low RI scores.
Having observed that regenerates stop growing after ~ 5–7.5 mpa (Figure 1B, top), we asked whether the endpoint corresponded to any specific anatomical level (position), as gauged by the contralateral (uncut) limb. Quantification of the regenerated limb length (from the knee to the tip of the regenerate) relative to the contralateral uncut limb revealed that the regenerating hindlimb stops growing at a point at which, under normal growth conditions, the animal’s digits would appear (Figures 3G and 3H; when it reaches the length of tibiofibula + tarsus).
Our findings demonstrate that the shape of the regenerate long after amputation can be drastically improved and that long-term repatterning can be induced by an intervention applied for 24 hr at the amputation site.
Repatterning Induced by 24-hr Prog-Device Treatment Is Accompanied by Cellular and Tissue Changes in the Most Distal Part of the 9.5-mpa Regenerates
To further characterize the long-term effects of the Prog-containing bioreactor, we asked whether cellular and tissue differences were present along with the differences in external morphology.
The most distal part of the regenerates (tip) was immunostained to detect innervation (Tub) and vascularization (SMA) pattern (Figures 4A–4F and S5A). Overall, untreated spikes displayed a less differentiated surface for nerves and vessels, being limited to the peripheral edges (Figures 4A and 4C, magenta arrows). Treated regenerates showed a larger specialized surface (Figures 4B and 4D, turquoise arrows), projected toward the internal part of the tissue or cartilage core. Similar to organization detected at the early blastema stages (Figures 1O–1Q), both nerves and vessels showed a higher number and degree of organization after treatment, forming nerve compact units such as bundles and elongated vessels. Control animals expressed an average of 44 ± 19 Tub+ fibers per square millimeter, with a mean fiber area of 351 ± 168 μm2. Prog-device animals had an average of 95 ± 41 Tub+ fibers per square millimeter (t test p < 0.01, with respect to Ctrl), with a mean bundle size of 972 ± 515 μm2 (Mann-Whitney test p < 0.01). Quantification for SMA immunostaining revealed that while Ctrl animals expressed SMA in 10 ± 4 cells per square millimeter (with an average area of 451 ± 206 μm2), Prog-device treatment increased significantly both the number (31 ± 15 SMA+ cells per square millimeter; Mann-Whitney test p < 0.01) and the grouping of nerve fibers (mean area of SMA+ vessels of 695 ± 327 μm2; t test p < 0.01).
Figure 4. Prog-Device Treated Animals Show Significantly Greater Innervation and Vascularization than Untreated Animals at the Most Distal Part of the 9.5-mpa Regenerate, with Patterns Closer to Uncut (Intact) Limbs.

(A–D) Low-magnification immunofluorescence images of DAPI-counterstained cross-sections revealing innervation (anti-acetylated a-tubulin antibody [Tub]) and vascularization (anti-smooth-muscle actin antibody [SMA]) of amputated untreated (Ctrl) and amputated plus Prog-device (Prog-device) treated animals. The overall area occupied by Tub+ fibers is significantly greater in treated tips (turquoise double-headed arrow in B, compared to magenta double-headed arrow in A). Similarly, the density and extension of the blood vessels for Prog-device treated animals (D, turquoise arrows) is higher when compared to untreated animals (C, magenta arrows). gl, SMA+ epidermal glands were not included in the analysis. Scale bars, 250 μm. The cartilage core of the 9.5-mpa regenerates is indicated in (A). For a schematic representation of the plane cut, see igure S5A.
(E and F) Quantitative results of number of positive units per square millimeter and area per unit for Tub (E) and SMA (F) immunofluorescence in Ctrl (red) and Prog-device groups (green). Values are represented with scatterplots, in which each dot represents one histological section, and each dot style represents one animal (with at least three histological sections). Statistical analysis was performed on the pooled individual sections. Horizontal line indicates mean. p values after Mann-Whitney test (unequal variances) or t test (equal variances; only for E, left) are indicated as **p < 0.01.
(G–N) High-magnification images revealed that while in untreated animals, the typical nerve patterning is composed of individual and unpatterned nerve fibers (magenta arrows in G), Tub+ axons in Prog-device animals show a tendency to group organization, forming bundles (turquoise line-encircled areas in H), similar to the nerve organization in intact or uncut limbs (turquoise line-encircled areas in I and J). Both the number and morphology and area of the SMA+ vessels for Prog-device tips were clearly closer to the intact limb (turquoise arrow and asterisks in L, M, and N) than to the Ctrl untreated limbs (small vessels indicated by magenta arrows in K). See Table S4 for quantitative data. Scale bars, 100 μm.
Next, we compared the neurovascular patterning of the tips to the patterns present in uncut or intact limbs. Morphological comparison to cross-sections of uncut limbs (belonging to two different regions: proximal or distal with respect to the plane for the amputation; Figure S5B) revealed that both innervation and vascularization patterns of Prog-device treated regenerates are closer to those in the uncut limb (Figures 4G–4N; Table S4). Individual and disorganized nerve fibers defined the typical Ctrl innervation pattern (Figure 4G, magenta arrows), while Tub+ axons in Prog-device treated animals showed a clear tendency toward organization and bundle formation (Figure 4H, turquoise dashed-line circles), similar to the innervation detected in uncut limbs (Figures 4I and 4J, turquoise dashed-line circles). Additional comparisons between Prog-device treated tips and the two different levels of an uncut limb revealed that innervation of Prog-device tips was more similar to the one in the distal region of the hindlimb. Likewise, both the number and morphology and area of the SMA+ vessels for Prog-device tips were clearly closer to the intact limb (Figures 4L–4N, turquoise arrow and asterisks) than to the Ctrl untreated limbs (small vessels indicated by magenta arrows in Figure 4K). Our results show that the Prog-containing bioreactor initiates a long-lasting positive impact on regeneration, detectable more than 9 months later, leading to structures that are morphologically similar to an intact or uncut limb.
Use of the Regenerates in Prog-Device Treated Animals Reveals More Complex Swimming Activity than in Spike-Regenerating Animals
Having quantified anatomically and morphologically the degree to which our composite treatment improves regeneration, we next investigated the locomotor patterns, asking whether the animals used these appendages more effectively than a spike. To accomplish this, movies were taken of individuals from control, treated, and unamputated groups, and behavioral observations, typically used to study locomotion in Xenopus (Archard, 2012; Burghardt, 2013; Ihmied and Taylor, 1995), were quantified (Figures 5 and S6; Table S1).
Figure 5. Locomotor Activity in Prog-Device Treated Animals Resembles More Closely that of Uncut Animals.

(A) Quantifications of efficient activity levels, measured by counting the number of active movements (with trajectory displacement). Values are represented as mean ± SD (n = 4 animals per group). One-way ANOVA p < 0.01. p values after Bonferroni’s post hoc analysis are indicated as *p < 0.05, **p < 0.01, ns, p > 0.05.
(B) Surfacing frequency or number of visits to the water-air surface performed by each experimental group per time unit (minute). Values are represented as mean ± SD (n = 4 animals per group). One-way ANOVA p < 0.01. p values after Bonferroni’s post hoc analysis are indicated as *p < 0.05, **p < 0.01, ns, p > 0.05.
(C) Graphic representation of the percentage of time spent in each quadrant of the tank per experimental group. Unbiased exploration (black line) is shown as reference (25% of time in each quadrant). Analysis of the time distributions within each experimental group showed clear significant differences (p < 0.01 for χ2(0.05,9)). Data represent the pooled distribution of animals per group (see Figure S6A for contingency graph).
(D) Mean speed (expressed in centimeters per second) at which each animal (represented by individual dots) swims around the tank. Orange squares, uncut or intact animals; green circles, amputated animals followed by Prog-device combined treatment; red triangles, amputated animals without additional treatment.
See also Figure S6.
First, we evaluated the general activity (number of ‘‘effective’’ movements; Figure 5A). When compared to non-amputated animals, the amputated Ctrl with spike-like regenerates were significantly less active when assessed during a 3-min period. Despite also having been amputated, treated animals were far more active, showing activity levels significantly increased from untreated and indistinguishable from uncut or intact populations (one-way ANOVA p < 0.01). Second, we quantified the surfacing frequency and percentage of time spent in each quadrant of the tank per animal and experimental group, classical indicators used to differentiate stationary or motionless versus active swimming in amphibians (Burghardt, 2013; Holmes et al., 2016). Prog-device animals scored closer to the Uncut group (non-amputated) for both parameters, resulting in clear significant differences with respect to Ctrl (one-way ANOVA p < 0.01 for surfacing and χ2(0.05,9) p < 0.01 for time distribution; Figures 5B, 5C, and S6A).
To isolate the functionalization of the regenerate or how the regenerate limbs were used in motion, we next evaluated speed during movement (Figure 5D). Although not statistically significant (one-way ANOVA p > 0.05), Ctrl animals showed homogeneity in the speed values (SD ±0.3; possibly related to remaining in one exclusive quadrant), while Prog-device animals displayed a broad range of values (SD ±2.1), similar to those obtained for the Uncut group (SD ±1.7).
These findings suggest that treatment not only improves the overall morphology of amputated regenerates but also that these patterned structures or ‘‘paddles’’ could be recognized and used by the animals in swimming and/or active behaviors similar to the original limb.
Transcriptome Analysis Identifies Unique Key Genes and Cell Processes Exclusively Regulated by the Prog-Containing Bioreactor
Given the long-term anatomical and functional outcomes obtained after only 24 hr of treatment, we sought downstream mechanisms underlying the response. To characterize the molecular events taking place between device exposure and sub-sequent responses, we conducted RNA sequencing (RNA-seq) and compared the transcriptome analysis of the blastema for Ctrl (amputated and untreated), Sham (amputated and treated with only hydrogel device, no drug) and Prog-device (amputated and treated with hydrogel device filled with drug) animals. Read counts, mapping metrics, and alignment percentages of samples to the Xenopus genome are provided in Table S5. The alignment percentages for the 9 samples ranged between 54.91% and 68.34% (mean 0.69%, SD 4.99%). The number of differentially expressed genes (DEGs) was determined after multiple testing corrected the p value. The Q value was set at a false discovery rate (FDR) of 0.05, and differentially expressed genes were considered to be those transcripts passing this FDR and those showing a log2 fold change of 2. When comparing blastema (BL) of Sham versus Ctrl groups, there was a total of 66 differentially expressed genes. This number was dramatically increased when comparing the blastema of Prog-device versus Ctrl animals, with a total of 531 differentially expressed genes (Figure 6A; all differentially expressed transcripts are provided in Data S1). Considering the highest response (more than log2 = 4.0), amputation followed by only hydrogel device attachment, Sham, when compared to Ctrl, induced a significant downregulation of nicotinamide adenine dinucleotide (NADH) dehydrogenase (ubiquinone) 1 beta sub-complex subunit 10-like, zinc-finger protein 850-like, and enhancer of polycomb homolog 1-like transcripts, among others. Transcripts that were highly upregulated after Sham intervention, when compared to Ctrl, included SMAD family member 4, olfactory receptor 51L1-like, and capZ-interacting protein-like transcripts (for the complete list of genes that show more than log2 = 4.0, see Table S6). The combined treatment after amputation (hydrogel device filled with drug, Prog-device group), when compared to Ctrl, resulted in the downregulation in the blastema of neuropeptides and signaling molecules such as prolactin, arginine vasopressin, somatostatin, cholinergic receptor nicotinic alpha 7 subunit, RAS-like family 12, engulfment and motility (ELMO) domain containing 1, and olfactory receptor family 52 subfamily D member 1, among others. Examples of transcripts that were upregulated after Prog-device treatment included histone H2B 1.2, superoxide dismutase 3, multiple inositol-polyphosphate phosphatase 1 L homolog, nuclear pore complex protein Nup214-like, transmembrane protein 256, and selenoprotein F (for a complete list of genes with more than log2 = 4.0, see Table S6).
Figure 6. Subnetwork Enrichment Analysis of All Three (Ctrl, Sham, and Prog-Device) Blastema Datasets Showing Quantitatively and Qualitatively Differences for Regulated Transcripts and Cell Processes after Combined Prog-Device Treatment.

(A and B) Venn diagram comparing genes (A) and subnetworks (B) regulated in blastema for both Sham and Prog-device interventions.
(C) Pie chart of the functional classification of the pathways exclusively regulated after Sham intervention (top, amputation followed by only hydrogel device) or after the combined Prog-device treatment (bottom, amputation followed by hydrogel device + drug).
Complete data are presented in Data S1.
The differences between Sham and Prog-device groups were also clearly notable in the subnetwork enrichment analysis (SNEA; Figure 6B). There were 18,718 (Sham) and 18,762 (Prog-device) entities (or transcripts) that were mapped successfully to Pathway Studio (Elsevier), depending on the treatment. There were 150 networks that were enriched and altered in the blastema after the Sham intervention, while the combined Prog-device approach led to the enrichment of up to 190 different and specific pathways (both cases when compared to Ctrl group; Figure 6B).
To reveal the types of processes regulated by our intervention, we grouped the enriched pathways considering ‘‘large-scale functions.’’ We identified and quantified (with respect to total) several large-scale function gene clusters within the blastema dataset for Sham (Figure 6C, top) and Prog-device (Figure 6C, bottom) treatments. The percentage of some categories such as bone related, carbohydrate/lipid metabolism related, or muscle related were more prevalent in the Sham dataset compared to the Prog-device group. Conversely, large-scale functions detected in the Prog-device dataset (but not the Sham group) were related to organ function and physiology, blood and cardiovascular system, immune system and infection, and vision and sensory system. A principal-component analysis was conducted in JMP Genomics (version 8) to visualize the biological replicates within the ‘‘no device’’ (Ctrl), ‘‘Sham,’’ and ‘‘Prog-device’’ treatments. Normalized counts of differentially expressed genes were used in the principal-component analysis (PCA) for each biological replicate, and both Sham (yellow circles) and Progdevice (green circles) animals separated strongly from the Ctrl or No-device group (red circles). This suggests that the device can have a profound effect on the blastema transcriptome and that the use of Prog can alter the core transcriptional response when compared to the silk device alone with no added Prog.
Next, to gain further mechanistic insight, we identified cell processes that were either shared by both Sham and Prog-device treatment or unique for each intervention (complete data are presented in Data S1). Common downregulated cell processes included those that regulate membrane potential and elements of the dopaminergic system and muscle physiology (Figure S7; complete data are presented in Data S1). Most of the transcripts regulated exclusively by the complex intervention (Prog + de-vice) were related to hormone signaling in reproductive, osmoregulatory, and circulatory systems (Figure 7B). Significant cell processes exclusively upregulated after Prog-device treatment included a list of key genes that are involved in redox stress, serotonergic transmission, or leukocyte proliferation (Figure 7C), while important downregulated processes included genes responsible for neurotransmission signaling and dynamic changes in Ca2+ and K+ (Figure 7D). All of the genes within a differentially expressed pathway are provided in Data S2. Thus, our analysis reveals profound transcriptional remodeling of the regeneration blastema in Xenopus induced by a Prog-containing bioreactor and suggests numerous pathway targets for subsequent study and therapeutic interventions.
Figure 7. Potential Targets (Gene Networks and Cell Processes) of the Combined Treatment (Device + Drug).

(A) Unweighted principal coordinate analysis (PCoA) demonstrated a clear separation of red, yellow, and green clusters representing Ctrl (or ‘‘no device’’), Sham (or ‘‘only device’’) and Prog-device (or ‘‘device + drug’’), respectively.
(B–D) Gene networks exclusively regulated in the blastema by the combined Prog-device treatment showing (B) enrichment of reproduction and osmoregulation processes, (C) upregulation of genes involved in, among others, tissue remodeling (compared to Sham), and (D) downregulation of genes involved in, among others, neurotransmission signaling and ionic flow (compared to Sham). Green, down gene; red, up gene.
See also Figure S7. Complete data are presented in Data S1. All of the measured genes found in a pathway are located in Data S2.
DISCUSSION
The treatment described herein induced large, paddle-shaped regenerates, demonstrating a clear improvement over the wellknown cartilaginous spike. The treatment appears to reactivate the early regenerative response, because transcriptional networks are specifically suppressed or enriched as soon as 24 hr after treatment, and morphological differences are already visible at 2 weeks post-amputation. We previously demonstrated that that body-wide pharmacological modulation of Vmem can induce functional regeneration of the froglet leg at a non-regenerative stage (Tseng and Levin, 2013). To achieve localized delivery (essential for broadening the class of treatments that can be used without toxicity), we designed a wearable bioengineered bioreactor: the wearable bioreactor (Golding et al., 2016; Hechavarria et al., 2010). The silk-hydrogel-based device, even though present very briefly, created a pro-regenerative environment, enhancing bone remodeling. Micro-computed tomography (CT) quantifications revealed that animals with devices had a significant increase in bone volume, surface area, and density. Qualitative observations on immunostained sections also detected the presence of nerve tissue or SMA+ vessels in treated animals. Although morphologically regenerates from treated animals tended to be longer than those from no-device animals, no pattern or complex structures or shapes were detected, which differs from the rod-shaped spike. Our data suggest the brief application of a Prog-containing bioreactor as a promising modality for initiating complex, longlasting, pro-regenerative outcomes.
Transcriptome analysis of the blastema of treated animals revealed that the genes with the highest response (more than log2 = 4.0; Table S6) were related to the nuclear signaling of the PR (e.g., histone H2B, inositol-polyphosphate phosphatase, and nuclear pore complex protein Nup214-like). The upregulation of these transcripts strongly suggests the activation of the PR by device-supplied Prog, initiating transcriptional-related signaling that implies a net increase in phosphorylation, nuclear internalization, and nucleosome remodeling with displacement of histone H1 and H2A/H2B dimers (Grimm et al., 2016). These transcripts were specifically upregulated in the Prog-device group and they did not appear in the blastema of the Ctrl and Sham groups. In addition, ELISA analysis (Figures S1A–S1C) demonstrated that the Prog contained in the wearable bioreactor was released only to the amputation site, validating the strategy of drug device: a compound targeting different pathways can be applied locally to an injury site.
Our results suggest the formation of a partial blastema in an adult frog, which is consistent with the idea that the regenerative ability is an intrinsic property of limb cells in adult non-regenerative animals (Sessions and Bryant, 1988), susceptible to reactivation by appropriate master regulators. Functional analysis of locomotor activity demonstrated that animals regenerating complex patterned structures use them differently than untreated animals use their cartilaginous spikes (Figure 5). Future studies will determine whether this is due to mechanophysical properties (passive consequences) or whether brain recognition of the new structure could be enhancing the regenerative process.
The main limitation of this model, in contrast to tadpole or froglet studies, is the long periods of time needed to observe effects and the significant effort in surgeries and subsequent animal husbandry for months. Also, molecular and/or histology analyses cannot be performed on the same animals in which regenerative outcomes are to be assayed, significantly limiting the overall number of animals. Future improvements of in vivo imaging technology, transgenic Xenopus, and antibodies that work well in amphibian tissues will further expand the range of analysis in this assay. We do not claim to dissect the contribution of every possible factor in this treatment (e.g., stitches, mechanical aspects of protection of the blastema from fluid flows in the tank, oxygen levels, trapping of wound exudate) that result from having a biodome attached to the combined (device + drug) therapy. It would be impractical to test each of the components of this treatment independently; for this reason, while the RNA-seq data do distinguish between the effects of silk device versus Prog specifically, we focused mainly on the regenerative outcomes of the complete intervention. Future large-scale work motivated by this study could probe all of the individual aspects.
While the wearable bioreactor provides the capability of addressing the wound site directly without side effects on other tissues (as demonstrated with the increased levels of Prog only at the injury site and not at other distant tissues; Figures S1A–S1C), it is important to note that other important inputs (and, indeed, downstream consequences of Prog signaling) may be systemic. Recent work on the bioelectrics of brain patterning (Pai et al., 2015), cancer normalization (Chernet et al., 2015; Chernet and Levin, 2014), and the role of the brain in muscle patterning (Herrera-Rincon et al., 2017) reveals that important morphogenetic cues come from distant regions that may need to be addressed by future therapies. Especially important are recent data revealing that information on injury is available throughout the organism (Rodgers et al., 2017).
The anatomical pattern of the treated regenerates was variable, as revealed by the regeneration index (Figure 3F), containing highly responsive individuals (remarkable paddle-like structures) compared with animals that scored similarly to untreated animals. Xenopus are not isogenic, and it is likely that the genetic background diversity of the animals contributes to the difference in response. It is also likely that future improvements in technique, such as more reliable contact between stump and hydrogel-drug device, will improve the consistency of the results. It is an important part of our ongoing analyses to identify genetic, epigenetic, microbiological, and biophysical factors that would be predictive of regenerative response or can be targeted to in-crease consistency.
The combined Prog-device treatment induces the differential regulation of 531 elements or genes and 190 pathways, with respect to amputated but untreated animals (Figures 6A and 6B; for a complete list of differentially regulated transcripts and pathways, see Table S6 and Data S1 and S2). Large-scale functions most differentially altered in Prog-device blastema are related to blood and osmoregulation, neural signaling, and leukocyte or immune response (Figure 6C, bottom). The overall downregulation of numerous transcripts related to the modulation of resting potential (Figure S7A) is consistent with a strategy in which cells tighten their physiological state to focus on repair; by reducing the normally diverse electrogenic machinery (containing many channels and pumps with opposing effects on Vmem, depending on various ligands and other conditions), cells can use a few key electrogenic components that are needed to maintain a consistent pro-regenerative bioelectric profile (Adams et al., 2007; Levin, 2007, 2014).
One possible explanation for the ontogenetic decline in regenerative ability in frogs is that the wound epidermis becomes nonfunctional after metamorphosis (Tassava and Olsen, 1982). The wound epidermis is necessary for maintaining dedifferentiated cells of the amputated limb stump in the cell cycle. Our results showing that treated animals maintain a differential and unpigmented epithelium, similar to regenerating animals, during the course of the regeneration (Figures 2A, bottom; 2B, bottom; and 3B–3D) could indicate that this is a key target for the combined treatment.
The treated regenerates have more innervation and ‘‘functional’’ nerve organization (in bundles) from the earlier stages of regeneration (Figure 1Q) to the complete stage (Figure 4), which is consistent with the well-known importance of innervation in regeneration (Kumar and Brockes, 2012; Singer, 1952). Failure to regenerate in the wild-type case could be due to regenerating nerves that cannot interact with the wound epithelium (WE), totally covered by scar tissue (similar to what has been suggested for mice [Miura et al., 2008; Tassava and Olsen, 1982]) (Figure 1P). Our Prog group exhibited more regenerating axons innervating into the WE and could be converting it to the regeneration-permissive WE, the apical epithelial cap. We found high expression of PR in bone marrow (Figures 1B–1E). Mature monocytes and macrophages are capable of differentiating into osteoclasts under a suitable microenvironment prepared by bone marrow-derived stromal cells (Udagawa et al., 1990). Increased osteoclast activity is consistent with our results for increased bone remodeling in the treated group (Figures 2C–2E and 3A–3D). Bone regeneration could perhaps be a template for patterning and regeneration.
In conclusion, evidence from the many diverse analyses reported here suggests that to enhance the regenerative response in non-regenerating animals, it is necessary to act on a broad and complex network of cell processes. Upregulation of pathways related to blood vessel supply and activity (e.g., blood vessel permeability), effects on neural growth and signaling (e.g., decreased dopaminergic transmission and increased serotoninergic and adrenergic signaling, bundle organization of neuritis, inhibition of glial adhesion), alterations in immune cell activity (e.g., avoiding the accumulation of leukocytes at WE), inhibition of the import of Ca2+ and membrane depolarization, or decreased lipid and carbohydrate metabolism may be important mechanisms explaining our results and straightforward targets for further exploration. It is likely that progress in regenerative medicine will be greatly augmented by identifying master regulators or triggers that, like our Prog device, can induce this complex set of downstream events without needing to micromanage each one.
One of the main benefits of the wearable bioreactor is that it allows the establishment of a localized environment. For example, recent work showing that hypoxia (and O2 level in general) is an important regulator of regeneration (Nakada et al., 2017) suggests the need to instrumentalize the bioreactor in future versions to record bioelectric and physiological parameters. Microfluidic and optogenetic components to deliver spatio-temporal patterns of chemical factors and bioelectric states are also planned. Finally, studies to transition this strategy to mammalian models are under way.
One of the biggest open questions for the future of this field concerns how much micromanagement of the regenerative process will be needed besides the initial ‘‘kick-start’’ signal. It is likely that the eventually successful strategy will be a kind of guided self-assembly, relying on endogenous morphogenetic modules with the occasional external manipulation to keep the growth on course to a proper restoration of function. Tractable models of complex appendage regeneration via techniques that facilitate the exploration of a highly diverse set of inputs and evaluation metrics are an essential step in the regenerative medicine road map. Such compound interventions will not only bring us closer to the repair of complex structures but also are likely to reveal profound aspects of the mechanisms regulating biological structure and function.
STAR*METHODS
KEY RESOURCES TABLE
| REAGENT or RESOURCE | SOURCE | IDENTIFIER |
|---|---|---|
| Antibodies | ||
| Rabbit polyclonal anti-phospho-Histone H3 | EMD Millipore | Cat# 06–570; RRID: AB_310177 |
| Mouse monoclonal anti- anti-acetylated alpha tubulin (clone 6–11B-1) |
Sigma-Aldrich | Cat# T7451; RRID: AB_609894 |
| Mouse monoclonal anti-XL2 | This paper | N/A |
| Mouse monoclonal anti-alpha smooth muscle alpha-actin (clone 1A4) |
Sigma-Aldrich | Cat# A2547; RRID: AB_476701 |
| Chemicals, Peptides, and Recombinant Proteins | ||
| Surgical Stitches | ETHILON® | Monofilament non-Absorbable 7–0 |
| Device silicone rubber | Smooth-On | Dragon Skin Very Fast 10A |
| Silk hydrogel | This paper | N/A |
| Horseradish Peroxidase | Sigma-Aldrich | Cat# P8375 |
| Prog | Sigma-Aldrich | Cat# P7556 |
| Prog 3-(O-carboxymethyl)oxime:BSA-fluorescein isothiocyanate conjugate; PFITC |
Sigma-Aldrich | Cat# P8779 |
| Hydrocortisone | Sigma-Aldrich | Cat# 0888 |
| Critical Commercial Assays | ||
| TRIzol™ Reagent | Ambion, Invitrogen | Cat# 15596018 |
| Invitrogen Prog Competitive ELISA kit | ThermoFisher Scientific, Invitrogen | Cat# EIAP4C21 |
| Protein Quant-iT kit | ThermoFisher Scientific, Invitrogen | Cat# Q33210 |
| Deposited Data | ||
| Raw data files for RNA sequencing | NCBI Gene Expression Omnibus | GEO: GSE118454 |
| Experimental Models: Organisms/Strains | ||
| X. laevis: Juvenile male and female | Nasco | LM00453MX |
| Software and Algorithms | ||
| ImageJ (1.47v) | Wayne Rasband, NIH | https://imagej.nih.gov/ij |
| MorphoJ | Klingenberg, 2011 | http://www.flywings.org.uk/MorphoJ_page.htm |
| Photoshop CC 2015 | Adobe | https://www.adobe.com/products/photoshop.html |
| Pathway Studio (v10.0) | Elsevier Life Science Solutions | https://www.pathwaystudio.com/ |
| GraphPad Prism (v 5.0c) | GraphPad Software, Inc. | https://www.graphpad.com/ |
| Regeneration Index | This paper | N/A |
| Tracker (v 5.0.6) | Open Source Physics | https://physlets.org/tracker/ |
CONTACT FOR REAGENT AND RESOURCE SHARING
Further information and requests for reagents may be directed to, and will be fulfilled by, the Lead Contact Michael Levin (Michael. Levin@tufts.edu).
EXPERIMENTAL MODEL AND SUBJECT DETAILS
Xenopus laevis
All experimental procedures involving adult Xenopus laevis were approved by the Institutional Animal Care and Use Committees and Tufts University Department of Laboratory Animal Medicine under protocols M2017–53.
One hundred and thirteen juvenile male and female Xenopus laevis frogs (Juvenile Xenopus laevis Frogs LM00453MX, Nasco, Fort Atkinson, WI) were used in this study. Frogs of the different sex were randomly assigned to experimental groups.
METHOD DETAILS
Surgery and regeneration period
Hind-limb amputation, followed by 24h device attachment, was performed as described previously (Golding et al., 2016). Briefly, animals were anesthetized by soaking in 0.05% benzocaine buffered solution and then injected with 75 µg/kg of the analgesic buprenorphine. The right hindlimb was then amputated slightly below the middle of the tibiofibular bone with a sterile #10 scalpel blade. After recovery, animals were allowed to rest for approximately three hours before any further manipulation. Amputated animals were then randomly split in untreated (Control) or treated (Prog-device) groups. Randomized controlled trial conditions were maintained throughout the experiment. Control animals received no further manipulation, whereas the treated or experimental animals were followed by the attachment of a Prog-silk hydrogel contained within a wearable bioreactor device. Fifteen additional animals were treated as Sham for the wearable silk-hydrogel device (Sham or Silk group). Sham animals received equally device attachment immediately after amputation. Sham device contained only silk hydrogel, and no the combined therapy with drug. The method for device attachment included, first, a small rubber wrap secured around the hindlimb directly above the amputation plane, and second, surgical stitches (ETHILON® monofilament non-Absorbable 7–0 suture) between the outer layer of device and stump’s skin to position appropriately the device around the limb. After device attachment, animals were returned to their tanks and allowed to move normally. The devices were removed 24 hours (24 h) after attachment using forceps and surgical scissors. After device removal, animals were placed in 10-l tanks containing a maximum number of five animals. Frogs in all groups were monitored, individually tracked and assessed for regeneration for a maximum period of 9.5 months post-amputation (mpa) (see Figure 1A for schematic representation of the experimental design). At representative time points, animals were photographed and X-ray imaged for quantitative morphometric assessment of the soft tissue and bone patterning. After in vivo imaging, animals were again placed into tanks for normal recovery and some of them were sacrificed for further histological analysis. Uncut animals, without any limb manipulations but with the same anesthesia and handling procedures, were used to serve as the basal reference for some parameters.
Hydrogel Device Preparation and Drug loading
Hydrogel devices were prepared as described in (Golding et al., 2016). To summarize, the device consisted of a silicone rubber outer protective cover and a silk hydrogel insert. The outer protective cover was fabricated by casting Dragonskin silicone rubber (Smooth-On, Harrisburg, PA) into a 3D printed acrylonitrile butadiene styrene (ABS) mold (Dimension Elite, Stratasys, Edina MN). The hydrogel inserts were fabricated with of an enzymatically crosslinked 3% (w/v) silk solution. The enzyme utilized for the gelation was horseradish peroxidase (Sigma-Aldrich, St. Louis, MO) at a final concentration of 20 U/mL silk solution. To induce gelation, hydrogen peroxide was added to the solution at a final concentration of 0.01% (v/v). After initiation, the solution was then pipetted into the silicone outer cover in a two-step process to create the base and sides of the hydrogel insert. This was then incubated in a 37 C oven for 30 minutes to ensure solgel transition. For the drug-loaded device, water-soluble Prog (conjugated to dextran to increase solubility; #P7556 Sigma-Aldrich St. Louis, MO) was loaded into the silk solution before gelation at a final concentration of 500 µg/mL gelation solution.
In-vivo and X-ray Imaging
Animals were individually monitored with digital images and X-rays at 0.5, 1, 2.5, 5, 7.5 and 9.5 mpa. In vivo images were taken under low anesthesia dose (benzocaine 0.03%), with an Olympus Tough TG-4 camera. Special care was taken to ensure the same light conditions, background and position of the camera respect to the animals. A micrometric ruler was always placed in the frame for standardization. Limb X-rays were then taken immediately using the Nomad Pro 2TM Handheld X-Ray device, applying the standard settings (60 kV, 2.5 mA) for 0.20 s. Progressive macroscopic parameters of the frogs’ hindlimb regrowth in both stump (soft tissue) morphology and bone patterning were quantified using ImageJ, MorphoJ, and Photoshop software.
Soft tissue patterning: scaled digital photographs for each time point were analyzed in ImageJ for: i) percentage of width change (WID) between amputation plane (W1) and the base of the regenerate (W2, most anterior plane, right above the narrowing), ii) percentage of unpigmented epithelium covering the regenerate (usually referred as unpigmented area, UNA) over the total (pigmented + unpigmented) regenerated area, and iii) maximal length of growth (LEN), or distance between amputation plane and the tip of the regenerate (most distal point), normalized to the total animal length (anterior-posterior axis, from snout to vent). Diagram and additional details of these measurements are given in Figure S2A and Table S1.
At the latest stages for the regeneration period (7.5 and 9.5 mpa, respectively) two additional parameters were evaluated. The shape characterization of the regenerate (SHAPE) was done at 7.5 mpa by using techniques of geometric morphometrics, as previously described in (Mondia et al., 2011). To this, 12 points or landmarks were selected and placed along the regenerate on digital images (two at the amputation plane, two at the base, two at the tip, and six semi-landmarks or midpoints between the previous ones). MorphoJ software (Klingenberg, 2011) performed the operations considering X and Y coordinates to create a wireframe determination of the average positions of the points relative to one another. Mahalanobis distance was used to compare statistically the differences in shape. A reference axis, at the middle point of the longitudinal axis, was placed to evaluate the curvature at the tip of the regenerate (CURVE at tip). Diagram and additional details of these measurements are given in Figure S2B and Table S1. At 9.5 mpa, the length of the regenerated structure (a’ + b’), from the knee to the tip of the regenerate (a’ = length from the knee to the amputation plane, b’ = LEN = length from the amputation plane to the tip) for each animal in Control and Prog-device groups was compared to the length of the respective contralateral uncut limb (specific length of the combined tibiofibula -a- and tarsus -b-) by using the formula LEN RATIO = (a’+b’)/(a+b) (Table S1).
Skeletal-element patterning: For each time point, pattern of residual (or intact ossified bone) and regenerated bone (mostly non-ossified cartilage, also referred as new bone) was assessed from X-ray images by using ImageJ. Length of non-ossified bone growth (BLEN) was measured as the maximal distance between amputation plane and the most distal plane set by the front of the bone growth. As new bone regrows from above the amputation plane, the total area occupied by non-ossified bone (BAREA) was chosen as integrative parameter for bone regeneration. At 7.5 mpa, the morphological reintegration of the non-mineralized cartilage respect to both remaining bone (tibiofibula) and soft tissue was characterized. To this, we evaluated the deviation angle (α) formed under the intersection between the middle line of the new bone growth and the middle line of the remaining bone (longitudinal axis of the tibiofibula). The geometric intersection between the middle line of the intact tibiofibula bone and the plane set by the base of the regenerate was taken for evaluating the bone displacement from the longitudinal axis to the medial edge of the soft tissue (d). Diagram and additional details of these measurements are given in Figure S3 and Table S1.
Next generation sequencing (NGS)
Sample preparation and Sequencing
Twenty-seven animals belonging, respectively, each group (Control, Sham and Prog-device; n = 9 per group) were used for RNA sequencing of blastema tissue. We performed three biological replicates (or surgery days) with three animals per condition. Twenty-four hours after treatment, animals were sacrificed and blastema (or proximal stump) tissue was removed and immediately frozen with liquid nitrogen. Total RNA for each sample was isolated by using TRIzol™ Reagent (Ambion, Invitrogen #15596018)– chloroform, following standard manufacturer’s protocol. Each sample was independently processed for total RNA extraction and purification. Before conducting NGS assays, RNAs from each condition and biological replicate were pooled. We analyzed 9 pooled samples in total: three biological replicates per three experimental conditions (each sample with RNA from three animals). NGS analyses were performed by The MIT BioMicro Center (Boston, MA). Samples were quality controlled on a Fragment Analyzer (Advanced Analytical) to determine DV200 scores. The mRNA from 1 µg of total RNA was isolated using Illumina human/mouse/ rat RiboZero Gold and prepared into Illumina libraries using the Kapa RNA HyperPrep kit and 10 cycles of amplification. Final libraries were pooled and quality controlled using qPCR (Roche LC480II) as well as the Fragment Analyzer and sequenced on HiSeq2000 for 40 nucleotides. Following sequencing, data processing was performed using the standard Illumina pipeline. Fastq files were generated for data processing and assembly. The accession number for the RNA-seq data reported in this paper is NCBI GEO: GSE118454.
The quality of the RNA-seq sequence data was first evaluated using FastQC (http://www.bioinformatics.babraham.ac.uk/projects/fastqc/) prior to further downstream analysis. Low quality sequences were trimmed and poor quality reads were removed using Trimmomatic (Bolger et al., 2014). Differential gene (DE) expression analysis was conducted using The Star Aligner (Dobin et al., 2013) to map high quality single end reads to the genome, X. laevis v9.2 and the gene annotation was downloaded from Xenbase (http://www.xenbase.org/entry/). Gene expression was obtained using RSEM (Li and Dewey, 2011). The expected read counts and Fragments Per Kilobase of transcript per Million mapped reads (FPKM), were extracted for further analysis. The estimated read counts were used as input for edgeR (Robinson et al., 2010) to perform DE analysis. A generalize linear regression model was developed to identify DE genes and the thresholds were set at FDR 0.05 and fold change of greater than 2 or less than 0.5. Three comparisons were performed (comparing Control, Sham, and Prog-Device among each other). Prior to the DE analysis, PCA was performed to identify outlier samples. No outlier samples were detected with this approach.
Pathway analysis
Sub-network enrichment analysis (SNEA) was performed in Pathway Studio 10.0 (Elsevier Life Science Solutions) and ResNet 11.0 for constructing gene interaction network for transcripts showing differential expression. The option of ‘‘best p value, highest magnitude fold change’’ in Pathway Studio was used for duplicated probes. Transcripts were successfully mapped using Name and Alias. SNEA was performed to identify gene networks that were significantly different in the treatment samples compared to control. A Kolmogorov–Smirnov test with 1000 permutations was conducted to determine whether specific networks were preferentially regulated compared to the background reference probability distribution. Networks were constructed based on common regulators of expression and regulators of specific cell processes. The enrichment P-value for a gene seed was set at p < 0.05.
Enzyme-linked immunosorbent assay (ELISA)
Eighteen animals belonging, respectively, to each group (Control, Sham and Prog-device; n = 6 per group) were used to measure Prog levels in proximal (blastema or proximal stump) and remote (distal stump, systemic blood and brain) tissues. We performed three biological replicates (or surgery days) with two animals per condition. Twenty-four hours after treatment, animals were sacrificed and blastema, brain and serum were harvested and frozen with liquid nitrogen. The detection and quantification of Prog levels was performed using the Invitrogen Progesterone Competitive ELISA kit (ThermoFisher Scientific, Invitrogen # EIAP4C21), following standard protocols on pooled samples of blastema, brain, and serum from each condition and biological replicate. We analyzed 27 samples in total: three biological replicates per three experimental conditions per three different tissues (each sample with tissue from two animals). Additionally, from each pooled sample we did three technical replicates or plate readings at 450 nm. The optical density of Prog at 450 nm of the standards and the samples were then used to create a 5-parameters logistic equation (curve-fitting analysis) in MATLAB. Data were analyzed by one-way ANOVA followed by Bonferroni’s post-tests.
Sample preparation
Samples were prepared and homogenized following standard protocols described by the manufacturer (https://tools.thermofisher.com/content/sfs/brochures/TR0065-ELISA-guide.pdf). For blastema samples, a 100 µg of pooled blastema samples from each respective experimental group were homogenized with incrementally 8 times the volume of cell extraction buffer with protease inhibitors (17 ul of 1mM PMSF and 500 ul of protease inhibitor cocktail per 5 mL) while being homogenized using a handheld homogenizer. These respective pooled homogenized samples were then occasionally vortexed while they were kept on ice for 30 minutes. The lysate was then clarified by centrifugation at 13,000 x g at 4C for 10 minutes. The supernatant was then transferred to a clean microcentrifuge tube. The total protein concentration was then determined using a protein Quant-iT kit (ThermoFisher Scientific, Invitrogen # Q33210) to determine the relative dilution to use for the ELISA analysis and to also verify that protein was extracted from the sample. The supernatant was stored at −80C for storage until ELISA was performed. For brain samples, A 100 µg of pooled brain samples from each respective experimental group were homogenized with incrementally 8 times the volume of 5 M guanidine-HCl in 50 mM Tris while being homogenized using a handheld homogenizer. These respective pooled homogenized samples were then mixed on an orbital shaker at room temperature for 3 hours. Then samples were then stored at −80C until the day they were used for the ELISA assay. Right before the ELISA assay was performed the samples were diluted ten-fold with cold PBS with 1X protease inhibitor cocktail and then centrifuged at 13,000 × g for 20 minutes at 4C and the supernatant was moved to a new tube. Additionally, blood samples were taken and processed according to standard protocols for serum extraction. To this, the blood was collected into respective test tubes and allowed to clot by leaving it undisturbed at room temperature for 15–30 minutes. The samples were then centrifuged at 1000–2000 × g for 10 minutes in a refrigerated centrifuge. The resultant supernatant/serum was immediately transferred into a clean polypropylene tube using a Pasteur pipette. The samples were stored at −20C until ready for ELISA assay.
Quantification of Prog levels
The Invitrogen Progesterone Competitive ELISA kit (ThermoFisher Scientific, Invitrogen # EIAP4C21) was used to analyze the concentration of Prog in pooled samples. The protocol was followed using procedural guidelines. The standards were diluted to consist of the following concentrations of Prog: Std1 = 3,200 pg/mL, Std2 = 1,600 pg/mL, Std3 = 800 pg/mL, Std4 = 400 pg/mL, Std5 = 200 pg/mL, Std6 = 100 pg/mL, Std7 = 50 pg/mL, and Std8 = 0 pg/mL. All the pooled samples were diluted 1:30 (the Prog samples were also diluted incrementally up to the highest recommended dilution) with the same assay buffer that the standards were diluted with. Four wells were designated to be blanks to holds as a control for the plate and four wells were designated for the non-specific binding (NSB) negative control. The antigen was bound by first pipetting 50 ul of standards or samples into the appropriate wells and 75 ul of 1X assay buffer into the wells for detecting NSB. Then adding 25 ul of Prog conjugate into each well except for the blank wells. Then adding 25 ul of Prog antibody to each well except for the blank wells and NSB wells. The side of the plate was tapped to mix the plate. The plate was covered with the plate sealer and incubated at room temperature for 2 hours with shaking. The solution was thoroughly aspirated and then 300 ul of 1x wash buffer was added to each well and this was repeated a total of four times. Chromatogen was added to the samples, where 100 ul TMB substrate was added and then plate incubated at room temperature for 30 minutes without shaking. The ELISA assay was ended by adding 50 ul stop solution to each well and the side of the plate was tapped to gently mix. Within ten minutes of adding the stop solution to each well, the plate was read in three replicates at 450 nm by a plate reader using SoftMaxPro software in which the optical density at 450 nm was recorded.
Data Analysis
The optical density of Prog at 450 nm of the standards and the samples were then used to create a 5-parameters logistic equation in MATLAB to accordingly determine the concentration of Prog for each respective pooled sample. The 5-parameters logistic regression is a typical method for curve-fitting analysis in assays such as ELISAs. The averages across replicates and reads were then taken and the background of NSB was subtracted from the samples and the standards. The standards were used to create the 5-parameter logistic regression (non-linear curve) and the samples were matched to this 5-parameters logistic curve using MATLAB in order for the values of the Prog concentration to be generated. The dilution factor was implemented (which was 30), the average was taken, and the standard deviation per group was calculated. The average of the standard deviation of the standards was scaled and factored into each respective value and added to the final standard deviation per sample. The One-Way Anova was performed on the data by using Prism to calculate the P- and F-values.
Immunofluorescence and Histology
At early stages of regeneration (0.5 and 3 mpa), animals were deeply anesthetized with benzocaine overdose (0.2%) and buds were removed for histological analysis. Additionally, tips of regenerates from 9.5-mpa animals and uncut or intact limbs were removed and sectioned for late-stage histological evaluation (Figure S5 for schematic representations). Samples were fixed overnight in a MEMFA fixative (1 part MEM salts, 1 part formaldehyde and 8 parts deionized water) at 4 C and carefully processed for cryostat sectioning. Briefly, after fixation, the bone was decalcified for two days in an EDTA based solution (0.4 M, pH 7.3). Once decalcified, tissues were gradually equilibrated up to 30% sucrose before embedding in OTC media and flash freezing in liquid Nitrogen. Limbs were serially sectioned at 14 μm onto glass slides, both at longitudinal and transversal axis, using a Leica CM1800 cryostat. Samples for immunohistological analysis were washed in phosphate-buffered saline (PBS) and then incubated for 30 min in PBS-Tr (PBS with 0.01% Triton X-100; Sigma). Slides were then incubated in blocking solution (PBS-Tr with 1% BSA and 10% Goat Serum) for 45 minutes. After blocking, samples were incubated in primary antibodies diluted in blocking solution overnight. Spatial patterns of proliferative cells, leukocytes, nerve fibers and vascular smooth muscle cells were detected by immunofluorescence for anti-phospho-Histone H3 (Ser10) (Tseng et al., 2007) (H3P at 1:1000; EMD Millipore 06–570), anti-XL2 (Miyanaga et al., 1998) (XL2 at 1:1000; provided as a generous gift from Makoto Asashima’s lab at Tokyo University), anti-acetylated alpha tubulin (Chu and Klym-kowsky, 1989) (Tub at 1:1000; Sigma T7451), and anti-alpha smooth muscle alpha-actin (Di Rosa et al., 1995) (SMA at 1:100; Sigma A2547) primary antibodies, respectively. Slides were washed in PBS and secondary antibodies (Alexa Fluor dye conjugated goat anti-mouse, or goat anti-rabbit, antibodies; Invitrogen) were used at 1:500 dilution. Slides were counterstained with DAPI before VectaShield mounting media. Particular care was taken to ensure that samples from the two different experimental groups were processed in the same batch at the same immunofluorescence session. Hematoxylin & Eosin (H&E) stain was done according to standard protocols (Suvarna et al., 2013). Immunofluorescence sections were imaged on an Olympus BX-61 microscope equipped with a Hamamatsu ORCA AG CCD camera, and controlled by Metamorph software.
Additionally, expression of Prog Receptor (PR) on frog limbs was revealed by a hormone assay employing a fluorescent ligand of PR (Gaetjens and Pertschuk, 1980; Weinstain et al., 2013) (Prog 3-(O-carboxymethyl)oxime:BSA-fluorescein isothiocyanate conjugate; PFITC, Sigma P8779). 14-μm thick frozen sections of intact (uncut) frog limb were incubated in 50 μM of PFITC ligand diluted in PBS, pH 7.3. After 2 h, sections were rinsed in buffer and counterstained with DAPI before VectaShield mounting media and confocal imaging. Specificity of the ligand was determined by concurrent competitive binding studies consisted of parallel sections co-incubated with 50 μM of PFITC plus a 200–500 fold excess molar concentration of water-soluble Prog (15 μM; physiological agonist for PR; Sigma P7556) or the steroid Hydrocortisone (15 μM; agonist for Glucocorticoid Receptor but not for PR; Sigma H0888) on adjacent limb sections.
Stock solution of PFITC was prepared by dissolving the compound in Millipore water (to a final concentration of 500 μM). Further dilution was made in normal media (PBS 0.1 M, pH 7.3). Optimal working concentration of PFITC was determined by screening with different concentrations (0.5 μM, 10 μM and 50 μM). Additional control experiments were performed using 14-μm frozen sections of Xenopus oocytes at different stages (IV-VI), known to be PR-positive (Bayaa et al., 2000; Tian et al., 2000).
Cellular and Morphological Evaluation
0.5 mpa: Wound-healing stage. Quantification of H3P and XL2 was performed by analyzing 10x images, using ImageJ threshold and count positive cells. For XL2 measurements, two different regions were counted separately: proximal or distal respect to the amputation plane. Special care was taken in defining areas of the same size and anatomical characteristics. The total area between amputation plane and WE was split in four regions or quarters, along the anteroposterior axis. Proximal was considered the first quarter, immediately close to the amputation plane. Distal was considered as the area occupied by the following third quarters, or blastema core.
3 mpa: Bud-outgrowth stage. Images of H3P-, SMA- and Tub- immunofluorescence longitudinal sections (see Figure S5A for schematic representation) were taken at the same magnification, had the same brightness and contrast settings and were all transformed to 8-bit images for analysis, using ImageJ software. The number of H3P-positive cells was counted along the longitudinal view, from the amputation plane to the bud edge, on three different sections per animal, corresponding to three different dorsoventral levels. To obtain the H3P labeling index (%), we normalized the number of H3P-labeled cells to the total number of cells in each section (quantified after DAPI staining on parallel sections), following the formulae: H3P+ cells/DAPI+ cells*100. For SMA and Tub counts, a blank mask of each longitudinal section was created. Individual signals from each image were hand traced and copied onto the blank mask. Once all the signals were fitted onto the mask, a program on ImageJ was run to fit ellipses around each tracing and take measurements. For Tub, we quantified the area of each bundle or group of axons. For SMA, we quantified the area of each SMA-positive vessel. For all the measurements, only internal regenerate area, or core blastema-like, was considered, excluding epidermis from the counts.
9.5 mpa: End-point stage. Each 9.5-mpa tip was sampled using a systematic procedure in order to quantify the number and area of Tub-positive or SMA-positive units at different anatomical levels, along the proximodistal axis, on cross sections (see Figure S5A for schematic representation). The number total of Tub-positive or SMA-positive fibers or cells was normalized to the size of the tissue section. Per each animal, at least three different sections corresponding to three different levels of the sample, were measured. Then, on 10x images, a grid was superimposed to guide the random sampling of area for bundle or group of axons and the area of each SMA-positive vessel.
Special care was done to ensure comparison of sections at the same dorso-ventral (for longitudinal sections) or proximo-distal (for transverse sections) level across control and experimental animals. All samples ere carefully aligned, registered with respect to amputation plane relative to the joint, and embedded in the OCT in the same orientation and cryosectioned, to obtain six parallel series with the whole sample represented. Using a systematic labeling, parallel sections of controlled locations along the whole limb or regenerate can be analyzed to compare the different markers between experimental groups (confirmed by the fact that the organization/pattern of the innervation showed very little detectable variation across the control animal sections, indicating a consistency in the positional sampling procedure itself). All individuals among whom comparisons are being made were produced in the same batch, treated identically for processing and imaging – conditions were not changed.
Regeneration Index
A composite Regeneration Index (RI) was designed for scoring of regenerative limb phenotype, ranging from 0 (typical hypomorphic spike) to 10 (patterned paddle-like regenerates). The RI scoring system uses a 10-point scale, to evaluate six individual criteria on soft tissue (shape and macroscopic descriptors), bone growth, and functional response of the regenerates. Rating for each factor is bimodal, either 1 or 0, in function of quantitative (numerical threshold) or qualitative (presence/absence) description. We applied the RI to animals in both experimental groups at two different time points, early and late stages, after amputation (2.5 and 9.5 mpa, respectively; Tables S3 and S4).
The final RI is a weighted combination of six individual criteria, following the formulae:
The criterion scores (xi) and their values are:
Percentage of width change (WID, x1, Figure S2A for diagram): 0 if x1 is 50%–100%, 1 if x1 is 50%–100%
Percentage of unpigmented area (UNA, x2, Figure S2A for diagram): This criterion is categorized (numerical threshold) differently depending on timing after amputation because of its natural difference, at the same magnitude order for both control and experimental groups, over the course of the regeneration (see Results sections). Values for x2(2.5) are 0 if x2(2.5) is 0%–30%, 1 if x2(2.5) is 30%–100%. Values for x2(9.5) are 0 if x2(9.5) is 0%–10%, 1 if x2(9.5) is 10%–100%.
Maximal width of the regenerate is greater than or equal to width of the amputation plane (MaxWID ≥ W1, x3): 0 if x3 is no, 1 if x3 is yes.
Curvature of the tip (CURVE at tip, x4, deviation from the reference middle axis, Figure S2B for diagram): values are 0 for presence and 1 for absence of curvature at the tip of the regenerate.
Area occupied by new bone growth (BAREA, x5, Figure S3A for diagram): This criterion is categorized differently depending on timing after amputation to reveal key biological events. At 2.5 mpa, x5(2.5), the RI scores the presence/absence of non-ossified bone growth from above the amputation plane or endogenous second amputation (as described for digit tip regeneration in mice by Muneoka’s group (Fernando et al., 2011); red asterisk in Figure S3A). Values for x5(2.5) are 0 for absence and 1 for pres-ence of second amputation. At 9.5 mpa, x5(9.5), the RI scores the absolute area occupied by new bone: 0 if x5(9.5) is less than or equal to 30 μm2, 1 if x5(9.5) is greater than or equal 30 μm2.
Mechanosensitive adaptation (ADPT, x6; Table S1) values are 0 if x6 is no, 1 if x6 is yes. This neurophysiological response is measured as presence/absence of response motor to one touch stimulus applied 30 s after the first one. Both stimuli were applied with toothless-smooth tip forceps in the same direction and with the same weak pressure. The adaptive behavior indicates presence of complex nerve endings (with rapidly adapting afferents) formed in the regenerate, which are able to integrate sensorial information rather than reflex responses to mechanical (non-noxious) stimuli (Lumpkin et al., 2010; Mearow and Diamond, 1988; Scott et al., 1981).
The components of the RI were chosen with the goal of reflecting the overall improvement in regeneration. Considering the large number of parameters evaluated in this study (anatomical, histological, behavioral etc.), we chose those that better represented each modality. We chose three anatomical parameters (x1, x2, x3) related to width and epithelium of the regenerate; one shape parameter (x4) describing the end of the regenerate; one about bone remodeling (x5; bone area is more indicative that length because measuring ‘area’ we are also evaluating other biological events, like secondary amputation); and one about functionality (x6), adaptation, that, in turn indicate presence of elaborated neural responses in the regenerated. Each component is given an individual weighting, with higher weights going toward metrics that are relevant to the main developmental sequence that produces a usable limb.
Effective Swimming Evaluation
At 7.5 mpa, videos of individual Uncut, untreated-cut (Control) and Prog-device treated animals were recorded and analyzed for active behavior and functional use of the regenerate. One animal at a time was placed in a fresh-water tank (to avoid potential noise from other animals or food) and allowed to swim freely while a camera mounted on a tripod recorded them for 3 minutes (min). We evaluated three parameters of effective swimming per 3-min interval: i) activity level for each group was measured by counting the number of active movements (with trajectory displacement; MOV, Table S1); ii) frequency of surfacing or number of visits to the interface water-air of the tank, and iii) percentage of time frog spent in each quadrant of the tank. Additionally, functionalization of the regenerate was analyzed by means of i) the speed at which the animal swims, and ii) positional information (POS; Table S1) of the regenerate at passive and active movements. Speed was evaluated by using Tracker software (https://physlets.org/tracker/). A one-inch measured engraving on the bottom of the tub was used as calibration stick for the videos, in order to have a reference measurement to know the speed traveled per coordinate movements that were tracked. Every single frame was used to track to increase the accuracy of the measurements. Continuous velocity data points per each ~3 minute video were obtained as final data. To extract positional information, videos were split into frames via QuickTime 7 and ten random frames per animal and per movement were used.
QUANTIFICATION AND STATISTICAL ANALYSIS
All statistical analysis was performed using GraphPad Prism (GraphPad Software, Inc., CA, US). First, data were tested for homogeneity of variances by Bartlett’s test. In case of equal variances, unifactorial (or one-variable) analysis was analyzed by unpaired and two-tailed Student’s t test (two independent groups), or one-way ANOVA test (multiple independent groups) followed by post hoc Bonferroni test (when p < 0.05). When variable ‘‘time’’ was considered, a bifactorial analysis was performed by two-way ANOVA. Statistically significant differences for Ctrl and Prog-device groups at each specific time point were determined by using unpaired and non-directional Student’s t test. In case of unequal variances (or non-normal distributions), two-tailed Mann-Whitney and Kruskal-Wallis test followed by pot-hoc Dunn test (when p < 0.05), respectively, were used. Statistical details of each experiment (test used, value of n, replicates, etc) can be found in the Results and Figure-Figure Legend sections. The significance level (α) was set to 0.05 in all cases. The statistical values are reported as mean ± Standard Deviation (SD). When appropriate, dot or scatterplots are used for highlighting the inter-individual variability within each experimental group.
Supplementary Material
Highlights.
Adult Xenopus laevis frogs are capable of induced increased regenerative response
Improved limb regeneration is driven by a wearable bioreactor containing progesterone
Improvements occur at molecular, anatomical, and behavioral (functional) levels
A 24-hr treatment is sufficient to trigger many months of regenerative growth
ACKNOWLEDGMENTS
We thank Erin Switzer for Xenopus husbandry, Rakela Colon for general laboratory assistance, Gufa Lin for advice on histological processing, and Nirosha Murugan and other members of the Levin and Kaplan laboratories for helpful comments. We gratefully acknowledge Joshua Finkelstein for support and helpful discussions. We also thank Tongjun Gu at the University of Florida Interdisciplinary Center for Biotechnology Research (ICBR) Bioinformatics for RNA sequence annotation. This research was supported by the Allen Discovery Center program through The Paul G. Allen Frontiers Group (12171). We also gratefully acknowledge support from the NIH (R01 AR005593 and R01 AR061988) and the W.M. Keck Foundation (5903).
Footnotes
DECLARATION OF INTERESTS
The authors declare no competing interests.
DATA AND SOFTWARE AVAILABILITY
Data Resources
The accession number for the RNA-seq data reported in this paper is NCBI GEO: GSE118454.
REFERENCES
- Adams DS, Masi A, and Levin M (2007). H+ pump-dependent changes in membrane voltage are an early mechanism necessary and sufficient to induce Xenopus tail regeneration. Development 134, 1323–1335. [DOI] [PubMed] [Google Scholar]
- Adams DS, Tseng AS, and Levin M (2013). Light-activation of the Archaerhodopsin H(+)-pump reverses age-dependent loss of vertebrate regeneration: sparking system-level controls in vivo. Biol. Open 2, 306–313. [DOI] [PMC free article] [PubMed] [Google Scholar]
- Archard GA (2012). Effect of enrichment on the behaviour and growth of juvenile Xenopus laevis. Appl. Anim. Behav. Sci 139, 264–270. [Google Scholar]
- Bayaa M, Booth RA, Sheng Y, and Liu XJ (2000). The classical progesterone receptor mediates Xenopus oocyte maturation through a nongenomic mechanism. Proc. Natl. Acad. Sci. USA 97, 12607–12612. [DOI] [PMC free article] [PubMed] [Google Scholar]
- Bolger AM, Lohse M, and Usadel B (2014). Trimmomatic: a flexible trimmer for Illumina sequence data. Bioinformatics 30, 2114–2120. [DOI] [PMC free article] [PubMed] [Google Scholar]
- Brockes JP, and Kumar A (2008). Comparative aspects of animal regeneration. Annu. Rev. Cell Dev. Biol 24, 525–549. [DOI] [PubMed] [Google Scholar]
- Burghardt GM (2013). Environmental enrichment and cognitive complexity in reptiles and amphibians: concepts, review, and implications for captive populations. Appl. Anim. Behav. Sci 147, 286–298. [Google Scholar]
- Chávez-Delgado ME, Mora-Galindo J, Gomez-Pinedo U, Feria-Velasco A, Castro-Castaneda S, Lopez-Dellamary Toral FA, Luquin-De Anda S, Garcia-Segura LM, and Garcia-Estrada J (2003). Facial nerve regeneration through progesterone-loaded chitosan prosthesis. A preliminary report. J. Biomed. Mater. Res. B Appl. Biomater 67, 702–711. [DOI] [PubMed] [Google Scholar]
- Chernet BT, and Levin M (2014). Transmembrane voltage potential of somatic cells controls oncogene-mediated tumorigenesis at long-range. Oncotarget 5, 3287–3306. [DOI] [PMC free article] [PubMed] [Google Scholar]
- Chernet BT, Fields C, and Levin M (2015). Long-range gap junctional signaling controls oncogene-mediated tumorigenesis in Xenopus laevis embryos. Front. Physiol 5, 519. [DOI] [PMC free article] [PubMed] [Google Scholar]
- Chu DT, and Klymkowsky MW (1989). The appearance of acetylated alpha-tubulin during early development and cellular differentiation in Xenopus. Dev. Biol 136, 104–117. [DOI] [PubMed] [Google Scholar]
- Dent JN (1962). Limb regeneration in larvae and metamorphosing individuals of the South African clawed toad. J. Morphol 110, 61–77. [DOI] [PubMed] [Google Scholar]
- Di Rosa I, Panara F, Fagotti A, Simoncelli F, Chaponnier C, Gabbiani G, and Pascolini R (1995). Expression of alpha SM actin in terrestrial ectothermic vertebrates. Cell Tissue Res 281, 501–505. [DOI] [PubMed] [Google Scholar]
- Dobin A, Davis CA, Schlesinger F, Drenkow J, Zaleski C, Jha S, Batut P, Chaisson M, and Gingeras TR (2013). STAR: ultrafast universal RNA-seq aligner. Bioinformatics 29, 15–21. [DOI] [PMC free article] [PubMed] [Google Scholar]
- Fernando WA, Leininger E, Simkin J, Li N, Malcom CA, Sathyamoorthi S, Han M, and Muneoka K (2011). Wound healing and blastema formation in regenerating digit tips of adult mice. Dev. Biol 350, 301–310. [DOI] [PMC free article] [PubMed] [Google Scholar]
- Gaetjens E, and Pertschuk LP (1980). Synthesis of fluorescein labelled steroid hormone-albumin conjugates for the fluorescent histochemical detection of hormone receptors. J. Steroid Biochem 13, 1001–1003. [DOI] [PubMed] [Google Scholar]
- Golding A, Guay JA, Herrera-Rincon C, Levin M, and Kaplan DL (2016). A tunable silk hydrogel device for studying limb regeneration in adult Xenopus laevis. PLoS One 11, e0155618. [DOI] [PMC free article] [PubMed] [Google Scholar]
- Grimm SL, Hartig SM, and Edwards DP (2016). Progesterone receptor signaling mechanisms. J. Mol. Biol 428, 3831–3849. [DOI] [PubMed] [Google Scholar]
- Hechavarria D, Dewilde A, Braunhut S, Levin M, and Kaplan DL (2010). BioDome regenerative sleeve for biochemical and biophysical stimulation of tissue regeneration. Med. Eng. Phys 32, 1065–1073. [DOI] [PMC free article] [PubMed] [Google Scholar]
- Hennighausen L, and Robinson GW (2001). Signaling pathways in mammary gland development. Dev. Cell 1, 467–475. [DOI] [PubMed] [Google Scholar]
- Herrera-Rincon CGJ, and Levin M (2016). Bioelectrical coordination of cell activity toward anatomical target states: an engineering perspective on regeneration. In Regenerative Engineering and Developmental Biology: Principles and Applications, Gardiner D, ed. (CRC Press; ). [Google Scholar]
- Herrera-Rincon C, Pai VP, Moran KM, Lemire JM, and Levin M (2017). The brain is required for normal muscle and nerve patterning during early Xenopus development. Nat. Commun 8, 587. [DOI] [PMC free article] [PubMed] [Google Scholar]
- Holmes AM, Emmans CJ, Jones N, Coleman R, Smith TE, and Hosie CA (2016). Impact of tank background on the welfare of the African clawed frog, Xenopus laevis (Daudin). Appl. Anim. Behav. Sci 185, 131–136. [Google Scholar]
- Ihmied YM, and Taylor EW (1995). Effect of temperature on surfacing behaviour in Xenopus laevis. J. Therm. Biol 20, 49–53. [Google Scholar]
- Kawakami Y, Rodriguez Esteban C, Raya M, Kawakami H, Marti M, Dubova I, and Izpisua Belmonte JC (2006). Wnt/beta-catenin signaling regulates vertebrate limb regeneration. Genes Dev 20, 3232–3237. [DOI] [PMC free article] [PubMed] [Google Scholar]
- Klingenberg CP (2011). MorphoJ: an integrated software package for geometric morphometrics. Mol. Ecol. Resour 11, 353–357. [DOI] [PubMed] [Google Scholar]
- Koenig HL, Gong WH, and Pelissier P (2000). Role of progesterone in peripheral nerve repair. Rev. Reprod 5, 189–199. [DOI] [PubMed] [Google Scholar]
- Kumar A, and Brockes JP (2012). Nerve dependence in tissue, organ, and appendage regeneration. Trends Neurosci 35, 691–699. [DOI] [PubMed] [Google Scholar]
- Leppik LP, Froemel D, Slavici A, Ovadia ZN, Hudak L, Henrich D, Marzi I, and Barker JH (2015). Effects of electrical stimulation on rat limb regeneration, a new look at an old model. Sci. Rep 5, 18353. [DOI] [PMC free article] [PubMed] [Google Scholar]
- Levin M (2007). Large-scale biophysics: ion flows and regeneration. Trends Cell Biol 17, 261–270. [DOI] [PubMed] [Google Scholar]
- Levin M (2011). Endogenous bioelectric signals as morphogenetic controls of development, regeneration, and neoplasm. In The Physiology of Bioelectricity in Development, Tissue Regeneration and Cancer, Pullar CE, ed. (CRC Press; ), pp. 39–89. [Google Scholar]
- Levin M (2014). Molecular bioelectricity: how endogenous voltage potentials control cell behavior and instruct pattern regulation in vivo. Mol. Biol. Cell 25, 3835–3850. [DOI] [PMC free article] [PubMed] [Google Scholar]
- Li B, and Dewey CN (2011). RSEM: accurate transcript quantification from RNA-seq data with or without a reference genome. BMC Bioinformatics 12, 323. [DOI] [PMC free article] [PubMed] [Google Scholar]
- Lobikin M, Pare´ JF, Kaplan DL, and Levin M (2015). Selective depolarization of transmembrane potential alters muscle patterning and muscle cell localization in Xenopus laevis embryos. Int. J. Dev. Biol 59, 303–311. [DOI] [PMC free article] [PubMed] [Google Scholar]
- Lumpkin EA, Marshall KL, and Nelson AM (2010). The cell biology of touch. J. Cell Biol 191, 237–248. [DOI] [PMC free article] [PubMed] [Google Scholar]
- Luoma JI, Stern CM, and Mermelstein PG (2012). Progesterone inhibition of neuronal calcium signaling underlies aspects of progesterone-mediated neuroprotection. J. Steroid Biochem. Mol. Biol 131, 30–36. [DOI] [PMC free article] [PubMed] [Google Scholar]
- Martinez S, Grandy R, Pasten P, Montecinos H, Montecino M, Olate J, and Hinrichs MV (2006). Plasma membrane destination of the classical Xenopus laevis progesterone receptor accelerates progesterone-induced oocyte maturation. J. Cell. Biochem 99, 853–859. [DOI] [PubMed] [Google Scholar]
- McEwen BS (1991). Non-genomic and genomic effects of steroids on neural activity. Trends Pharmacol. Sci 12, 141–147. [DOI] [PubMed] [Google Scholar]
- McLaughlin KA, and Levin M (2018). Bioelectric signaling in regeneration: mechanisms of ionic controls of growth and form. Dev. Biol 433, 177–189. [DOI] [PMC free article] [PubMed] [Google Scholar]
- Mearow KM, and Diamond J (1988). Merkel cells and the mechanosensitivity of normal and regenerating nerves in Xenopus skin. Neuroscience 26, 695–708. [DOI] [PubMed] [Google Scholar]
- Miura S, Hanaoka K, and Togashi S (2008). Skeletogenesis in Xenopus tropicalis: characteristic bone development in an anuran amphibian. Bone 43, 901–909. [DOI] [PubMed] [Google Scholar]
- Miyanaga Y, Shiurba R, Nagata S, Pfeiffer CJ, and Asashima M (1998). Induction of blood cells in Xenopus embryo explants. Dev. Genes Evol 207, 417–426. [DOI] [PubMed] [Google Scholar]
- Mondia JP, Levin M, Omenetto FG, Orendorff RD, Branch MR, and Adams DS (2011). Long-distance signals are required for morphogenesis of the regenerating Xenopus tadpole tail, as shown by femtosecond-laser ablation. PLoS One 6, e24953. [DOI] [PMC free article] [PubMed] [Google Scholar]
- Nakada Y, Canseco DC, Thet S, Abdisalaam S, Asaithamby A, Santos CX, Shah AM, Zhang H, Faber JE, Kinter MT, et al. (2017). Hypoxia induces heart regeneration in adult mice. Nature 541, 222–227. [DOI] [PubMed] [Google Scholar]
- Pai VP, Lemire JM, Chen Y, Lin G, and Levin M (2015). Local and long-range endogenous resting potential gradients antagonistically regulate apoptosis and proliferation in the embryonic CNS. Int. J. Dev. Biol 59, 327–340. [DOI] [PMC free article] [PubMed] [Google Scholar]
- Patrat C, Serres C, and Jouannet P (2002). Progesterone induces hyperpolarization after a transient depolarization phase in human spermatozoa. Biol. Reprod 66, 1775–1780. [DOI] [PubMed] [Google Scholar]
- Robinson MD, McCarthy DJ, and Smyth GK (2010). edgeR: a Bioconductor package for differential expression analysis of digital gene expression data. Bioinformatics 26, 139–140. [DOI] [PMC free article] [PubMed] [Google Scholar]
- Rodgers JT, Schroeder MD, Ma C, and Rando TA (2017). HGFA is an injury-regulated systemic factor that induces the transition of stem cells into GAlert. Cell Rep 19, 479–486. [DOI] [PMC free article] [PubMed] [Google Scholar]
- Rosales-Cortes M, Peregrina-Sandoval J, Banuelos-Pineda J, Castellanos-Martinez EE, Gomez-Pinedo UA, and Albarran-Rodriguez E (2003). [Regeneration of the axotomised sciatic nerve in dogs using the tubulisation technique with Chitosan biomaterial preloaded with progesterone]. Rev. Neurol 36, 1137–1141. [PubMed] [Google Scholar]
- Routley CE, and Ashcroft GS (2009). Effect of estrogen and progesterone on macrophage activation during wound healing. Wound Repair Regen 17, 42–50. [DOI] [PubMed] [Google Scholar]
- Sammarco MC, Simkin J, Cammack AJ, Fassler D, Gossmann A, Marrero L, Lacey M, Van Meter K, and Muneoka K (2015). Hyperbaric oxygen promotes proximal bone regeneration and organized collagen composition during digit regeneration. PLoS One 10, e0140156. [DOI] [PMC free article] [PubMed] [Google Scholar]
- Scott SA, Cooper E, and Diamond J (1981). Merkel cells as targets of the mechanosensory nerves in salamander skin. Proc. R. Soc. Lond. B Biol. Sci 211, 455–470. [DOI] [PubMed] [Google Scholar]
- Sessions SK, and Bryant SV (1988). Evidence that regenerative ability is an intrinsic property of limb cells in Xenopus. J. Exp. Zool 247, 39–44. [DOI] [PubMed] [Google Scholar]
- Singer M (1952). The influence of the nerve in regeneration of the amphibian extremity. Q. Rev. Biol 27, 169–200. [DOI] [PubMed] [Google Scholar]
- Suvarna SK, Layton C, and Bancroft JD (2013). Bancroft’s Theory and Practice of Histological Techniques, 7th ed. (Churchill Livingstone Elsevier; ). [Google Scholar]
- Tanaka EM, and Reddien PW (2011). The cellular basis for animal regeneration. Dev. Cell 21, 172–185. [DOI] [PMC free article] [PubMed] [Google Scholar]
- Tassava RA, and Olsen CL (1982). Higher vertebrates do not regenerate digits and legs because the wound epidermis is not functional. A hypothesis. Differentiation 22, 151–155. [DOI] [PubMed] [Google Scholar]
- Tian J, Kim S, Heilig E, and Ruderman JV (2000). Identification of XPR-1, a progesterone receptor required for Xenopus oocyte activation. Proc. Natl. Acad. Sci. USA 97, 14358–14363. [DOI] [PMC free article] [PubMed] [Google Scholar]
- Tschumi PA (1957). The growth of the hindlimb bud of Xenopus laevis and its dependence upon the epidermis. J. Anat 91, 149–173. [PMC free article] [PubMed] [Google Scholar]
- Tseng A, and Levin M (2013). Cracking the bioelectric code: probing endogenous ionic controls of pattern formation. Commun. Integr. Biol 6, e22595. [DOI] [PMC free article] [PubMed] [Google Scholar]
- Tseng A-S, Adams DS, Qiu D, Koustubhan P, and Levin M (2007). Apoptosis is required during early stages of tail regeneration in Xenopus laevis. Dev. Biol 301, 62–69. [DOI] [PMC free article] [PubMed] [Google Scholar]
- Tseng AS, Beane WS, Lemire JM, Masi A, and Levin M (2010). Induction of vertebrate regeneration by a transient sodium current. J. Neurosci 30, 13192–13200. [DOI] [PMC free article] [PubMed] [Google Scholar]
- Tsutsumi R, Inoue T, Yamada S, and Agata K (2015). Reintegration of the regenerated and the remaining tissues during joint regeneration in the newt Cynops pyrrhogaster. Regeneration 2, 26–36. [DOI] [PMC free article] [PubMed] [Google Scholar]
- Udagawa N, Takahashi N, Akatsu T, Tanaka H, Sasaki T, Nishihara T, Koga T, Martin TJ, and Suda T (1990). Origin of osteoclasts: mature monocytes and macrophages are capable of differentiating into osteoclasts under a suitable microenvironment prepared by bone marrow-derived stromal cells. Proc. Natl. Acad. Sci. USA 87, 7260–7264. [DOI] [PMC free article] [PubMed] [Google Scholar]
- Weinstain R, Kanter J, Friedman B, Ellies LG, Baker ME, and Tsien RY (2013). Fluorescent ligand for human progesterone receptor imaging in live cells. Bioconjug. Chem 24, 766–771. [DOI] [PMC free article] [PubMed] [Google Scholar]
- Young HE, Bailey CF, Markwald RR, and Dalley BK (1985). Histological analysis of limb regeneration in postmetamorphic adult Ambystoma. Anat. Rec 212, 183–194. [DOI] [PubMed] [Google Scholar]
- Ziegler-Graham K, MacKenzie EJ, Ephraim PL, Travison TG, and Brookmeyer R (2008). Estimating the prevalence of limb loss in the United States: 2005 to 2050. Arch. Phys. Med. Rehabil 89, 422–429. [DOI] [PubMed] [Google Scholar]
Associated Data
This section collects any data citations, data availability statements, or supplementary materials included in this article.