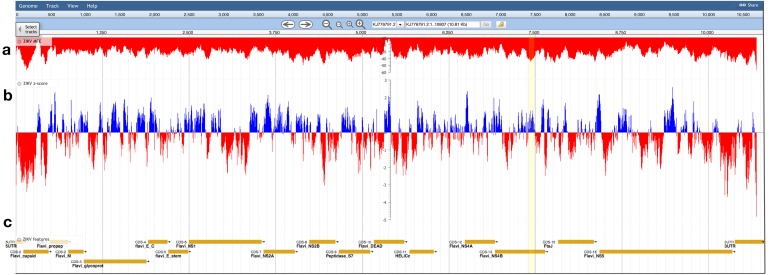
Figure 3. Bioinformatics scans of the ZIKV genome.
(A) The predicted minimum folding free energy (MFE) and (B) z-score for all RNA window segments; red and blue colors indicate negative and positive values, respectively. Each bar is set at the first nt of the analysis window. The most striking region where a low MFE ΔG did not correlate with a negative z-score is highlighted in yellow. (C) Genome feature annotations are shown; the polyprotein region has been broken down for visualization of individual coding sequence regions. All data was visualized, archived, and is available for browsing/download on the RNAStructuromeDB https://structurome.bb.iastate.edu/.

