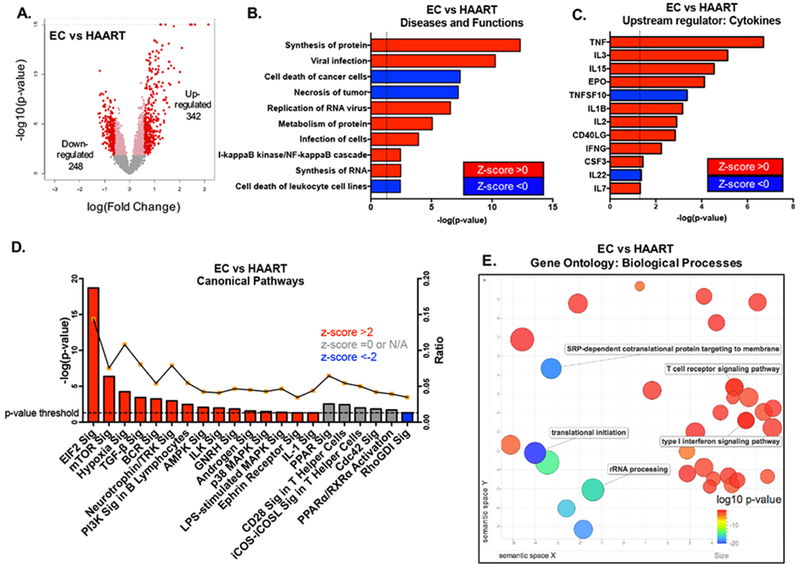
Figure 2: Differential metabolic programs characterize transcriptional profiles of CD8+ T cells from EC.

(A) Volcano plot of differentially expressed genes between CD8+ T cells from EC and HAART-treated patients (FDR-adjusted p<0.05, fold change >1.5). (B) Predicted biological functions of genes differentially expressed between EC and HAART-treated patients, as determined using Ingenuity Pathway Analysis (IPA). Dotted line depicts the threshold -log(p-value) of 1.3 or p-value≤0.05. Z-scores reflect predicted directional changes of genes function, positive z-score corresponds to functional activation while negative z-score reflects functional de-activation. (C) Upstream cytokines predicted to account for transcriptional differences between EC vs HAART-treated patients. Dotted line depicts the threshold -log(p-value) of 1.3 or p-value≤0.05. (D) Canonical pathways enriched in differentially regulated genes between EC and HAART, as determined using IPA. The right y-axis reflects the ratio between the number of differentially expressed genes that map to a particular pathway divided by the total number of genes curated to that pathway. Dotted line depicts the threshold -log(p-value) of 1.3 or p-value≤0.05. (E) Gene ontology (GO) analysis of the 590 differentially expressed transcripts between EC and HAART samples. The REVIGO plot reflects clustering of semantic similarities between the biological GO terms and is color coded according to log10(p-value) of the GO term as determined using DAVID analysis of the identified genes within the list of 590 transcripts.
