Abstract
Several studies have shown an important role for long non‐coding RNA (lncRNA) in breast cancer progression. The present study investigated the role of lncRNA Opa interacting protein 5‐antisense RNA 1 (OIP5‐AS1) in the progression of breast cancer. OIP5‐AS1 was significantly upregulated in breast cancer tissues and in breast cancer cell lines, and OIP5‐AS1 downregulation inhibited the malignant behavior of breast cancer in vitro and in vivo. For in‐depth exploration of the mechanism of OIP5‐AS1 in breast cancer, we found that expression of microRNA‐129‐5p(miR‐129‐5p), which was found to bind sites in the sequence of OIP5‐AS1, in breast cancer tissues was negatively correlated with OIP5‐AS1. Also, luciferase assays indicated that OIP5‐AS1 acted as a miR‐129‐5p sponge, resulting in upregulated expression of the sex‐determining region Y‐box 2 (SOX2) transcription factor. Our study showed that OIP5‐AS1 plays a critical role in promoting breast cancer progression and that OIP5‐AS1 downregulation targets SOX2 by miR‐129‐5p upregulation.
Keywords: breast cancer, ceRNA, lncRNA, malignant phenotype, miR‐129‐5p
Abbreviations
- BC
breast cancer
- ceRNA
competing endogenous RNA
- Coi
negative control for miR‐129‐5p
- lncRNA
long non‐coding RNA
- miRNA
microRNA
- NC
negative control for sh‐OIP5‐AS1
- OIP5‐AS1
Opa interacting protein 5‐antisense RNA 1
- SOX2
sex‐determining region Y‐box 2
1. INTRODUCTION
Breast cancer is a significant threat to women's health worldwide because of its high morbidity and mortality. In 2018, breast cancer alone is expected to account for 29% all new cancer diagnoses in women.1 Patients with early stage breast cancer have a better outcome which means longer survival and better quality of life. However, once the disease has progressed, breast cancer patients suffer from cancer relapse cancer, metastases or even cancer‐related death. Although numerous studies have investigated breast cancer, the mechanisms underlying its biological behavior remain unknown and new targets for diagnosis and treatment need to be explored.
LncRNA is a heterogeneous class of RNAs with more than 200 nucleotides and limited protein‐coding ability.2, 3 LncRNAs play key roles in gene regulation at the transcriptional or post‐transcriptional levels and are involved in many biological functions, including proliferation, apoptosis, metastasis, genomic stability, metabolism and therapy resistance.4, 5 LncRNAs can also function as ceRNAs, binding to miRNAs and protecting their target RNAs from repression or degradation.6 Several studies have identified an involvement for lncRNAs in breast cancer.7, 8, 9, 10 HOX antisense intergenic RNA (HOTAIR)11 affects the expression of numerous downstream genes by interacting with polycomb repressive complex 2 (PRC2), which can further promote H3K27 methylation.12 Chandra Gupta et al13 showed that HOTAIR acts as a powerful predictor for breast cancer and functions in breast cancer development. Metastasis‐associated lung adenocarcinoma transcript 1 (MALAT1), first identified in non‐small cell lung cancer, is also involved in the proliferation, invasion and migration of breast cancer cells.14, 15, 16
The lncRNA OIP5‐AS1, known as cyrano in zebrafish, is a 1.894‐kb transcript that lacks protein‐coding ability. OIP5‐AS1 is overexpressed in the nervous system and is important for controlling neurogenesis during development.17 Several studies have indicated that OIP5‐AS1 may play different roles in various tumors. OIP5‐AS1 reduced the proliferation of HeLa cervical carcinoma cells by acting as a ceRNA for HuR.18 OIP5‐AS1 also regulates mitosis in HeLa cells by inhibiting GAK expression.19 Hu et al20 showed that OIP5‐AS1 was overexpressed in glioma tissues and acted as an oncogene by downregulation of YAP and inhibition of Notch signaling pathway activity. OIP5‐AS1 also promoted the progression of hepatoblastoma cells and lung adenocarcinoma.21, 22 Together, these studies indicate a function for OIP5‐AS1 in cancer. However, its role in breast cancer has not been reported.
In the present study, we examined the expression of OIP5‐AS1 in breast cancer tissues and human breast cancer cells and investigated its potential function in regulating breast cancer activity and progression. Our results showed that OIP5‐AS1 may function as ceRNA of miR‐129‐5p to regulate the expression of SOX2 in breast cancer and thus plays a role in breast cancer progression.
2. MATERIALS AND METHODS
2.1. Tissue samples
Seventy pairs of breast cancer and paired adjacent tissue samples were obtained from Jinling Hospital, affiliated with the Medical School of Nanjing University, between 2015 and 2017. Inclusion criteria were histological diagnosis of invasive ductal carcinoma of the breast before operation; no neoadjuvant therapy including chemotherapy, radiotherapy, endocrine therapy and molecular targeted therapy before the operation; and complete clinical data and follow‐up information. All tissues were immediately separated into aseptic cryopreservation tubes and quickly placed in liquid nitrogen for storage. The investigation was approved by the ethics committee of Jinling Hospital. All patients signed informed consent forms.
2.2. Cell culture
Human breast cancer cell lines MCF‐7, MDA‐MB‐231, T47D, SK‐BR‐3 and BT‐549 were obtained from the Type Culture Collection of the Chinese Academy of Sciences, Shanghai, China, and the normal human mammary epithelial cell line MCF‐10A was purchased from KeyGEN Biotech Company (Nanjing, China). Cell culture conditions are listed in Table 1. Medium was replaced every 2 days, and cells were passaged when they reached 90% confluence.
Table 1.
Culture conditions for cell lines used in the present study
| Cell line | Culture medium | Culture conditions |
|---|---|---|
| MCF‐10A | MEGM+100 ng/mL cholera toxin | 37°C, 5% CO2 |
| MCF‐7 | DMEM+10% FBS+2% penicillin‐streptomycin | 37°C, 5% CO2 |
| MDA‐MB‐231 | DMEM+10% FBS+2% penicillin‐streptomycin | 37°C, 5% CO2 |
| SK‐BR‐3 | RPMI‐1640+10% FBS+2% penicillin‐streptomycin | 37°C, 5% CO2 |
| BT‐549 | RPMI‐1640+10% FBS+2% penicillin‐streptomycin+0.023 U/mL insulin | 37°C, 5% CO2 |
| T47D | RPMI‐1640+10% FBS+2% penicillin‐streptomycin | 37°C, 5% CO2 |
MEGM (Kit Catalog No. CC‐3150, ATCC, Shanghai, China); DMEM (Gibco, Thermo Fisher, Waltham, MA, USA); FBS (Gibco); penicillin‐streptomycin (Beyotime, Shanghai, China); RPMI‐1640 (Gibco).
2.3. RNA extraction and qRT‐PCR assay
Total RNA was extracted from tissues and cells using TRIzol (Invitrogen, Carlsbad, CA, USA) according to the manufacturer's instructions. First‐Strand cDNA Synthesis kit (TaKaRa, Shiga, Japan) was used to generate cDNA according to the manufacturer's instructions. A specific reverse transcription primer from Bulge‐Loop miRNA qRT‐PCR Primer Sets (one RT primer and a pair of qPCR primers for each set), designed by RiboBio (Guangzhou, China), was used to reverse transcribe miR‐129‐5p and U6 RNA. For detection of OIP5‐AS1 and SOX2 mRNA expression, we used GAPDH mRNA as an internal control, and SYBR Green qRT‐PCR master mix (TaKaRa) was used to detect qPCR signals. All results were calculated using the method. All experiments were carried out in triplicate. Primer sequences used for qPCR are listed in Table 2.
Table 2.
Primer sequences for qPCR primers
| OIP5‐AS1 | Forward: 5′‐CAGGCTGGAGTGATGCGTGAT‐3′ |
| Reverse: 5′‐GGAGGCTGAGGCAGGAGAAT‐3′ | |
| SOX2 | Forward: 5′‐CTCCATGGGTTCGGTGGTCAA‐3′ |
| Reverse: 5′‐CCTGGAGTGGGAGGAAGAGGTAA‐3′ | |
| GAPDH | Forward: 5′‐CCATGACAACTTTGGTATCGTGGAA‐3′ |
| Reverse: 5′‐GGCCATCACGCCACAGTTTC‐3′ |
OIP5‐AS1, Opa interacting protein 5‐antisense RNA 1; SOX2, sex‐determining region Y‐box 2.
2.4. Transfection of lentivirus and plasmid vectors
The lentivirus for OIP5‐AS1 inhibition (sh‐OIP5‐AS1), miR‐129‐5p lentivirus (miR‐129‐5p) and negative control (NC) lentivirus were purchased from WuYuan Company (Beijing, China). Three different sequences used for sh‐OIP5‐AS1 and the NC sequence are as follows:
sh‐a: 5′‐GCUCCUAGGAUUCCAGUUAUC‐3′
sh‐b: 5′‐GCAGAAGGCUGAGUUUCAUUU‐3′
sh‐c: 5′‐GGUGCUUAGGUGGUGGUAUUU‐3′
sh‐NC: 5′‐UUCUCCGAACGUGUCACGU‐3′
The miR‐129‐5p sequence in the overexpression lentivirus was CUUUUUGCGGUCUGGGCUUGC. The negative control sequence for miR‐129‐5p (Coi) was UUCUCCGAACGUGUCACGU. The SOX2 overexpression plasmid (pFUW‐TETO/SOX2) and the negative control vector (pFUW‐TETO/NC) were purchased from KeyGEN. The sequence for pFUW‐TETO/SOX2 was as follows:gagctcTGTTTAAAAAGGGCAAAAGTTTTAGACTGTACTAAATTTTATAACTTACTGTTAAAAGCAAAAATGGCCATGCAGGTTGACACCGTTGGTAATTTATAATAGCTTTTGTTCGATCCCAACTTTCCATTTTGTTCAGATAAAAAAAACCATtctaga. The miR‐129‐5p inhibitor was purchased from Thermo Fisher (Waltham, MA, USA). Polyamines (Yeasen, Shanghai, China) were used for lentivirus transfection and Lipo2000 (Invitrogen) was used for plasmid and miR‐129‐5p inhibitor transfection according to the manufacturers’ instructions.
2.5. CCK‐8 assay
Cells were seeded in 96‐well plates at 5 × 10³ cells per well in 100 μL. CCK‐8 solution (10 μL) (Dojindo, Kumamoto, Japan) was added at various times and cells were incubated for 1‐3 hours at 37°C. Absorbance at 450 nm (OD 450 nm) was detected using a microplate reader.
2.6. Colony formation assay
Cells were seeded in 6‐well plates at 1 × 10³ cells per well and cultured in DMEM containing 10% FBS. At day 14, cells were washed with PBS and methanol was added for 30 minutes, followed by 0.1% crystal violet staining for 30 minutes.
2.7. Transwell assay
Membrane invasion culture system with Transwell membranes of 6.5 mm diameter and 8 μm pore size (Corning, Corning, NY, USA) was used according to standard protocol. Cells were seeded into the upper compartment at 2 × 10⁴ cells per well in 200 μL DMEM without FBS. The lower chamber was filled with 800 μL DMEM containing 20% FBS. After 48 hours, cells on the lower surface were fixed with 4% paraformaldehyde and stained with 0.1% crystal violet. The results were counted using an inverted microscope (Olympus, Lake Success, NY, USA).
2.8. Wound healing assay
Cells were seeded in a 6‐well plate at 5 × 10⁵ cells per well in 2 mL medium. After cell attachment, a 200 μL pipette tip was used to create a scratch in the cell layer. PBS was used to wash away the cells that had been scraped off, and cells were incubated for 48 hours. Wound widths were photographed and measured under a microscope at 0 and 48 hours.
2.9. Flow cytometry
Cells were trypsinized, collected and resuspended in binding buffer (1 × 10⁶ cells/500 μL buffer). Next, 5 μL Annexin V‐APC detection reagent (KeyGEN) and 5 μL 7‐AAD staining solution (KeyGEN) were added to the medium, and cells were incubated for 15‐20 minutes at room temperature. Annexin V‐APC staining was examined through the FL4 channel and 7‐AAD was examined with the FL3 channel using flow cytometry (BD Calibur, New York City, NY, USA).
2.10. Western blot
Cells were lysed in RIPA buffer (Beyotime, Haimen, China) containing 1% PMSF and 1% protease inhibitor cocktail. The samples were placed on a 4°C shaker, shaken gently for 30 minutes, and centrifuged at 14 000 g at 4°C for 15 minutes. The BCA kit (KeyGEN) was used to determine the protein concentrations according to the manufacturer's instructions. Samples were mixed with 5× SDS loading buffer at 4:1 and heated at 100°C for 10 minutes. Proteins were electrophoresed on SDS polyacrylamide gels and transferred to PVDF. Membranes were incubated in blocking solution containing 5% non‐fat milk at 37°C for 1 hour. The membranes were then incubated with primary antibody at 4°C overnight. After a wash step at 37°C for 1 hour, the membranes were incubated with secondary antibody (Abcam, Cambridge, UK), diluted 1:3500. Immunoreactivity bands were detected by chemiluminescence. The primary antibodies used were as follows: anti‐SOX2 (diluted 1:1000, Ab171380; Abcam), anti‐β‐actin (1:500, Abs100041; Absin, Shanghai, China), anti‐Bcl2 (1:300, BM3938; Boster, Pleasanton, CA, USA), anti‐Bax (1:300, A00183; Boster), anti‐cleaved caspase 3 (1:400, BM4340; Boster) and anti‐caspase 3 (1:300; BM4585; Boster).
2.11. Luciferase reporter assay
We constructed SOX2‐wild‐type (wt‐SOX2), SOX2‐mutant (mut‐SOX2), OIP5‐AS1‐wild‐type (wt‐OIP5‐AS1) and OIP5‐AS1‐mutant (mut‐OIP5‐AS1) luciferase reporter vectors using the pmirGLO Dual‐Luciferase vector (Promega, Shanghai, China) according to the binding sites predicted by the online software starBase v2.0 (http://starbase.sysu.edu.cn/index.php). Cells were seeded in 96‐well plates at 1 × 10⁴ cells per well and cultured for 48 hours. When the cell density reached 80%‐90%, cells were transfected with plasmids (wt‐SOX2, mut‐SOX2, wt‐OIP5‐AS1 or mut‐OIP5‐AS1) using Lipo2000 (Invitrogen) in the following ratio: DNA (μg) : Lipo2000 (μL) = 0.5:1. Cells were cultured for 36 hours and luciferase was detected at 72 hours using the Multiplex Plate Reader (Spectramax M3; Molecular Devices, San Jose, CA, USA).
2.12. Xenograft tumorigenicity assay
Ten BALB/c nude mice (4 weeks old, female) were purchased from the Comparative Medicine Department of Jinling Hospital and randomly divided into two groups (n = 5 per group). The mice were maintained at an appropriate temperature and humidity in 12‐hour day/night cycles, and food and drinking water were given at regular intervals. MDA‐MB‐231 cells expressing sh‐NC or sh‐OIP5‐AS1 (5 × 10⁷/100 μL) were s.c. injected into the right rib side. The mice and implant growths were carefully observed, and the length (a) and diameter (b) of tumors were measured by Vernier caliper every 2 days after tumor formation. Tumor volume was calculated by the following formula: V = 1/2 × a × b2. The growth curve was drawn according to the tumor volume. At day 15 after tumor formation, all mice were killed and the s.c. tumors were embedded in paraffin for analyses. All experiments followed the protocol of the animal ethics committee of Jinling Hospital and regulations on the management of experimental animals and 3R principle (reduction, replacement and refinement).
2.13. Immunohistochemistry
Expressions of Ki‐67 and SOX2 were evaluated using immunohistochemistry assay as previously described.23 Briefly, slides were washed with specific reagents in the following order: xylene, two times, 5 minutes each; 100% ethanol, two times, 5 minutes each, 95% ethanol, two times, 5 minutes each, 80% ethanol, once, 5 minutes; 70% ethanol, once, 5 minutes; 50% ethanol, once, 5 minutes; dH2O, two times, 5 minutes each. Then, endogenous peroxidase activity was blocked at room temperature by a 5‐10‐minute incubation in the final development of 3% H2O2 in distilled water or PBS (pH 7.4). The sections were placed in a 0.1 M citrate buffer, pH 5.0, with microwave treatment for 8 minutes, then cooled to room temperature for antigen retrieval. After blocking with 1% goat serum, the sections were incubated with anti‐SOX2 (ab171380, 1:100; Abcam) and anti‐Ki‐67 (ab15580, 1:400; Abcam) overnight at 4°C. Sections were rinsed twice for 5 minutes each and sections incubated with a HRP‐conjugated secondary antibody (goat anti‐rabbit IgG, KGAA26,1:1000) at 37°C for 20 minutes. Diaminobenzidine was applied to the sections to produce a brown stain indicating immunoreactivity, and the samples were counterstained with hematoxylin. Images were captured by light microscopy.
2.14. TUNEL assay
Apoptosis in s.c. transplanted tumor tissues was evaluated using the TUNEL assay kit (KeyGEN) according to the manufacturer's guidelines.
2.15. Statistical analysis
GraphPad Prism 5 (La Jolla, CA, USA) and SPSS 22.0 (Chicago, IL, USA) were used for data analysis, and the data are expressed as mean value ± (SD. Significance of OIP5‐AS1 expression in breast cancer as correlated with clinicopathological characteristics was investigated using the chi‐squared test. Two‐tailed Student's t test was used to determine the statistical significance between the mean values of the experimental and control groups. A value of P < .05 was considered significant.
3. RESULTS
3.1. Opa interacting protein 5‐antisense RNA 1 is significantly upregulated in breast cancer tissues and cell lines
We examined the expression of OIP5‐AS1 in 70 pairs of breast cancer tissues and paired adjacent normal tissues using qRT‐PCR assay. OIP5‐AS1 was significantly upregulated in 70 breast cancer tissue samples compared with the paired adjacent normal tissues (P < .05) (Figure 1A,B). We divided the 70 patients into high and low OIP5‐AS1 expression groups according to a cut‐off value of twice the level observed in normal tissue and analyzed the relationship between OIP5‐AS1 expression and clinical characteristics (Table 3). We found a correlation between high OIP5‐AS1 expression and tumor size (P = .033), lymph node metastasis (P = .032), pathological grading (P = .016) and TNM stage (P = .042).
Figure 1.
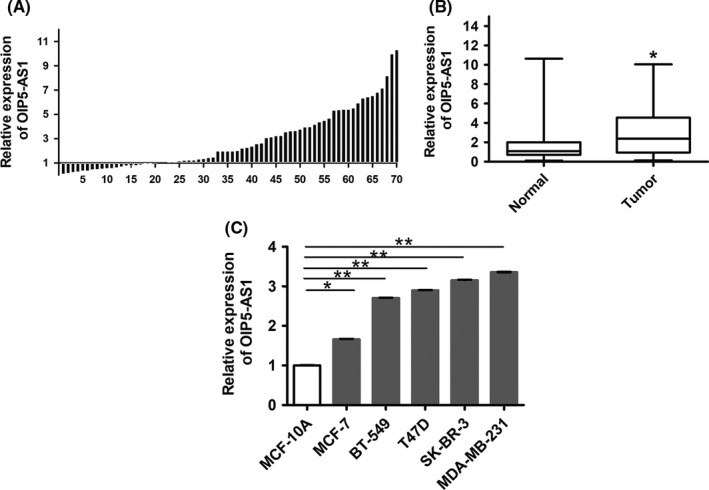
Expression of Opa interacting protein 5‐antisense RNA 1 (OIP5‐AS1) is increased in breast cancer tissues and cell lines. A, qRT‐PCR of OIP5‐AS1 in 70 breast cancer samples compared with paired adjacent tissue samples. B, qRT‐PCR of OIP5‐AS1 in breast cancer tissue samples. Expression of OIP5‐AS1 in normal tissue was set to 1. C, qRT‐PCR of OIP5‐AS1 in breast cancer cell lines compared with normal mammary epithelial cells MCF‐10A. *P < .05, **P < .01
Table 3.
Correlation of OIP5‐AS1 expression with clinicopathological factors of breast cancer patients
| Factors | Expression of OIP5‐AS1 | P‐value | |
|---|---|---|---|
| Low (N = 32) | High (N = 38) | ||
| Age (y) | |||
| ≤50 | 14 | 16 | 1.000 |
| >50 | 18 | 22 | |
| Tumor size (cm) | |||
| <2.5 | 21 | 14 | 0.033* |
| ≥2.5 | 11 | 24 | |
| ER status | |||
| (+) | 14 | 26 | 0.053 |
| (−) | 18 | 12 | |
| PR status | |||
| (+) | 14 | 21 | 0.472 |
| (−) | 18 | 17 | |
| Her‐2 status | |||
| (+) | 11 | 16 | 0.624 |
| (−) | 21 | 22 | |
| Ki‐67 status (%) | |||
| ≤20 | 15 | 25 | 0.147 |
| >20 | 17 | 13 | |
| Lymph node metastasis | |||
| (+) | 10 | 22 | 0.032* |
| (−) | 22 | 16 | |
| Pathological grading | |||
| I‐II | 23 | 16 | 0.016* |
| III | 9 | 22 | |
| TNM stage | |||
| I‐II | 26 | 22 | 0.042* |
| III‐IV | 6 | 16 | |
P < .05 was considered statistically significant.
ER, estrogen receptor; Her‐2, human epidermal growth factor receptor 2; OIP5‐AS1, Opa interacting protein 5‐antisense RNA 1; PR, progesterone receptor.
We also examined OIP5‐AS1 expression in breast cancer lines, including MCF‐7, T47D, BT549, SK‐BR‐3 and MDA‐MB‐231, compared with MCF‐10A normal human mammary epithelial cells. OIP5‐AS1 was upregulated in all five breast cancer cell lines, with SK‐BR‐3 and MDA‐MB‐231 showing the highest expression (P < .01; Figure 1C). We thus selected these lines for subsequent analyses.
3.2. Downregulation of OIP5‐AS1 suppresses breast cancer cell growth, proliferation and migration, and induces apoptosis in vitro
To examine the function of OIP5‐AS1 in breast cancer cells, we designed three vectors with sequences targeting OIP5‐AS1 for downregulation: sh‐OIP5‐AS1‐a, sh‐OIP5‐AS1‐b and sh‐OIP5‐AS1‐c. qRT‐PCR assay confirmed sh‐OIP5‐AS1‐b as the most potent silencer of OIP5‐AS1 compared with the negative control (sh‐NC) (Figure 2A). We thus used sh‐OIP5‐AS1‐b (referred to as sh‐OIP5‐AS1 in the remainder of the present study) in the following experiments. CCK‐8 assays showed that downregulation of OIP5‐AS1 in SK‐BR‐3 and MDA‐MB‐231 cells dramatically reduced proliferation compared with sh‐NC cells (P < .01; Figure 2B). Colony formation ability was also significantly reduced in both cell lines after downregulation of OIP5‐AS1 compared with sh‐NC cells (P < .01) (Figure 2C). Wound healing and Transwell assays showed that cell migration and invasion, respectively, were significantly inhibited in the sh‐OIP5‐AS1 group compared with controls (P < .01; Figure 2D,E). Flow cytometry showed a higher apoptosis rate in sh‐OIP5‐AS1 cells compared with sh‐NC cells (P < .01) (Figure 2F). Consistent with these results, upon downregulation of OIP5‐AS1, the pro‐apoptotic proteins Bax and cleaved caspase 3 were increased and the anti‐apoptotic protein Bcl‐2 was decreased (Figure 2G).
Figure 2.
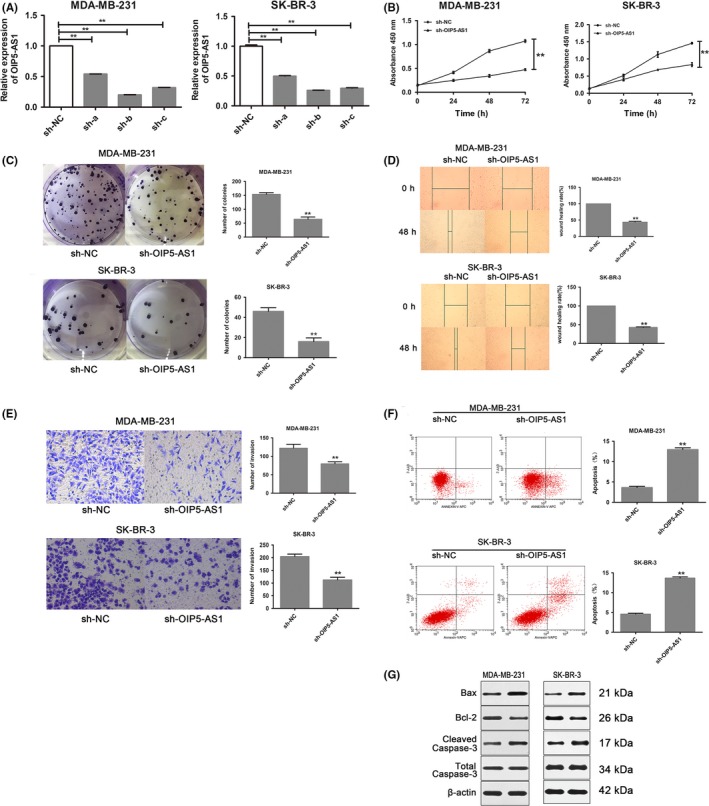
Downregulation of Opa interacting protein 5‐antisense RNA 1 (OIP5‐AS1) inhibits breast cancer cell growth, proliferation and migration, and induces apoptosis. A, qRT‐PCR of OIP5‐AS1 expression in breast cancer cell lines MDA‐MB‐231 and SK‐BR‐3 transfected with lentivirus carrying sh‐OIP5‐AS1 sequences sh‐a, sh‐b or sh‐c compared with negative control (NC). B, CCK‐8 assays of MDA‐MB‐231 and SK‐BR‐3 cells transfected with sh‐OIP5‐AS1 or NC lentivirus. C, Colony formation assays in MDA‐MB‐231 and SK‐BR‐3 cells expressing sh‐NC or sh‐OIP5‐AS1. Cells were cultured for 14 days and colonies were quantified. D, Wound healing assays in MDA‐MB‐231 and SK‐BR‐3 cells expressing sh‐NC or sh‐OIP5‐AS1. E, Invasion assays using Transwell assays in MDA‐MB‐231 and SK‐BR‐3 cells expressing sh‐NC or sh‐OIP5‐AS1. F, Evaluation of apoptosis by flow cytometry in MDA‐MB‐231 and SK‐BR‐3 cells expressing sh‐NC or sh‐OIP5‐AS1. G, Western blotting analysis in MDA‐MB‐231 and SK‐BR‐3 cells expressing sh‐NC or sh‐OIP5‐AS1. **P < .01
3.3. MicroRNA‐129‐5p binds to OIP5‐AS1
To determine the mechanism of OIP5‐AS1, we attempted to identify downstream molecules of OIP5‐AS1. By searching the online software starBase v2.0, we found that OIP5‐AS1 contains binding sites for miR‐129‐5p.
To determine the relationship between OIP5‐AS1 and miR‐129‐5p, we examined miR‐129‐5p expression in 57 of the 70 original breast cancer cases and found low miR‐129‐5p expression in the breast cancer cases compared with paired adjacent tissues (Figure 3A,B). Furthermore, miR‐129‐5p and OIP5‐AS1 expression were negatively correlated in breast cancer tissues (Figure 3C).
Figure 3.
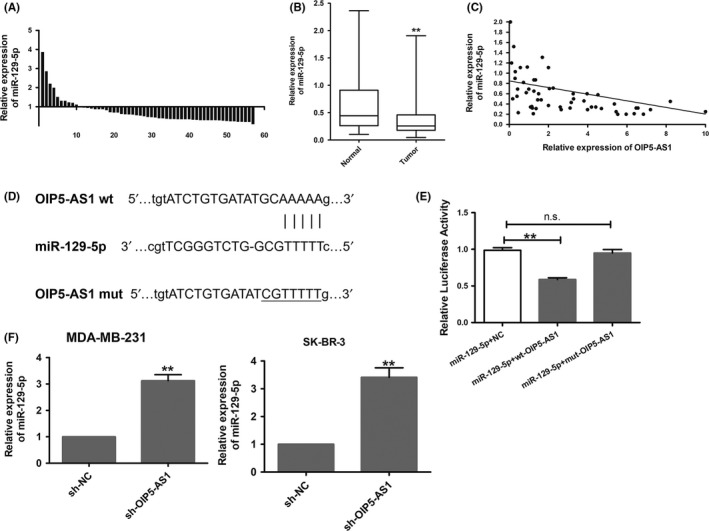
Opa interacting protein 5‐antisense RNA 1 (OIP5‐AS1) binds to and suppresses micro RNA (miR)‐129‐5p expression. A, qRT‐PCR of miR‐129‐5p expression in breast cancer tissue samples from 57 patients. B, Expression of miR‐129‐5p in breast cancer tissue samples; expression of miR‐129‐5p in normal tissue was set to 1. C, Expression levels of miR‐129‐5p and OIP5‐AS1 in breast cancer tissue samples were negatively correlated. D, Wild‐type (wt) OIP5‐AS1 sequence with the miR‐129‐5p binding site and the mutant (mut) sequence OIP5‐AS1 in which the binding site was mutated. E, Luciferase assays in MDA‐MB‐231 cells transfected with miR‐129‐5p together with wt‐OIP5‐AS1 or mut‐OIP5‐AS1 luciferase constructs. F, qRT‐PCR of miR‐129‐5p in breast cancer cells expressing sh‐OIP5‐AS1 or sh‐NC. **P < .01, n.s., no significant difference
To examine the potential binding and regulation of miR‐129‐5p to OIP5‐AS1, we designed a luciferase reporter containing the wild‐type OIP5‐AS1 3′‐untranslated region (UTR) or a mutant with a mutated miR‐129‐5p binding site (Figure 3D). miR‐129‐5p expression decreased luciferase activity of the wt‐OIP5‐AS1 3′‐UTR vector but not the mut‐OIP5‐AS1 3′‐UTR vector (P < .01) (Figure 3E).
We next evaluated miR‐129‐5p expression in MDA‐MB‐231 and SK‐BR‐3 cells with OIP5‐AS1 downregulation and found a significant increase of miR‐129‐5p in sh‐OIP5‐AS1 cells compared with control cells in both lines (P < .01) (Figure 3F). Together, these findings suggest that miR‐129‐5p can bind to OIP5‐AS1 and the downregulation of OIP5‐AS1 can increase the expression of miR‐129‐5p in breast cancer cells.
3.4. Upregulation of miR‐129‐5p inhibits breast cancer cell growth, proliferation and migration, and induces cell apoptosis in vitro
We next examined the function of miR‐129‐5p in breast cancer cells by expressing miR‐129‐5p in SK‐BR‐3 and MDA‐MB‐231 cells (Figure 4A). CCK‐8 assays showed reduced proliferation in both miR‐129‐5p‐expressing cell lines compared with the negative control (Coi) group (P < .01) (Figure 4B). In miR‐129‐5p‐expressing cells, colony formation ability was significantly reduced compared with controls (P < .01; Figure 4C). Wound healing and Transwell assays showed that migration and invasion, respectively, were significantly inhibited in the miR‐129‐5p group compared with controls (P < .01; Figure 4D,E). We also detected a higher apoptosis rate in miR‐129‐5p‐expressing cells compared with controls (P < .01; Figure 4F). Consistent with these results, Bax and cleaved caspase 3 were increased and Bcl‐2 was reduced in cells with miR‐129‐5p upregulation (Figure 4G).
Figure 4.
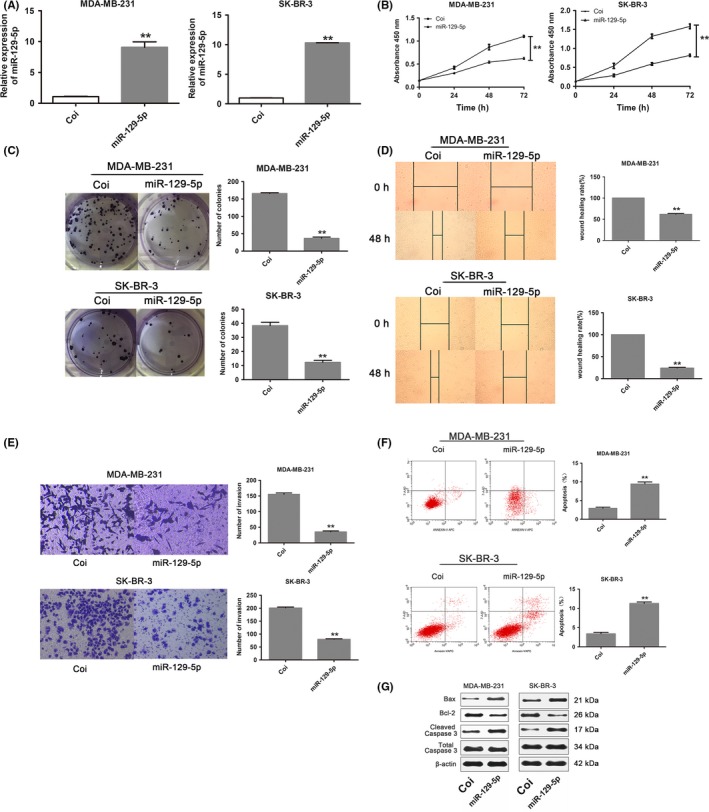
Upregulation of micro RNA (miR)‐129‐5p inhibits breast cancer cell growth, proliferation and migration, and induces cell apoptosis in vitro. A, qRT‐PCR of miR‐129‐5p in breast cancer cell lines MDA‐MB‐231 and SK‐BR‐3 transfected with lentivirus carrying the miR‐129‐5p sequence or Coi (negative control). B, CCK‐8 assay of MDA‐MB‐231 and SK‐BR‐3 cells transfected with miR‐129‐5p or Coi lentivirus. C, Colony formation assay of MDA‐MB‐231 and SK‐BR‐3 cells transfected with miR‐129‐5p or Coi lentivirus. D, Wound healing assay in MDA‐MB‐231 and SK‐BR‐3 cells transfected with miR‐129‐5p or Coi lentivirus. E, Invasion assay using Transwell assays in MDA‐MB‐231 and SK‐BR‐3 cells transfected with miR‐129‐5p or Coi lentivirus. F, Flow cytometric evaluation of apoptosis in MDA‐MB‐231 and SK‐BR‐3 cells transfected with miR‐129‐5p or Coi lentivirus. G, Western blotting of MDA‐MB‐231 and SK‐BR‐3 cells transfected with miR‐129‐5p or Coi lentivirus. **P < .01
3.5. Opa interacting protein 5‐antisense RNA 1 functions as a ceRNA of SOX2
Our previous studies focused on the role of SOX2 in breast cancer and found that the 3′‐UTR region of SOX2 has a miR‐129‐5p binding site using starBase.24 Thus, we next explored whether SOX2 is involved in the OIP5‐AS1/miR‐129‐5p axis. We first constructed luciferase reporters containing the wild‐type SOX2 3′‐UTR or 3′‐UTR mutated for the miR‐129‐5p binding sequence (Figure 5A). In MDA‐MB‐231 cells, miR‐129‐5p decreased luciferase activity of the wt‐SOX2 3′‐UTR vector but not the mut‐SOX2 3′‐UTR vector (P < .01; Figure 5B).
Figure 5.
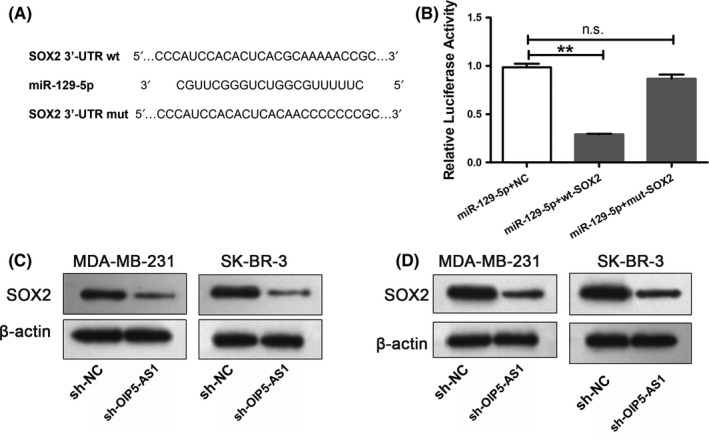
Opa interacting protein 5‐antisense RNA 1 (OIP5‐AS1) functions as a competing endogenous RNA of sex‐determining region Y‐box 2 (SOX2). A, Wild‐type (wt) 3′ UTR of SOX2 sequence with the micro RNA (miR)‐129‐5p binding site and the mutant (mut) sequence SOX2 in which the binding site was mutated. B, Luciferase assays in MDA‐MB‐231 cells transfected with miR‐129‐5p together with wt‐SOX2 or mut‐SOX2. C, Western blot for SOX2 expression in MDA‐MB‐231 and SK‐BR‐3 cells transfected with sh‐OIP5‐AS1 lentivirus or negative control (sh‐NC). D, Western blot for SOX2 expression in MDA‐MB‐231 and SK‐BR‐3 cells with upregulation of miR‐129‐5p or Coi. **P < .01, n.s., no significant difference
We next explored the relationship among OIP5‐AS1, miR‐129‐5p and SOX2. Downregulation of OIP5‐AS1 as well as upregulation of miR‐129‐5p (Figure 5D) resulted in decreased SOX2 levels. We have shown that miR‐129‐5p binds OIP5‐AS1 and the expression of miR‐129‐5p is regulated by OIP5‐AS1. These results suggest that OIP5‐AS1 functions as a ceRNA by acting as a sponge for miR‐129‐5, releasing SOX2 from the inhibitory effect of miR‐129‐5p.
3.6. Downregulation of OIP5‐AS1 inhibits breast cancer cells and anti‐miRNA‐129‐5p and SOX2 rescued these effects
To examine the function of the OIP5‐AS1/miR‐129‐5p/SOX2 axis in breast cancer, we carried out rescue experiments in MDA‐MB‐231 cells using the following experimental groups: control, sh‐OIP5‐AS1, sh‐OIP5‐AS1+anti‐miR‐129‐5p and sh‐OIP5‐AS1+SOX2. Notably, both downregulation of miR‐129‐5p and upregulation of SOX2 could partially rescue the effects of OIP5‐AS1 downregulation on proliferation, invasion, migration and apoptosis (Figure 6). These results indicate that OIP5‐AS1 regulates the malignant phenotype of breast cancer cells by regulating miR‐129‐5p/SOX2 expression.
Figure 6.
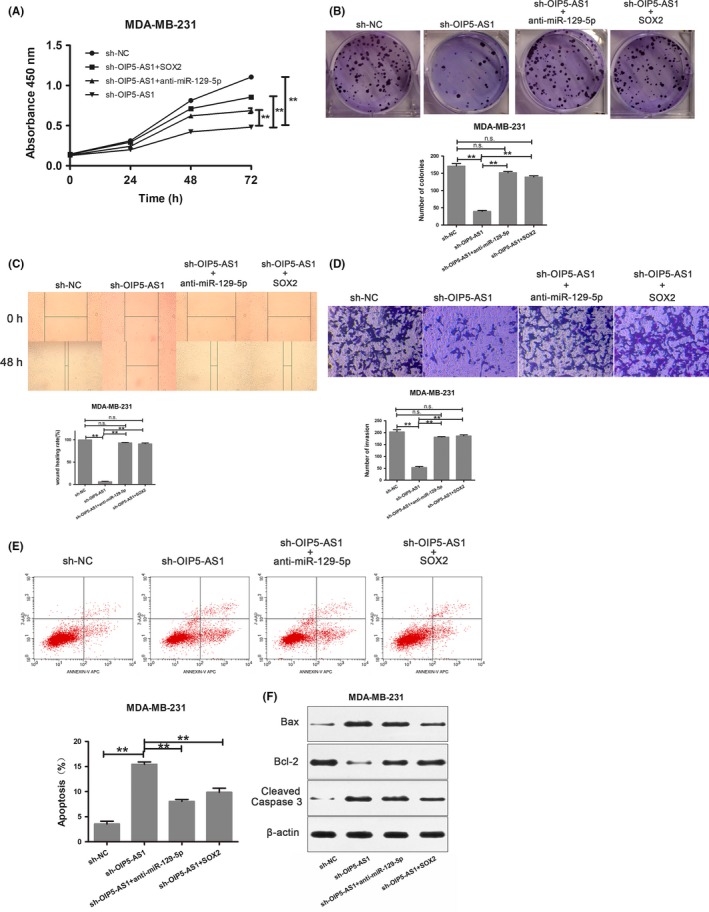
Opa interacting protein 5‐antisense RNA 1 (OIP5‐AS1) promotes progression of breast cancer cells through regulation of sex‐determining region Y‐box 2 (SOX2). A, CCK‐8 assay in MDA‐MB‐231 cells expressing the indicated constructs. B, Colony formation assay in MDA‐MB‐231 cells expressing the indicated constructs. C, Wound healing assay in MDA‐MB‐231 cells expressing the indicated constructs. D, Transwell assays in MDA‐MB‐231 cells expressing the indicated constructs. E, Flow cytometry evaluation of apoptosis in MDA‐MB‐231 cells expressing the indicated constructs. F, Western blot in MDA‐MB‐231 cells expressing the indicated constructs. **P < .01
3.7. Downregulation of OIP5‐AS1 increases miRNA‐129‐5p and decreases SOX2 levels, suppresses breast cancer cells and induces cell apoptosis in vivo
We established subcutaneous xenografts in nude mice to evaluate the role of OIP5‐AS1 in breast cancer in vivo. OIP5‐AS1 downregulation significantly inhibited tumor growth (P < .01; Figure 7A,B) as well as tumor weight (P < .01) (Figure 7C). qRT‐PCR assay confirmed dramatically reduced OIP5‐AS1 in the sh‐OIP5‐AS1 tumors (P < .01; Figure 7D) as well as increased miR‐129‐5p and decreased SOX2 expressions (Figure 7E). Western blotting also showed decreased SOX2 protein in sh‐OIP5‐AS1 tumors (Figure 7F). Immunohistochemistry showed lower Ki‐67 and SOX2 expression in sh‐OIP5‐AS1 tumors (Figure 7G), and OIP5‐AS1 downregulation caused a remarkable induction of apoptosis in vivo (Figure 7H). Together, these results show that OIP5‐AS1 downregulation suppressed breast cancer cell growth and proliferation and induced cell apoptosis in vivo.
Figure 7.
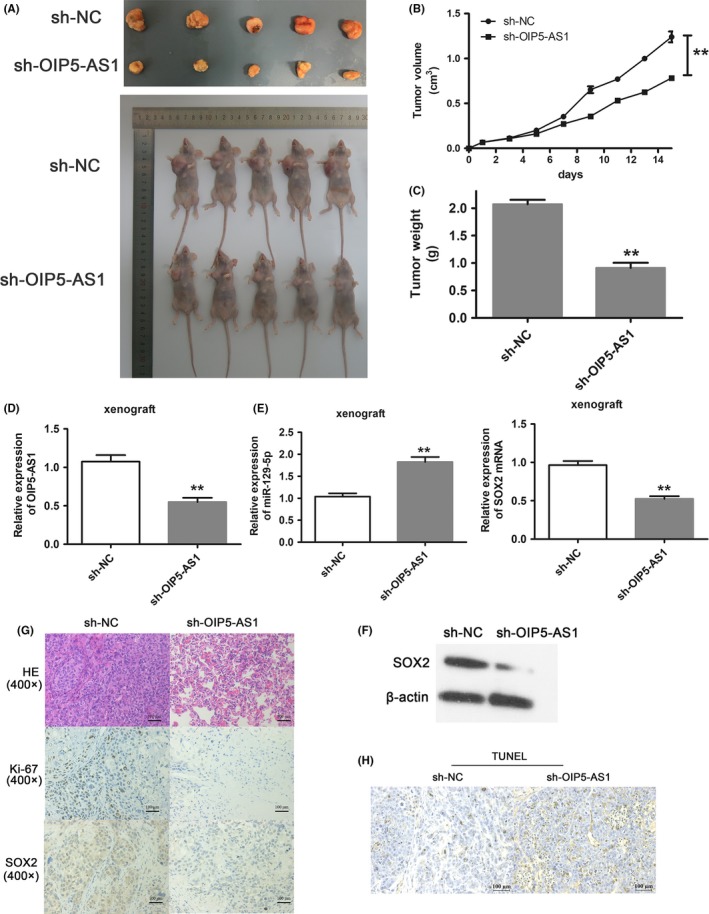
Opa interacting protein 5‐antisense RNA 1 (OIP5‐AS1) promotes breast cancer progression in vivo. A, Images of s.c. tumors from OIP5‐AS1 downregulated cells (bottom row) compared with sh‐NC cells (top row). B, Volumes of s.c. tumors from OIP5‐AS1 downregulated cells compared with sh‐NC cells. Tumor volumes were measured every 2 days. C, Tumor weights of sh‐OIP5‐AS1 tumors compared with sh‐NC tumors. D, qRT‐PCR of OIP5‐AS1 in xenograft tissue from sh‐NC and sh‐OIP5‐AS1 groups. E, Expression of miR‐129‐5p and sex‐determining region Y‐box 2 (SOX2) mRNA in xenograft tissue from sh‐NC and sh‐OIP5‐AS1 groups. F, Western blotting for SOX2 protein level in xenograft tissue from sh‐NC and sh‐OIP5‐AS1 groups. G, H&E staining, Ki‐67 expression and SOX2 expression in sh‐NC and sh‐OIP5‐AS1 tumors. H, Apoptosis in sh‐NC and sh‐OIP5‐AS1 tumors was determined by TUNEL assay. **P < .01
4. DISCUSSION
In the present study, we investigated the role of lncRNA OIP5‐AS1 in promoting breast cancer. OIP5‐AS1 was increased in breast cancer tissue samples and in breast cancer cells, and downregulation of OIP5‐AS1 resulted in suppression of malignant activities of breast cancer cells in vitro and in vivo. Our results show that lncRNA‐OIP5‐AS1 functions as a ceRNA of miR‐129‐5p to regulate the expression of SOX2.
Recent studies have shown that lncRNAs play a key role in regulating the development and growth of tumors25 and some lncRNAs have been linked with breast cancer. lncRNAs have a mRNA‐like structure and can function as a ceRNA to competitively bind miRNAs to regulate the expression of mRNAs. For example, the lncRNA nuclear enriched abundant transcript 1 (NEAT1) is significantly increased in breast cancer cells and promotes the progression of breast cancer; NEAT1 was also found to function as a ceRNA to regulate ZEB1 through miR‐448.26 The lncRNA small ubiquitin‐like modifier 1 pseudogene 3 (SUMO1P3) is highly expressed in breast cancer tissue samples and is associated with higher staging and worse prognosis.27 The long intergenic non‐coding RNA regulator of reprogramming (ROR) is a ceRNA of miR‐145 and regulates the expression of ARF6 in triple‐negative breast cancer, thus regulating invasion.28
In the present study, we found that OIP5‐AS1 was significantly increased in breast cancer tissue samples and cells. We further found reduced proliferation, invasion and migration as well as increased apoptosis of breast cancer cells as a result of downregulation of OIP5‐AS1. However, according to our results, there was no significant correlation between the expression of OIP5‐AS1 and estrogen receptor (ER) status (P = .053), progesterone receptor (PR) status (P = .472), human epidermal growth factor receptor 2 (Her‐2) status (P = 0.624) and Ki‐67 status (P = .147) (Table 3). As breast cancer was divided into four subtypes according to the status of ER, PR, Her‐2 and Ki‐67, the role of OIP5‐AS1 in breast cancer may be independent of subtype. However, experiments with more samples in multiple centers are needed.
The functional role of a lncRNA depends on the downstream molecules that it regulates, including the miRNAs it affects in its function as a ceRNA. The lncRNA mesenchymal stem cells‐upregulated factor (MUF) functions as a ceRNA of miR‐34a to regulate Snail1 activity and modulate hepatocellular carcinoma (HCC) progression.29 The lncRNA HOXD‐AS1 is upregulated in HCC tissues and competitively binds miR‐130a‐3p, regulating EZH2 and MMP2 expression and facilitating HCC metastasis.30 By online software prediction, we found the possibility of the existence of the OIP5‐AS1/miR‐129‐5p/SOX2 axis.
miR‐129‐5p was reported as a suppressor in many types of tumors. Low expression of miR‐129‐5p in breast cancer was associated with poor prognosis.31 miR‐129‐5p acts as a suppressor of autophagy in breast cancer cells and decreases their radioresistance by targeting high‐mobility group protein 1 (HMGB1).32 In the present study, we found that OIP5‐AS1 functions as ceRNA of SOX2 through miR‐129‐5p to promote the progression of breast cancer. Our luciferase assays showed that miR‐129‐5p binds and represses OIP5‐AS1 and we also showed that miR‐129‐5p could bind and repress SOX2. Thus, the expression of SOX2 could also be influenced by the downregulation of OIP5‐AS1 or by the upregulation of miR‐129‐5p. Our findings suggest that downregulation of OIP5‐AS1 can inhibit the progression of breast cancer by targeting SOX2 through miR‐129‐5p upregulation (Figure 8). As the SOX2 transcription factor regulates many downstream processes, further exploration is needed to clarify the cellular functions of the OIP5‐AS1/miR‐129‐5p/SOX2 axis.
Figure 8.
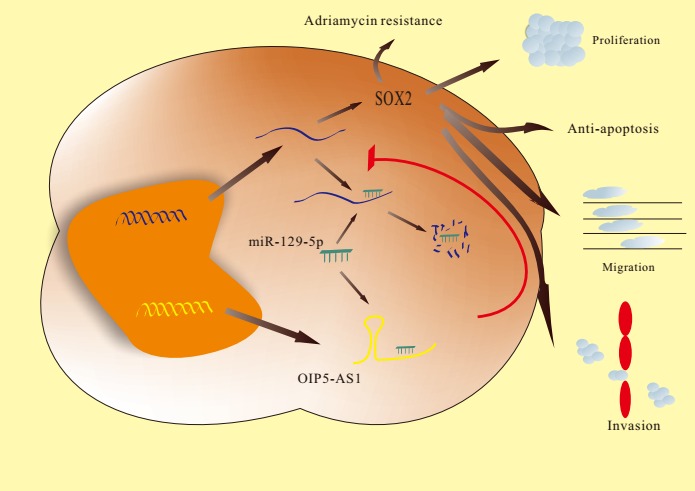
Under normal conditions, the binding of micro RNA (miR)‐129‐5p to sex‐determining region Y‐box 2 (SOX2) mRNA leads to the degradation of SOX2 mRNA, thus maintaining normal levels of SOX2. In the case of Opa interacting protein 5‐antisense RNA 1 (OIP5‐AS1) overexpression, OIP5‐AS1 competitively binds with miR‐129‐5p as a miRNA sponge and releases SOX2 mRNA from the inhibitory effect of miR‐129‐5p. The increased SOX2 can thus promote the malignant phenotype of breast cancer
The progression of breast cancer involves multiple steps and is a complex process involving multiple factors. The phenotype of breast cancer is regulated by a complex network. To explore whether there are other factors regulated by OIP5‐AS1, we used starBase v2.0 (http://starbase.sysu.edu.cn) to predict OIP5‐AS1‐targeted miRNAs and mRNAs in pan‐cancer. A total of 229 miRNAs were predicted as OIP5‐AS1‐targeted miRNA in pan‐cancer, whereas 120 were significant in breast cancer. Other significant miRNAs besides miR‐129‐5p and their target sites and alignment sequence are listed in Table S1. Furthermore, 1659 ceRNA networks were predicted as OIP5‐AS1‐related in pan‐cancer, among which the expression of FAM13B, ERRFL1, ELK4, RCOR1, SLC4A7 showed important roles in the OIP5‐AS1 related network. More research is needed to clarify the OIP5‐AS1‐regulated network in breast cancer.
This study has some limitations. The follow‐up time of our selected clinical patients was short and not sufficient to draw correlations between OIP5‐AS1 expression and miR‐129‐5p expression with the survival and prognosis of breast cancer patients.
Together, our findings highlight the important role of the lncRNA OIP5‐AS1 in promoting the progression of breast cancer by targeting SOX2 through miR‐129‐5p. To the best of our knowledge, this is the first study to characterize the role of the lncRNA OIP5‐AS1 in breast cancer. These results provide new targets for the diagnosis and treatment of breast cancer and call for more studies on the detailed mechanisms underlying the function of lncRNAs.
CONFLICTS OF INTEREST
Authors declare no conflicts of interest for this article.
Supporting information
ACKNOWLEDGMENTS
We thank all the staff of the Department of General Surgery, Medical Oncology and Medical Imaging at Jinling Hospital for technical support. We thank Edanz Group (www.edanzediting.com/ac) for editing a draft of this manuscript. This work was supported by National Key Basic Research Program of China (grant number 2014CB744500).
Zeng H, Wang J, Chen T, et al. Downregulation of long non‐coding RNA Opa interacting protein 5‐antisense RNA 1 inhibits breast cancer progression by targeting sex‐determining region Y‐box 2 by microRNA‐129‐5p upregulation. Cancer Sci. 2019;110:289–302. 10.1111/cas.13879
Zeng and Wang contributed equally to this work.
REFERENCES
- 1. Siegel RL, Miller KD, Jemal A. Cancer statistics, 2018. CA Cancer J Clin. 2018;68:7‐30. [DOI] [PubMed] [Google Scholar]
- 2. Cech TR, Steitz JA. The noncoding RNA revolution–trashing old rules to forge new ones. Cell. 2014;157:77‐94. [DOI] [PubMed] [Google Scholar]
- 3. Sun M, Kraus WL. Minireview: long noncoding RNAs: new “links” between gene expression and cellular outcomes in endocrinology. Mol Endocrinol. 2013;27:1390‐1402. [DOI] [PMC free article] [PubMed] [Google Scholar]
- 4. Huarte M. The emerging role of lncRNAs in cancer. Nat Med. 2015;21:1253‐1261. [DOI] [PubMed] [Google Scholar]
- 5. Qu L, Ding J, Chen C, et al. Exosome‐transmitted lncARSR promotes Sunitinib resistance in renal cancer by acting as a competing endogenous RNA. Cancer Cell. 2016;29:653‐668. [DOI] [PubMed] [Google Scholar]
- 6. Lin C, Zhang S, Wang Y, et al. Functional role of a novel long noncoding RNA TTN‐AS1 in esophageal squamous cell carcinoma progression and metastasis. Clin Cancer Res. 2018;24:486‐498. [DOI] [PubMed] [Google Scholar]
- 7. Redis RS, Sieuwerts AM, Look MP, et al. CCAT2, a novel long non‐coding RNA in breast cancer: expression study and clinical correlations. Oncotarget. 2013;4:1748‐1762. [DOI] [PMC free article] [PubMed] [Google Scholar]
- 8. Xiao C, Sharp JA, Kawahara M, et al. The XIST noncoding RNA functions independently of BRCA1 in X inactivation. Cell. 2007;128:977‐989. [DOI] [PubMed] [Google Scholar]
- 9. Mendell JT. Targeting a long noncoding RNA in breast cancer. N Engl J Med. 2016;374:2287‐2289. [DOI] [PubMed] [Google Scholar]
- 10. Yao J, Xu F, Zhang D, et al. TP73‐AS1 promotes breast cancer cell proliferation through miR‐200a‐mediated TFAM inhibition. J Cell Biochem. 2017;119:680‐690. [DOI] [PubMed] [Google Scholar]
- 11. Rinn JL, Kertesz M, Wang JK, et al. Functional demarcation of active and silent chromatin domains in human HOX loci by noncoding RNAs. Cell. 2007;129:1311‐1323. [DOI] [PMC free article] [PubMed] [Google Scholar]
- 12. Tsai MC, Manor O, Wan Y, et al. Long noncoding RNA as modular scaffold of histone modification complexes. Science. 2010;329:689‐693. [DOI] [PMC free article] [PubMed] [Google Scholar]
- 13. Chandra Gupta S, Nandan Tripathi Y. Potential of long non‐coding RNAs in cancer patients: from biomarkers to therapeutic targets. Int J Cancer. 2016;140:1955‐1967. [DOI] [PubMed] [Google Scholar]
- 14. Ji P, Diederichs S, Wang W, et al. MALAT‐1, a novel noncoding RNA, and thymosin beta4 predict metastasis and survival in early‐stage non‐small cell lung cancer. Oncogene. 2003;22:8031‐8041. [DOI] [PubMed] [Google Scholar]
- 15. Schmidt LH, Spieker T, Koschmieder S, et al. The long noncoding MALAT‐1 RNA indicates a poor prognosis in non‐small cell lung cancer and induces migration and tumor growth. J Thorac Oncol. 2011;6:1984‐1992. [DOI] [PubMed] [Google Scholar]
- 16. Arun G, Diermeier S, Akerman M, et al. Differentiation of mammary tumors and reduction in metastasis upon Malat1 lncRNA loss. Genes Dev. 2016;30:34‐51. [DOI] [PMC free article] [PubMed] [Google Scholar]
- 17. Ulitsky I, Shkumatava A, Jan CH, et al. Conserved function of lincRNAs in vertebrate embryonic development despite rapid sequence evolution. Cell. 2011;147:1537‐1550. [DOI] [PMC free article] [PubMed] [Google Scholar]
- 18. Kim J, Abdelmohsen K, Yang X, et al. LncRNA OIP5‐AS1/cyrano sponges RNA‐binding protein HuR. Nucleic Acids Res. 2016;44:2378‐2392. [DOI] [PMC free article] [PubMed] [Google Scholar]
- 19. Kim J, Noh JH, Lee SK, et al. LncRNA OIP5‐AS1/cyrano suppresses GAK expression to control mitosis. Oncotarget. 2017;8:49409‐49420. [DOI] [PMC free article] [PubMed] [Google Scholar]
- 20. Hu GW, Wu L, Kuang W, et al. Knockdown of linc‐OIP5 inhibits proliferation and migration of glioma cells through down‐regulation of YAP‐NOTCH signaling pathway. Gene. 2017;610:24‐31. [DOI] [PubMed] [Google Scholar]
- 21. Zhang Z, Liu F, Yang F, Liu Y. Knockdown of OIP5‐AS1 expression inhibits proliferation, metastasis and EMT progress in hepatoblastoma cells through up‐regulating miR‐186a‐5p and down‐regulating ZEB1. Biomed Pharmacother. 2018;101:14‐23. [DOI] [PubMed] [Google Scholar]
- 22. Deng J, Deng H, Liu C, et al. Long non‐coding RNA OIP5‐AS1 functions as an oncogene in lung adenocarcinoma through targeting miR‐448/Bcl‐2. Biomed Pharmacother. 2018;98:102‐110. [DOI] [PubMed] [Google Scholar]
- 23. Wang J, Zeng H, Li H, et al. MicroRNA‐101 inhibits growth, proliferation and migration and induces apoptosis of breast cancer cells by targeting sex‐determining region Y‐Box 2. Cell Physiol Biochem. 2017;43:717‐732. [DOI] [PubMed] [Google Scholar]
- 24. Zeng H, Wang L, Wang J, et al. microRNA‐129‐5p suppresses Adriamycin resistance in breast cancer by targeting SOX2. Arch Biochem Biophys. 2018;651:52‐60. [DOI] [PubMed] [Google Scholar]
- 25. Yu Y, Nangia‐Makker P, Farhana L, Majumdar APN. A novel mechanism of lncRNA and miRNA interaction: CCAT2 regulates miR‐145 expression by suppressing its maturation process in colon cancer cells. Mol Cancer. 2017;16:155. [DOI] [PMC free article] [PubMed] [Google Scholar]
- 26. Jiang X, Zhou Y, Sun AJ, Xue JL. NEAT1 contributes to breast cancer progression through modulating miR‐448 and ZEB1. J Cell Physiol. 2018;233:8558‐8566. [DOI] [PubMed] [Google Scholar]
- 27. Liu J, Song Z, Feng C, et al. The long non‐coding RNA SUMO1P3 facilitates breast cancer progression by negatively regulating miR‐320a. Am J Transl Res. 2017;9:5594‐5602. [PMC free article] [PubMed] [Google Scholar]
- 28. Eades G, Wolfson B, Zhang Y, et al. lincRNA‐RoR and miR‐145 regulate invasion in triple‐negative breast cancer via targeting ARF6. Mol Cancer Res. 2015;13:330‐338. [DOI] [PMC free article] [PubMed] [Google Scholar]
- 29. Yan X, Zhang D, Wu W, et al. Mesenchymal stem cells promote hepatocarcinogenesis via lncRNA‐MUF interaction with ANXA2 and miR‐34a. Cancer Res. 2017;77:6704‐6716. [DOI] [PubMed] [Google Scholar]
- 30. Wang H, Huo X, Yang XR, et al. STAT3‐mediated upregulation of lncRNA HOXD‐AS1 as a ceRNA facilitates liver cancer metastasis by regulating SOX4. Mol Cancer. 2017;16:136. [DOI] [PMC free article] [PubMed] [Google Scholar]
- 31. Yu Y, Zhao Y, Sun XH, et al. Down‐regulation of miR‐129‐5p via the Twist1‐Snail feedback loop stimulates the epithelial‐mesenchymal transition and is associated with poor prognosis in breast cancer. Oncotarget. 2015;6:34423‐34436. [DOI] [PMC free article] [PubMed] [Google Scholar]
- 32. Luo J, Chen J, He L. mir‐129‐5p attenuates irradiation‐induced autophagy and decreases radioresistance of breast cancer cells by targeting HMGB1. Med Sci Monit. 2015;21:4122‐4129. [DOI] [PMC free article] [PubMed] [Google Scholar]
Associated Data
This section collects any data citations, data availability statements, or supplementary materials included in this article.
Supplementary Materials


