Abstract
Glioblastoma (GBM) is a highly infiltrative and malignant primary brain tumor. Despite aggressive therapy, patients with GBM have a dismal prognosis with median survival of approximately 1 year. Tamoxifen (TAM), a selective estrogen receptor modulator (SERM), has been used to treat GBM for many years. ER‐α36 is a novel variant of estrogen receptor‐alpha66 (ER‐α66) and can mediate cell proliferation through estrogen or anti‐estrogen signaling in different cancer cells. Previously, we found that ER‐α36 was highly expressed in GBM and was involved in the tamoxifen sensitivity of glioblastoma cells. However, the molecular mechanism responsible has not been well established. Here, we found that ER‐α36 is highly expressed in glioblastoma specimens. We further found that ER‐α36 knockdown increased sensitivity of glioblastoma U87 cells to TAM and decreased autophagy in these cells. However, ER‐α36 overexpression decreased TAM sensitivity and induced autophagy. We also established TAM‐resistant glioblastoma U251 cells by a long‐term culture in TAM‐containing medium and found that TAM‐resistant cells showed a six‐fold increase of ER‐α36 mRNA expression and elevated basal autophagy. ER‐α36 knockdown in these TAM‐resistant cells restored TAM sensitivity. In addition, we recapitulated the physiologically relevant tumor microenvironment in an integrated microfluidic device, and U87 cells were treated with a gradient of TAM. We found that ER‐α36 expression is consistent with autophagy protein P62 in a three‐dimensional microenvironment. In summary, these results indicate that ER‐α36 contributes to tamoxifen resistance in glioblastoma cells presumably through regulation of autophagy.
Keywords: autophagy, ER‐α36, glioblastoma, tamoxifen, three‐dimensional microenvironment
1. INTRODUCTION
Glioblastoma (GBM) is a highly infiltrative and aggressive primary brain tumor, and the effectiveness of the conventional surgical, radiotherapeutic, and chemotherapeutic modalities remains poor. Patients with GBM have a dismal prognosis with median survival of only approximately 1 year1 with the vast majority of patients progressing within 6 months of diagnosis.2 The prognosis for patients with malignant gliomas has remained largely unchanged over the last two decades.
Tamoxifen (triphenylethylene compound, TAM) has been used as the first‐line treatment for estrogen receptor (ER)‐positive breast cancer for many years.3 However, the effectiveness of TAM therapy is limited as most advanced breast tumors eventually recur with acquired resistance despite initial responsiveness to TAM.4, 5 Previously, Wang et al6 reported cloning a 36‐kDa variant of ER‐α66, ER‐α36, that is mainly expressed in the cytoplasm and at the plasma membrane. ER‐α36 mediates rapid non‐genomic estrogen signaling such as the ERK1/2 and the PI3K/AKT pathways. ER‐α36 lacks both AF‐1 and AF‐2 transcriptional activation domains and retains the DNA‐binding and dimerization domain, and partial ligand‐binding domains of the 66 kDa ER‐α (ER‐α66).7, 8 ER‐α36 has a unique 27 amino acid domain to replace the last 138 amino acids encoded by exons 7 and 8 of ER‐α66. Different groups reported that ER‐α36 is expressed in human breast cancer, human bone tissue, glioma cells, hippocampus, and neuron‐like PC12 cells.9, 10, 11 Li et al12 found that ER‐α36 is involved in development of acquired TAM resistance by regulating the growth status switch in breast cancer cells.
Several studies have reported that TAM showed anti‐glioma activity in vitro and in vivo.13, 14 GBM patients responded to chronic high‐dose TAM alone or in combination with other cytotoxic agents, such as temozolomide, procarbazine and radiotherapy;15, 16, 17 however, in several institution trials, TAM showed minimal activity in GBM patients with recurrent glioblastoma.18 Clinical studies indicated most GBM responding initially to TAM treatment recurred as a TAM‐resistant tumor. A subset of patients were observed to benefit from the extended use of TAM.19 TAM has been shown to inhibit glioma cell proliferation and induce apoptosis through activation of multiple upstream pathways in vitro.20 Our laboratory reported that ER‐α36 is involved in the regulation of tamoxifen sensitivity in glioblastoma cells, suggesting a possible role of ER‐α36 in TAM resistance.9
Autophagy, a lysosome‐dependent degradation pathway of self‐constituents and in response to nutrient starvation or oxidative stress, leads to the formation of amino acids, fatty acids and ATP, hence ensuring homeostasis and cell survival.21 It is now widely accepted that in response to various chemotherapeutic drugs, radiation, and targeted therapeutics, dying cells show large‐scale accumulation of autophagic vacuoles.22 Autophagy is also observed in the case of GBM in vitro and in vivo.23, 24 TAM is widely accepted as a potent autophagy inducer.25 Graham et al26 reported that TAM induces autophagic death in GBM cell lines and could provide new therapies for glioblastoma patients. Kohli et al reported that high levels of TAM could induce autophagy in malignant peripheral nerve sheath tumors through the K‐Ras signaling pathway, increasing the antitumor effect of TAM.13 In addition to apoptotic cell death, cells treated with TAM also show large‐scale autophagic vacuole (AV) accumulation, suggesting a possible role for autophagy in TAM‐induced cell death.27
In the present study, we studied the growth inhibitory activity of TAM in GBM U87 and U251 cells. We found that high levels of ER‐α36 resisted TAM‐mediated cell apoptosis through autophagy induction by inhibition of the AKT/mTOR signaling pathway. We found that ER‐α36 expression attenuated TAM growth inhibitory activity. In addition, we also found surprisingly large consistent levels of ER‐α36 and autophagy protein P62 expression. These results provided novel insights into the underlying mechanism of the antiproliferative properties of TAM and generated new opportunities for future treatment of GBM.
2. MATERIALS AND METHODS
2.1. Reagents
Tamoxifen, estrogen receptor antagonist ICI182 780, subtype selective ERα agonist PPT (4,4′,4″‐(4‐propyl‐1H‐pyrazole‐1,3,5‐triyl) trisphenol), autophagic inhibitor 3‐MA (3‐methyladenine) and CQ (chloroquine) were purchased from Sigma (St Louis, MO, USA). Rabbit polyclonal anti‐ER‐α36 antibody, ER‐α36 expression vector and ER‐α36 specific modulator (IC162) were from Dr ZY Wang (Creighton University Medical School). Rabbit monoclonal anti‐p‐Akt, anti‐Akt, anti‐p‐mammalian target of rapamycin (mTOR), anti‐mTOR, anti‐Bcl‐2 and mouse monoclonal anti‐glial fibrillary acidic protein (anti‐GFAP) were purchased from Cell Signaling Technology (Boston, MA, USA). Rabbit monoclonal anti‐LC3B was purchased from Abgent (San Diego, CA, USA), anti‐β‐actin was purchased from Boster (Wuhan, China), and rabbit polyclonal anti‐GAPDH, P53, and caspase3 were from Proteintech (Wuhan, China).
2.2. Tumor specimens
From 2004 to 2015, a total of 31 glioblastoma tissue samples were obtained from patients at the First Affiliated Hospital of Dalian Medical University. Patients with infiltrative glioblastoma were aged between 25 and 83 years. No patients received any radiation, chemotherapy, or endocrine therapy before surgical resection. Their relatives gave written informed consent which was approved by the Ethics Committee on the Use of Human Subjects (The First Affiliated Hospital of Dalian Medical University).
2.3. Cell culture, treatment and viability assay
Glioblastoma U87 and U251 were obtained from ATCC (Manassas, VA, USA). Stable cell line (U87‐36KD) was established as described in our previous study.9 All cells were maintained in DMEM with 10% FBS at 37°C in 5% CO2. For TAM treatment, cells were maintained in phenol red‐free DMEM media with 5% charcoal‐stripped FBS (Hyclone, South Logan, UT, USA) for 24 hours. The cells were then treated with TAM for different time periods as indicated.
For cell viability assay, cells were treated with different concentrations of TAM, or vehicle (DMSO) as control. Cells (2.5 × 10⁴/mL) were seeded into 96‐well dishes, and cell viability was analyzed using the MTT method after different time periods.
2.4. Transfection
Cells were seeded at 3 × 10⁵ in six‐well plates or cultured for 24 hours before transfection. ER‐α36 shRNA (1 μg) and 4 μg ER‐α36 expression vector was mixed with Lipofectamine 2000 reagent (Thermo Fisher Scientific, Waltham, MA, USA) and incubated for 20 minutes at room temperature before addition to cultured cells. Efficiency of siRNA knockdown was assessed with western blot and RT‐PCR analysis.
2.5. Western blot
Cells were lysed in a cold lysis buffer. Concentration of total protein was determined by the Bradford method. Proteins were separated by SDS‐PAGE analyzed with western blot as described previously.9
2.6. RNA purification and real‐time PCR
TRIzol RNA purification reagent was used to extract total RNA. Total RNA (1 μg) was reversely transcribed using the ProtoScript II RT‐PCR kit (Takara, Dalian, China). Real‐time PCR analysis of ER‐α36, BECLIN‐1, ATG‐5, ATG‐12, and p62 was carried out using gene‐specific primers as follows. ER‐α36: forward, 5′‐CCAAGAATGTTCAACCACAACCT‐3′, reverse, 5′‐GCACGGTTCATTAACATCTTTCTG‐3′; BECLIWN‐1: forward, 5′‐ATGCAGGTGAGCTTCGTGTG‐3′, reverse, 5′‐CTGGGCTGTGGTAAGTAATGGA‐3′; ATG‐5: forward, 5′‐AAAGACCTTCTGCACTGTCCATC‐3′, reverse, 5′‐AATCCCATCCAGAGTTGCTTGT‐3′; ATG‐12: forward, 5′‐ATGAAAACAAAGAAGTGGGCAGTAG‐3′, reverse, 5′‐GGTCTGGGGAAGGAGCAA A‐3′; p62: forward, 5′‐GAGGGGAAAATATCAGTTATGAGCA‐3′, reverse, 5′‐TGGAATAAGGTGGGGAGAAGAA‐3′; hGAPDH: forward, 5′‐GGCACAGTCAAGGCTGAGAATG‐3′, reverse, 5′‐ATGGTGGTGAAGACGCCAGTA‐3′.
2.7. Acridine orange staining
Cells (5 × 10³) were seeded onto glass coverslips coated with poly‐l‐lysine. Cells were treated with different concentrations of TAM and then fixed with methanol/ethanol for 10 minutes, washed with PBS for 3 times. Cells were exposed to 1 μg/mL acridine orange (AO) for 30 minutes at 37°C and washed with PBS three times. CaCl2 was used as color separation for 40 minutes. Fluorescent signals were detected and photographed with a fluorescence microscope (Olympus IX51; Olympus, Tokyo, Japan). Quantitative statistics were calculated by ImageJ software (NIH, Bethesda, MD, USA)
2.8. Measurement of mitochondrial membrane potential
To assess mitochondrial membrane potential, rhodamine‐123 was used. U87 and U251 were seeded at 5 × 10⁵/mL in six‐well plates for 24 hours. Cells were treated with 5 μmol/L TAM for different time periods and washed twice with PBS. The cells were then treated with 1 μmol/L rhodamine‐123 for 30 minutes at 37°C, and analyzed with flow cytometry (BD Accuri C6 New Jersey, USA).
2.9. Immunohistochemistry
Immunohistochemical staining was carried out using S‐P kits (Zhongshan Goldenbridge Biotechnology, Beijing, China). Extent and cellular distribution of staining was evaluated by two investigators. ER‐α36 expression in glioblastoma samples was determined positive when more than 10% of the tumor cells showed ER‐α36 expression.
2.10. Immunofluorescence
Slides were deparaffinized with xylene, rehydrated with ethanol, and then antigen retrieval was carried out in 10 mmol/L citrate buffer. After blocking with 5% BSA for 1 hour, the samples were incubated with specific antibodies (ER‐α36, P62, Ki67, GFAP) at 4°C overnight, followed by incubation with fluorescein‐conjugated goat antimouse/rabbit antibodies (Zhongshan Goldenbridge Biotechnology). Fluorescent signals were detected and photographed with a fluorescence microscope (Olympus IX51; Olympus). For GBM spheroid analysis, fluorescent signals were detected by confocal microscopy (Leica SP8; Leica, Wetzlar, Germany).
2.11. Generation of TAM‐resistant cell line
Glioblastoma U251 cells were maintained in culture medium containing increasing concentrations of TAM for several weeks until all cells grew well in the medium containing 10 μmol/L TAM. The established TAM‐resistant U251 cell line was named U251/TAM.
2.12. Invasion model establishment on a microfluidic device
A microfluidic device was used for 3D perfusion culture, which was composed of a Poly‐dimethylsiloxane (PDMS; Sylgard 184; Dow Corning, Midland, MI, USA) microfluidic chip and a PDMS‐coated glass slide. The microfluidic chip contained a concentration gradient generator (CGG) unit and an open array of parallel chambers. These two parts were assembled to seal the microfluidic culture chambers and detached for sample collection.
U87 suspensions at 3.5 × 10⁵ cells/mL were dropped onto the PDMS substrate, aligning with the chambers in the microfluidic chip. Hanging drop arrays were generated on the inverted PDMS surface. Rat tail collagen type I (Shengyou Biotechnology Co., Ltd, Zhejiang, China) at 1.5 mg/mL was used as the U87 spheroid encapsulating ECM. For TAM treatment assays, spheroids were maintained in free red‐phenol with 2.5% charcoal‐stripped FBS for 24 hours. TAM was added to one of the fluidic inlets and culture medium was added to the other inlet with flow rates of 0.5 μL/min. The perfusion culture was maintained for 24 hours.
For viability analysis, spheroid‐collagen blocks were stained with 0.1% calcein/propidium iodide (PI)/Hoechst 33324 (Solarbio, Beijing, China) for 30 minutes at 37°C. Immunostaining of the collected spheroids was used to quantify the survival ratio of GBM cells. Fluorescent photographs were taken using a confocal microscope (Leica SP8; Leica). Quantitative statistics were calculated using Image‐Pro Plus software (IPP 5.0; Media Cybernetics, Rockville, MD, USA).
2.13. Statistical analysis
All data were expressed as mean ± SE. Unpaired Student's t test was used to test for statistical significance between the control and test groups. Comparisons of multiple groups were analyzed using one‐ or two‐way ANOVA followed by post‐hoc Tukey's test. P value <.05 was considered significant.
3. RESULTS
3.1. ER‐α36 expression determined TAM sensitivity in glioblastoma cells
ER‐α36 expression is associated with TAM resistance in human breast cancer.28 To determine the expression pattern of ER‐α36 in glioblastoma specimens, immunohistochemical (IHC) assays were carried out on tissue samples from 26 glioblastoma patients using an ER‐α36‐specific antibody. ER‐α36 was overexpressed in 25 out of 26 (96.2%) of the grade III‐IV glioblastoma samples but was barely detectable in grade I specimens (Figure 1A). Regarding cellular localization of ER‐α36 within grade III‐IV glioblastoma, we found that ER‐α36 was located in the nucleus alone (16%), the cell membrane or cytoplasm alone (8%), or diffusely throughout the cell (76%). Figure 1B shows that ER‐α36 is coexpressed with the astrocyte marker GFAP in glioblastoma tissues, and the level of ER‐α36 was higher compared to grade I patients. We examined ER‐α36 expression in U87 and U251 cells. As shown in Figure 1C, ER‐α36 staining had stronger signals in U87 cells compared to U251 cells. Western blot analysis further confirmed this result (Figure 1D). We then decided to examine TAM sensitivity in these cells. The glioblastoma cells were treated with different concentrations of TAM for 24 hours and cell viability was assessed with the MTT assay. As shown in Figure 2A and B, cells treated with TAM showed less viability compared to the cells treated with vehicle. U251 cells were more sensitive to TAM compared to U87 cells (Figure 2A,B). We treated cells with 5 μmol/L TAM for different time periods and found that U251 cells were more sensitive to TAM compared to U87 at the time point of 4 hours. We examined ER‐α36 expression in cells treated with TAM and found that 1 μmol/L TAM could increase ER‐α36 expression in U251 cells whereas it required 5 μmol/L TAM in U87 cells (Figure 2C,D). Thus, our results showed that ER‐α36 is expressed in glioblastoma tissues and suggested that ER‐α36 expression is involved in the regulation of TAM sensitivity in glioblastoma cells.
Figure 1.
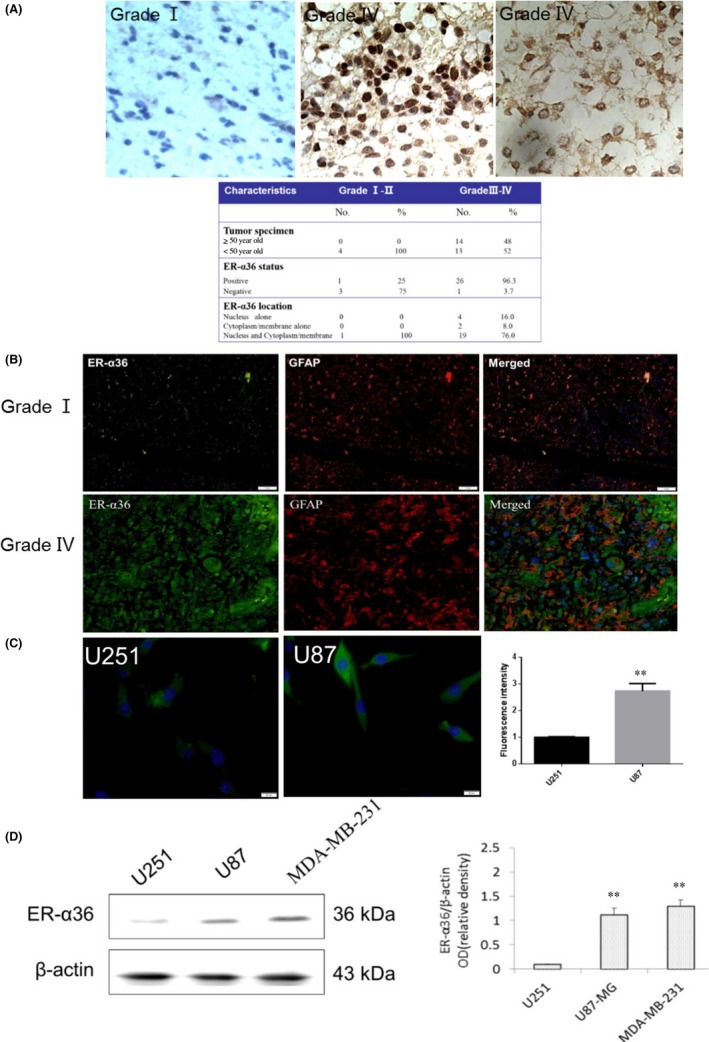
ER‐α36 was overexpressed in glioblastoma specimen. A, Immunohistochemistry stained ER‐α36 expression in human glioblastoma. B, Immunofluorescence (IF) staining of ER‐α36 (green) and anti‐glial fibrillary acidic protein (GFAP) (red) in human glioblastoma. Nuclei were counterstained with DAPI (blue). C, IF staining of ER‐α36 in U87 and U251 cells (green). Nuclei were counterstained with DAPI (blue). D, Western blot analysis shows the expression of ER‐α36 in U87 and U251 cells, with β‐actin as internal control. (n=3‐5, **P < 0.01) ER, estrogen receptor
Figure 2.
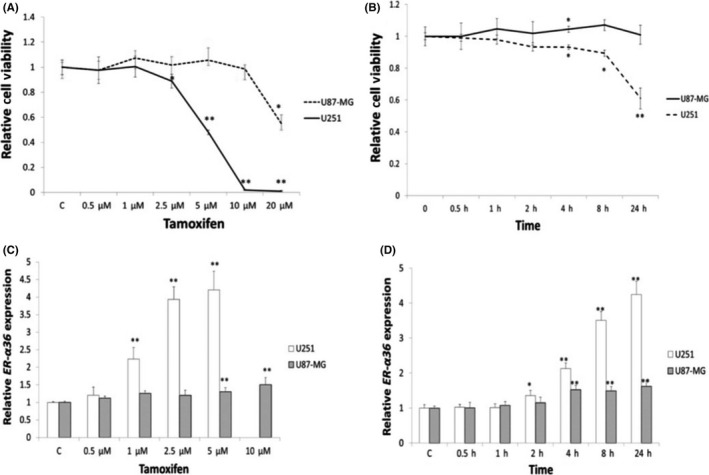
High expression of ER‐α36 was resistant to tamoxifen (TAM) in glioblastoma cells. Cells were treated with indicated concentrations of TAM for 24 h or 5 μmol/L TAM for different time periods. A,B, MTT analysis of cell viability of glioma cells. C,D, qPCR analysis of ER‐α36 in U87 and U251 cells (n = 5, *P < 0.05, **P < 0.01 vs control). ER, estrogen receptor
3.2. Tamoxifen induced autophagy in glioblastoma cells
Change of mitochondrial membrane potential is considered an early apoptosis marker.29 To determine the effect of TAM on cell viability, we examined mitochondrial membrane potential in glioma cells treated with 5 μmol/L TAM. As shown in Figure 3A, TAM at 5 μmol/L failed to change the mitochondrial membrane potential in U87 cells. However, when U251 cells were treated with 5 μmol/L TAM, the cells showed decreased mitochondrial membrane potential compared to the control cells treated with vehicle. We also examined the apoptotic protein Bcl‐2 and P53 expression. Results showed that 5 μm/L TAM could not upregulate P53 in U87 cells, whereas it increased the expression of Bcl‐2. P53 was increased, and Bcl‐2 was decreased in U251 cells (Figure 3B). To determine whether TAM also induces autophagy in glioblastoma cells, AO was used to stain cells. As shown in Figure 3C, TAM induced the accumulation of AO in the cytoplasm of U87 cells whereas less accumulation of AO was observed in the control cells. In addition, TAM also induced accumulation of LC3‐II in U87 cells (Figure 3D). Akt/mTOR signaling is involved in positive regulation of autophagy.30, 31 To determine whether TAM induces phosphorylation of Akt and mTOR in glioblastoma cells, we treated cells with TAM at 5 μmol/L for 4 hours. As shown in Figure 3E, TAM treatment decreased phosphorylation levels of both Akt and mTOR in U87 cells. To further confirm these results, we measured the expression levels of Beclin‐1, ATG‐5, ATG‐12 and P62 through qPCR. As shown in Figure 3F, TAM treatment increased levels of Beclin‐1, ATG‐5, ATG‐12 expression and decreased P62 expression in U87 cells.
Figure 3.
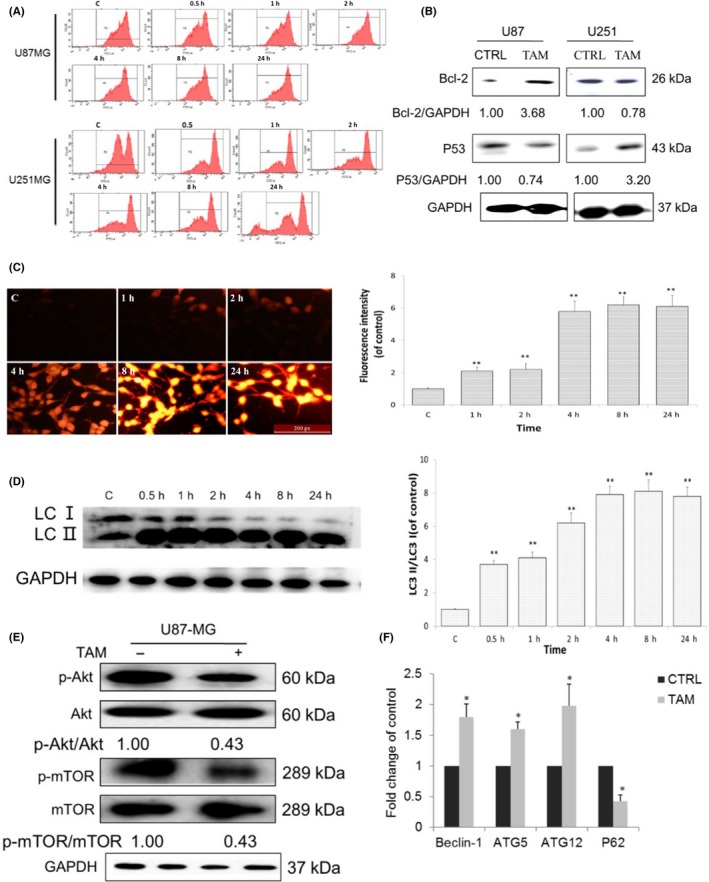
Tamoxifen (TAM) induced glioma cell autophagy. A, U87‐MG cells were treated with 5 μmol/L TAM for different time periods. Mitochondrial membrane potentia was analyzed using flow cytometry. B, Western blot analysis of the expression of P53 and Bcl‐2. C, Cells were treated with 5 μmol/L TAM for different time periods, and then stained with acridine orange and examined under a fluorescence microscope. D, Western blot analysis of the accumulation of LC3‐II in U87‐MG cells that were treated with TAM (5 μmol/L) for different time period. E, p‐Akt, Akt, p‐mTOR and mTOR protein levels were estimated by western blot analysis. F, RT‐PCR examination of autophagy pathway in mRNA expression. Beclin‐1, ATG‐5, ATG‐12, P62 (n = 5, *P < 0.05, **P < .01 vs control). mTOR, mammalian target of rapamycin
3.3. ER‐α36 knockdown in U87 cells resulted in increased sensitivity to TAM
To examine the role of ER‐α36 in TAM sensitivity of glioblastoma cells, we established a U87 cell line with knocked‐down level of ER‐α36 expression using the shRNA method appropriately named U87‐36KD. We then treated these cells with different concentrations of TAM for different time periods. As shown in Figure 4A and B, U87‐36KD cells were more sensitive to TAM compared to U87/V cell transfected with empty vector. After TAM treatment, levels of LC3‐II/LC3‐I were far less in U87‐36KD cells compared to U87/V cells (Figure 4C). Thus, our results indicated that cells with lower levels of ER‐α36 expression are more sensitive to TAM.
Figure 4.
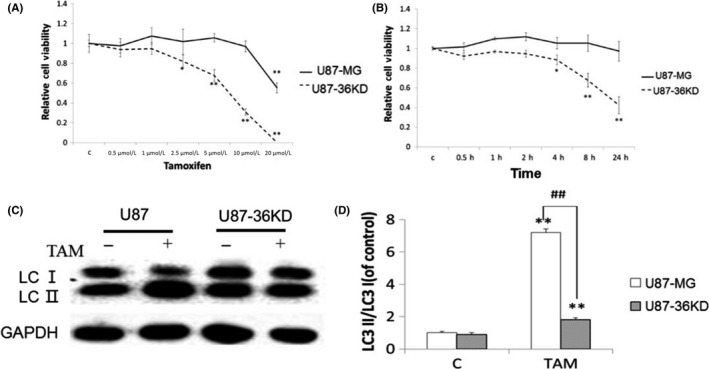
Knockdown of ER‐α36 in U87 cells leads to increased sensitivity to tamoxifen (TAM) and inhibited autophagy. A,B, MTT analysis of cell viability of glioma cells. C, Western blot analysis of the accumulation of LC3‐II (n = 3, *P < 0.05, **P < . 01 vs control) ##P < 0.01 U87‐36KD vs U87. ER, estrogen receptor
3.4. Overexpression of ER‐α36 in glioblastoma U251 cells led to decreased sensitivity to TAM
We then decided to verify whether ER‐α36 is involved in TAM sensitivity and TAM‐induced autophagy in glioblastoma cells. We transfected an ER‐α36 expression vector into U251 cells and established a cell line U251/36 (Figure 5A). When U251/36 cells were treated with different concentrations of TAM, we found that U251/36 cells were relatively more resistant to TAM compared with the control cells transfected with the empty vector (Figure 5B). We also found that LC3‐II/LC3‐I accumulated more in U251/36 cells compared to U251/V after TAM treatment (Figure 5C).
Figure 5.
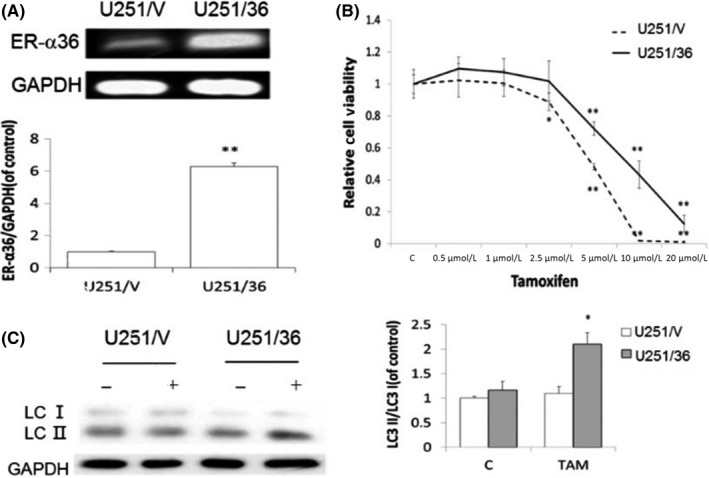
Overexpression of ER‐α36 in U251 cells leads to decreased sensitivity to tamoxifen (TAM) and enhanced autophagy. U251 cells overexpressed ER‐α36. A, RT‐PCR examination of ER‐α36 expression. B, MTT analysis of cell viability of glioma cells. C, Western blot analysis of the accumulation of LC3‐II (n = 4, **P < .01, *P < .05 vs control). ER, estrogen receptor
3.5. Tamoxifen‐resistant U251/TAM cells showed high levels of ER‐α36 expression
To confirm the involvement of ER‐α36 in TAM resistance of glioblastoma cells, we established a TAM‐resistant cell line U251/TAM. Western blot analysis showed that the expression level of ER‐α36 in U251/TAM cells was greatly increased compared to the parental U251 cells (Figure 6A). When we knocked down ER‐α36 expression in U251/TAM through the shRNA method (Figure 6B), we found that knockdown of ER‐α36 expression restored TAM sensitivity in U251/TAM cells (Figure 6C). In addition, we also found that TAM treatment enhanced autophagy in U251/TAM cells (Figure 6D). Our results thus provided evidence to support the view that high levels of ER‐α36 expression promote TAM resistance, which is accompanied by an increase of autophagy induced by TAM.
Figure 6.
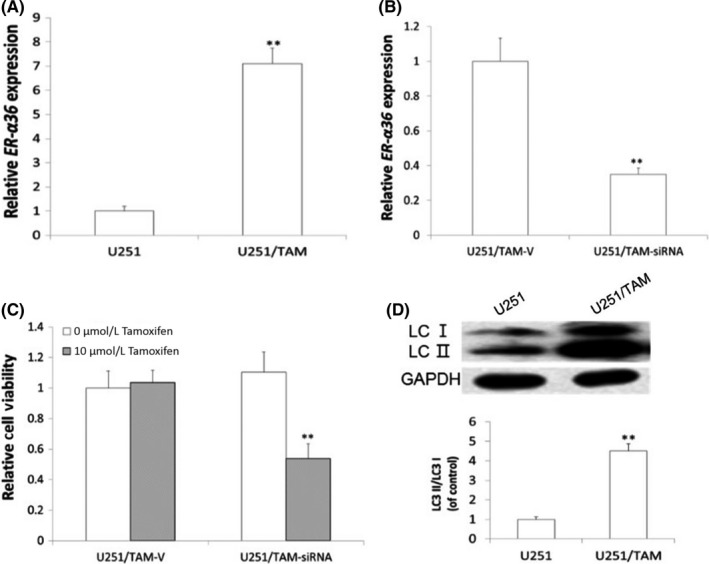
U251/TAM shows increased levels of ER‐α36, together with increased cell autophagy. A, RT‐PCR examination of ER‐α36 expression in U251 and U251/TAM. B, Knockdown of ER‐α36 by shRNA method. RT‐PCR examination of ER‐α36 expression in U251/TAM‐V and U251/TAM‐siRNA. C, MTT analysis of cell viability of glioma cells. D, Western blot analysis of accumulated LC3‐II (n = 4, **P < .01 vs control). ER, estrogen receptor; TAM, tamoxifen
3.6. ER‐α36 specific modulator IC162 enhanced autophagy induced by TAM
To examine whether TAM induces autophagy through ER‐α36, we treated U87 cells with ER‐α36‐specific modulator IC162, ER‐α‐specific agonist PPT, ER inhibitor ICI182,780 and autophagy inhibitor 3‐MA and CQ. MTT analysis showed that 1 nmol/L IC162, 0.5 μmol/L PPT, 1 μmol/L ICI182,780, 3‐MA and CQ failed to change U87 cell viability. However, cells treated with IC162 together with 1 μmol/L TAM showed a significantly increased growth rate compared with control. U87 cells treated with ICI182,780, PPT or autophagy inhibitors 3‐MA and CQ together with 1 μmol/L TAM showed decreased growth rate compared to control (Figure 7A).
Figure 7.
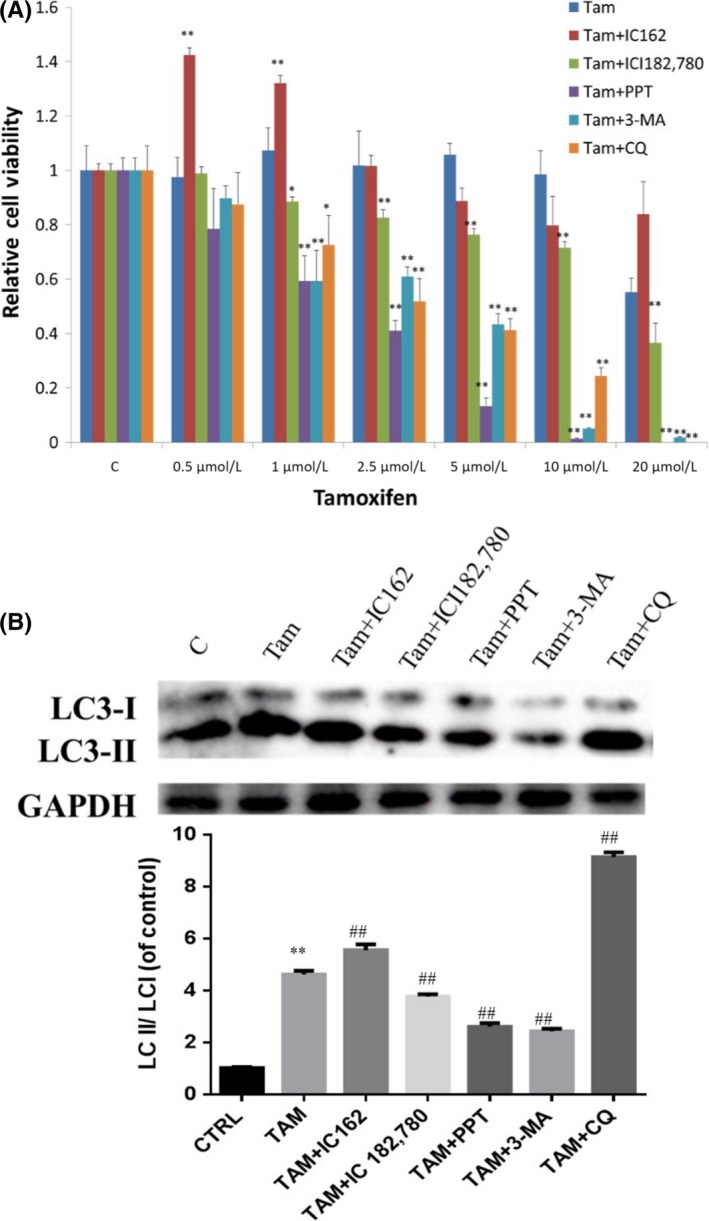
ER‐α36‐specific modulator IC162 enhanced autophagy, which was induced by tamoxifen (TAM). Combined treatment of TAM with IC162, ICI182,780, PPT, 3‐MA or CQ on glioblastoma U87 cells. All groups underwent agonist or inhibitor precondition for 2 h, then were exposed to 5 μmol/L TAM for 0 h or 4 h. A, MTT analysis of the viability of glioma cells. B, Western blot analysis of the accumulation of LC3‐II (n = 3, **P < .01 vs control; ## P < .01 vs TAM). 3‐MA, methyladenine; CQ, chloroquine; ER, estrogen receptor
To determine whether ER‐α36 is involved in the enhanced autophagy induced by TAM, we treated cells with IC162, PPT, ICI182,780 separately with TAM. Western blot analysis showed that TAM alone increased LC3‐II expression that was lower compared to the cells treated with TAM and IC162 together, suggesting that ER‐α36 activation resulted in stronger autophagy induced by TAM. PPT and ICI182,780 failed to show this activity. The autophagy inhibitors 3‐MA and CQ potently attenuated autophagy induced by TAM (Figure 7B).
3.7. Tamoxifen induced U87 glioblastoma cell autophagy in a three‐dimensional microenvironment
To reproduce the real and complex tumor microenvironment of the human body, we constructed the complexity and pathophysiology of in vivo glioblastoma microenvironments in terms of their gene expression profiles, signaling pathway activity and drug sensitivity through in vitro 3D culture models. Based on spheroid generation and microfluidic perfusion culture method, we first examined the expression of ER‐α36 in 3D culture models. As shown in Figure 8, ER‐α36 was expressed in the center of the spheroid at low levels (38%), and highly expressed in invading cells (87%). We examined the expression of the cell proliferation marker Ki67. The number of ER‐α36/Ki67‐positive cells in the invading group was 2.14‐fold that of the cells in the center of the spheroid.
Figure 8.
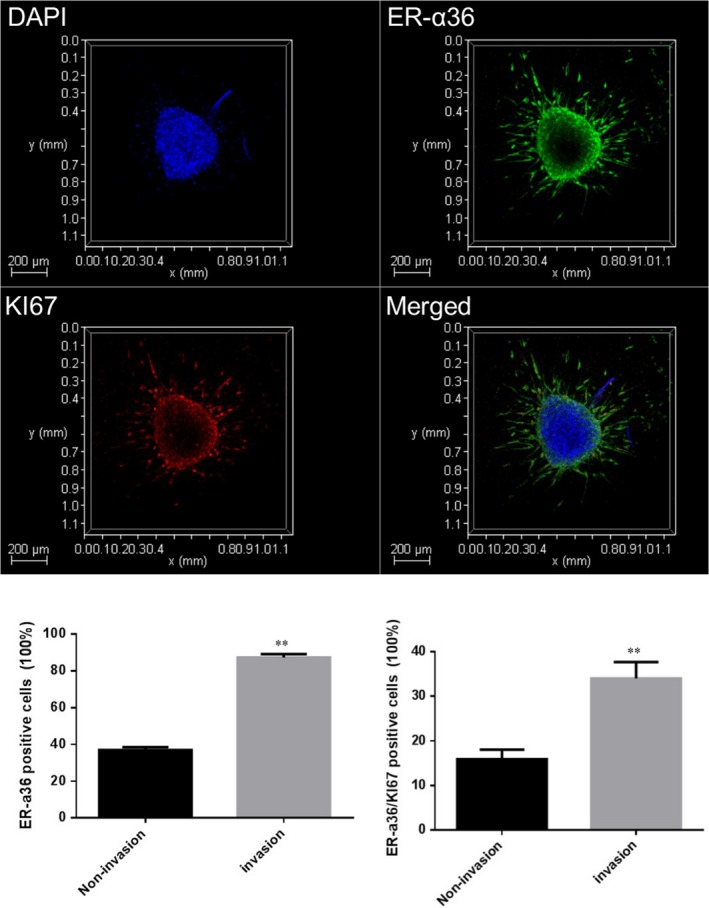
Characterization of ER‐α36 expression of U87 cells in a 3D microenvironment. Immunofluorescence analysis of the amount of ER‐α36 (green) and Ki‐67 (red) in U87 cells through confocal images. (n = 3‐5,**P < 0.01 vs non‐invasion) ER, estrogen receptor
To investigate the effects of TAM on U87 cells in a 3D microenvironment, U87 spheroids were treated with different concentrations of TAM for 24 hours. For live/dead analysis, cells were stained with calcein/PI. As shown in Figure 9A, 10 μmol/L TAM slightly increased the number of red fluorescence cells, suggesting this concentration slightly promoted total cell death, but was not significant. With increasing concentrations, the inhibitory effects of TAM were enhanced, and 20 μmol/L and 30 μmol/L TAM significantly promoted total cell death. For the non‐invading cells, 10 μmol/L TAM significantly increased the ratio of cell death compared to the control. For the invading cells, 10 μmol/L TAM did not affect cell death and there was no cell invasion at 30 μmol/L. Spheroids exposed to 10 μmol/L TAM showed decreased expression of the autophagic P62 protein in the center of the spheroid, suggesting that this concentration can induce autophagy and low levels of apoptosis (Figure 9). However, 10 μmol/L TAM did not affect P62 protein expression in the invading cells. TAM (20 and 30 μmol/L) induced excessive cell autophagy and cell death. These results suggest that TAM‐induced glioblastoma cell autophagy may be associated with the expression of ER‐α36.
Figure 9.
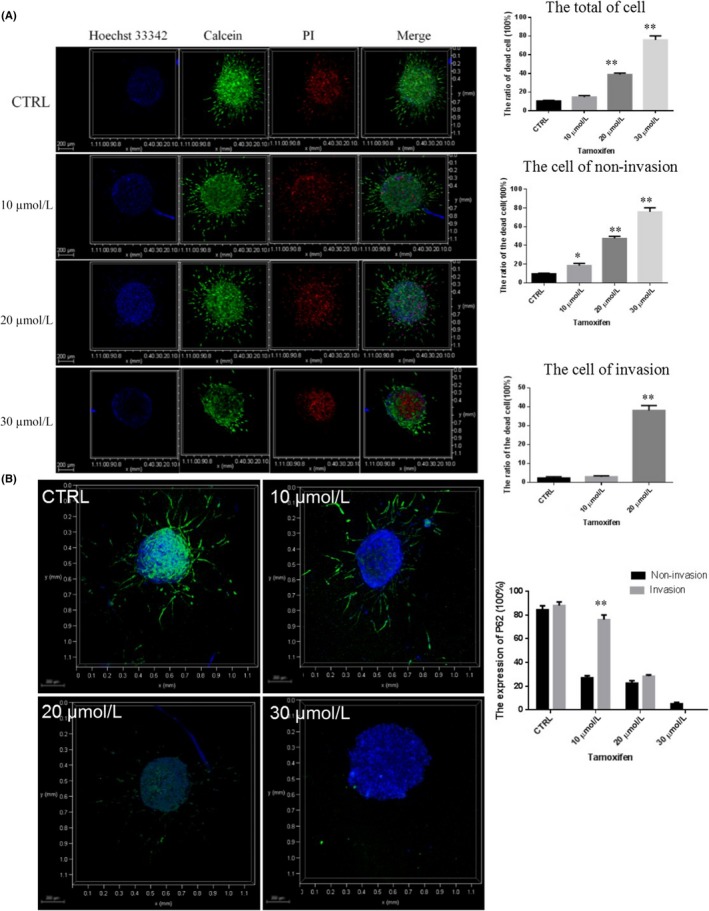
Effect of tamoxifen (TAM) on U87 cell viability and autophagy in a 3D microenvironment. A, Assays of the viability of 3D U87 cells under TAM treatment with different drug concentrations (0, 10, 20, and 30 μmol/L). Scale bars, 200 μm, n = 3. B, Expression of autophagy protein P62 (green) in U87 cells under treatment of TAM at 0, 10, 20, and 30 μmol/L for 24 h, respectively. (Scale bars = 200 μm, n = 3, *P < 0.05, **P < 0.01 VS CTRL). PI, propidium iodide
4. DISCUSSION
The present study found that glioblastoma tissues and glioblastoma U87 and U251 cells express ER‐α36, a variant of estrogen receptor, predominantly in the cytoplasm and at the plasma membrane. TAM was able to inhibit growth of U87 and U251 cells, which was regulated by the level of ER‐α36 expression in these cells in vivo and in a 3D microenvironment.
Tamoxifen is a selective estrogen receptor modulator with both ER agonist/antagonist activities, which has been used for the treatment for ER‐positive breast cancer in the past 40 years.32, 33 Previously, several studies reported that tamoxifen has inhibitory activity in glioblastoma cells both in vitro and in vivo.14 However, many glioblastoma patients and most glioblastoma cells such as U87 and U251 lack expression of classic ER‐α (ie, are ER‐negative). However, the mechanism by which TAM inhibits glioblastoma and glioma cells is unclear as these cells are mostly ER‐negative. In addition, TAM is effective only in a subset of glioblastoma patients.34, 35 The underlying mechanism of this de novo TAM resistance is unclear. This study found that ER‐α36 is coexpressed with GFAP in ER‐negative specimens from glioma patients. In a previous study, we found that glioblastoma U87 and U251 cells lack 66‐kDa ER‐α (ER‐α66) expression but express ER‐α36 and mediated TAM resistance.9 Interestingly, TAM sensitivity depends on the level of ER‐α36 expression; U87 cells that express more ER‐α36 are less sensitive to TAM compared to U251 cells that express less ER‐α36. ER‐α36 is a novel variant of ER‐α66 that is transcriptionally regulated differently from ER‐α66 and is highly expressed in ER‐negative breast cancer cells that lack ER‐α66 expression.3, 36, 37 Previously, ER‐α36 was reported to mediate agonist activity in human breast cancer and endometrial cancer cells.4 Recently, it has been reported that ER‐α36 expression is involved in TAM resistance of breast cancer.38 Thus, ER‐α36 may mediate agonist activity of TAM and confer TAM resistance to cells.
Previously, the role of autophagy in cancer therapy has been proposed. It is now well accepted that in response to various chemotherapeutic drugs, radiation, and targeted therapeutics, cancer cells show large‐scale accumulation of autophagic vacuoles.39, 40, 41 It has been reported that TAM induces autophagy in tumor cells.26, 42 Herein, Figure 3 showed that TAM increased autolysosome and the ratio of LC3II/LC3I mainly in U87 cells while potently inducing apoptosis in U251 cells. U87 cells showed more cell viability after TAM treatment compared to U251 cells. The Akt/mTOR pathway is involved in metabolism, cell viability, tumorigenesis and the autophagic process and is responsible for chemoresistance in gliomas.43, 44 The studies used LY294002, UCN‐01 (Akt inhibitor) and rapamycin treat glioma cells, found that they can significantly inhibit glioma survival.45, 46 Figure 3 shows that TAM inhibited the Akt/mTOR pathway in U87 cells. More autophagy but less apoptosis increases cell viability, thus establishing a pro‐death role for autophagy. Today, the effect of autophagy on tumor‐cell survival seems contradictory. In the early stages of tumorigenesis, it would limit cell proliferation. However, as tumor size increases, autophagy may promote the survival of tumor cells in the nutrient‐deficient and hypoxic tumor regions.
Next, we found that ER‐α36 has a protective role in TAM‐induced death of glioblastoma cells using cells with different levels of ER‐α36 expression. We attempted to test the role of ER‐α36 by knockdown or overexpressing ER‐α36 in U87 and U251 cells and observed significant protection from TAM‐mediated cells apoptotic through autophagy. Previously, Li and colleagues found that TAM‐resistant breast cancer MCF7 cells (MCF7/TAM) showed increased expression of ER‐α36 and decreased expression of ER‐α66.12 In the present study, we established a TAM‐resistant cell line U251/TAM from ER‐α36 low expression glioblastoma cell U251. U251/TAM cells have greatly increased ER‐α36 expression and increased ratio of LC3II/LC3I compared to parental U251 cells. We used ER‐α36 shRNA to knock down ER‐α36 expression in U251/TAM cells and found that cells with knocked‐down levels of ER‐α36 expression had decreased viability. IC162 is an ER‐α36‐specific regulator, which is an ER‐α36 antagonist at a high dose, and an ER‐α36 agonist at a low dose. TAM could significantly increase cell viability and activate the autophagy pathway. When we treated cells with autophagy inhibitor 3‐MA and CQ, TAM inhibited cell viability and autophagy. Together, these findings suggest that ER‐α36 plays an increased role in autophagy during the generation of acquired TAM resistance.
Traditional two‐dimensional (2D) cell cultures differ greatly from the complex and micro‐scale environment of the human body.47 There has been abundant evidence suggesting that 3D culture models may more accurately reproduce the complexity and pathophysiology of in vivo tumor microenvironments.48, 49 Three‐dimensional culture models have been widely used in analytical chemistry and life science. In the present study, 3D spheroids were generated and cultured in a microfluidic device, which is a valid model for reproducing the properties of tumor micro‐regions. Through investigation in a 3D model, we found TAM at 10 μmol/L slightly increased cell death in non‐invasion cells and had no effect in invasion cells, whereas it induced P62 degradation and mediated U87 cell spheroid autophagy, suggesting that this concentration can induce autophagy and low levels of apoptosis (Figure 9B). Papers reported that cells treated with TAM induced autophagy and then induced cell apoptosis or death.50, 51 ER‐α36 was highly expressed at the edge of the sphere, where there was more resistance for TAM than at the center of the sphere (Figures 8 and 9). These results suggest that ER‐α36 could resist TAM‐mediated glioblastoma apoptosis or death.
In summary, the present study shows an ER‐α36 mechanism for glioblastoma cells resisting TAM. We found that ER‐α36 expressed in glioblastoma cells maintained resistance to TAM, suggesting that the autophagy pathway contributes to development and progression of glioblastoma. Thus, ER‐α36 could be a novel player in TAM‐induced autophagy and have a key role in glioblastoma of estrogen‐related tumors.
CONFLICTS OF INTEREST
Authors declare no conflicts of interest for this article.
ACKNOWLEDGMENTS
We would like to thank Dr ZY Wang (Creighton University Medical School) for providing the ER‐α36 antibody. We also thank Ryan Qin (Emory University, Atlanta, USA) for revising the language of the manuscript. This work was supported by grants (No. 30570225, 30970353) from the National Natural Science Foundation of China; The Natural Science Foundation of Liaoning Province, China (2015020568) and the scientific research project of the Education Department of Liaoning Province, China (L201783647).
Qu C, Ma J, Zhang Y, et al. Estrogen receptor variant ER‐α36 promotes tamoxifen agonist activity in glioblastoma cells. Cancer Sci. 2019;110:221–234. 10.1111/cas.13868
Qu, Ma and Zhang contributed equally to this work.
Contributor Information
Jing Liu, Email: liujing@dmu.edu.cn.
Wei Zou, Email: weizou60@126.com.
REFERENCES
- 1. Man J, Shoemake J, Zhou W, et al. Sema3C promotes the survival and tumorigenicity of glioma stem cells through Rac1 activation. Cell Rep. 2014;9:1812‐1826. [DOI] [PMC free article] [PubMed] [Google Scholar]
- 2. Li XT, Ju RJ, Li XY, et al. Multifunctional targeting daunorubicin plus quinacrine liposomes, modified by wheat germ agglutinin and tamoxifen, for treating brain glioma and glioma stem cells. Oncotarget. 2014;5:6497‐6511. [DOI] [PMC free article] [PubMed] [Google Scholar]
- 3. Zhao Y, Deng C, Lu W, et al. let‐7 microRNAs induce tamoxifen sensitivity by downregulation of estrogen receptor alpha signaling in breast cancer. Mol Med. 2011;17:1233‐1241. [DOI] [PMC free article] [PubMed] [Google Scholar]
- 4. Lin SL, Yan LY, Zhang XT, et al. ER‐alpha36, a variant of ER‐alpha, promotes tamoxifen agonist action in endometrial cancer cells via the MAPK/ERK and PI3K/Akt pathways. PLoS ONE. 2010;5:e9013. [DOI] [PMC free article] [PubMed] [Google Scholar]
- 5. Shi L, Dong B, Li Z, et al. Expression of ER‐{alpha}36, a novel variant of estrogen receptor {alpha}, and resistance to tamoxifen treatment in breast cancer. J Clin Oncol. 2009;27:3423‐3429. [DOI] [PMC free article] [PubMed] [Google Scholar]
- 6. Wang Z, Zhang X, Shen P, Loggie BW, Chang Y, Deuel TF. A variant of estrogen receptor‐{alpha}, hER‐{alpha}36: transduction of estrogen‐ and antiestrogen‐dependent membrane‐initiated mitogenic signaling. Proc Natl Acad Sci USA. 2006;103:9063‐9068. [DOI] [PMC free article] [PubMed] [Google Scholar]
- 7. Wang ZY, Yin L. Estrogen receptor alpha‐36 (ER‐alpha36): a new player in human breast cancer. Mol Cell Endocrinol. 2015;418(Pt 3):193‐206. [DOI] [PubMed] [Google Scholar]
- 8. Zheng Y, Zhang J, Xu ZZ, et al. Quantitative profiles of the mRNAs of ER‐alpha and its novel variant ER‐alpha36 in breast cancers and matched normal tissues. J Zhejiang Univ Sci B. 2010;11:144‐150. [DOI] [PMC free article] [PubMed] [Google Scholar]
- 9. Liu Y, Huang L, Guan X, et al. ER‐alpha36, a novel variant of ERalpha, is involved in the regulation of Tamoxifen‐sensitivity of glioblastoma cells. Steroids. 2016;111:127‐133. [DOI] [PubMed] [Google Scholar]
- 10. Ma YN, Han DN, Xu YH, et al. Knock‐down of ERalpha36 impacts the expression of differentiation protein in PC12 cells. Sheng Li Xue Bao. 2012;64:282‐288. [PubMed] [Google Scholar]
- 11. Han S, Zhao B, Pan X, et al. Estrogen receptor variant ER‐alpha36 is involved in estrogen neuroprotection against oxidative toxicity. Neuroscience. 2015;310:224‐241. [DOI] [PubMed] [Google Scholar]
- 12. Li G, Zhang J, Jin K, et al. Estrogen receptor‐alpha36 is involved in development of acquired tamoxifen resistance via regulating the growth status switch in breast cancer cells. Mol Oncol. 2013;7:611‐624. [DOI] [PMC free article] [PubMed] [Google Scholar]
- 13. Kohli L, Kaza N, Coric T, et al. 4‐Hydroxytamoxifen induces autophagic death through K‐Ras degradation. Cancer Res. 2013;73:4395‐4405. [DOI] [PMC free article] [PubMed] [Google Scholar]
- 14. Harmalkar M, Upraity S, Kazi S, Shirsat NV. Tamoxifen‐induced cell death of malignant glioma cells is brought about by oxidative‐stress‐mediated alterations in the expression of BCL2 family members and is enhanced on miR‐21 inhibition. J Mol Neurosci. 2015;57:197‐202. [DOI] [PubMed] [Google Scholar]
- 15. Spence AM, Peterson RA, Scharnhorst JD, Silbergeld DL, Rostomily RC. Phase II study of concurrent continuous Temozolomide (TMZ) and Tamoxifen (TMX) for recurrent malignant astrocytic gliomas. J Neurooncol. 2004;70:91‐95. [DOI] [PubMed] [Google Scholar]
- 16. Brandes AA, Ermani M, Turazzi S, et al. Procarbazine and high‐dose tamoxifen as a second‐line regimen in recurrent high‐grade gliomas: a phase II study. J Clin Oncol. 1999;17:645‐650. [DOI] [PubMed] [Google Scholar]
- 17. Baritchii A, Jurj A, Soritau O, et al. Sensitizer drugs for the treatment of temozolomide‐resistant glioblastoma. J BUON. 2016;21:199‐207. [PubMed] [Google Scholar]
- 18. Pollack IF, DaRosso RC, Robertson PL, et al. A phase I study of high‐dose tamoxifen for the treatment of refractory malignant gliomas of childhood. Clin Cancer Res. 1997;3:1109‐1115. [PubMed] [Google Scholar]
- 19. Broniscer A, Leite CC, Lanchote VL, Machado TM, Cristofani LM. Radiation therapy and high‐dose tamoxifen in the treatment of patients with diffuse brainstem gliomas: results of a Brazilian cooperative study. Brainstem Glioma Cooperative Group. J Clin Oncol. 2000;18:1246‐1253. [DOI] [PubMed] [Google Scholar]
- 20. He W, Liu R, Yang SH, Yuan F. Chemotherapeutic effect of tamoxifen on temozolomide‐resistant gliomas. Anticancer Drugs. 2015;26:293‐300. [DOI] [PMC free article] [PubMed] [Google Scholar]
- 21. Sharma K, Le N, Alotaibi M, Gewirtz DA. Cytotoxic autophagy in cancer therapy. Int J Mol Sci. 2014;15:10034‐10051. [DOI] [PMC free article] [PubMed] [Google Scholar]
- 22. Selvakumaran M, Amaravadi RK, Vasilevskaya IA, O'Dwyer PJ. Autophagy inhibition sensitizes colon cancer cells to antiangiogenic and cytotoxic therapy. Clin Cancer Res. 2013;19:2995‐3007. [DOI] [PubMed] [Google Scholar]
- 23. Zanotto‐Filho A, Braganhol E, Klafke K, et al. Autophagy inhibition improves the efficacy of curcumin/temozolomide combination therapy in glioblastomas. Cancer Lett. 2015;358:220‐231. [DOI] [PubMed] [Google Scholar]
- 24. Cheng YC, Hueng DY, Huang HY, Chen JY, Chen Y. Magnolol and honokiol exert a synergistic anti‐tumor effect through autophagy and apoptosis in human glioblastomas. Oncotarget. 2016;7:29116‐29130. [DOI] [PMC free article] [PubMed] [Google Scholar]
- 25. Qi H, Jiang Z, Wang C, et al. Sensitization of tamoxifen‐resistant breast cancer cells by Z‐ligustilide through inhibiting autophagy and accumulating DNA damages. Oncotarget. 2017;8:29300‐29317. [DOI] [PMC free article] [PubMed] [Google Scholar]
- 26. Graham CD, Kaza N, Klocke BJ, et al. Tamoxifen induces cytotoxic autophagy in glioblastoma. J Neuropathol Exp Neurol. 2016;75:946‐954. [DOI] [PMC free article] [PubMed] [Google Scholar]
- 27. Yamamoto T, Takabatake Y, Kimura T, et al. Time‐dependent dysregulation of autophagy: implications in aging and mitochondrial homeostasis in the kidney proximal tubule. Autophagy. 2016;12:801‐813. [DOI] [PMC free article] [PubMed] [Google Scholar]
- 28. Gu W, Dong N, Wang P, Shi C, Yang J, Wang J. Tamoxifen resistance and metastasis of human breast cancer cells were mediated by the membrane‐associated estrogen receptor ER‐alpha36 signaling in vitro. Cell Biol Toxicol. 2017;33:183‐195. [DOI] [PubMed] [Google Scholar]
- 29. Rohde K, Kleinesudeik L, Roesler S, et al. A Bak‐dependent mitochondrial amplification step contributes to Smac mimetic/glucocorticoid‐induced necroptosis. Cell Death Differ. 2017;24:83‐97. [DOI] [PMC free article] [PubMed] [Google Scholar]
- 30. Uematsu M, Nishimura T, Sakamaki Y, Yamamoto H, Mizushima N. Accumulation of undegraded autophagosomes by expression of dominant‐negative STX17 (syntaxin 17) mutants. Autophagy. 2017;13:1452‐1464. [DOI] [PMC free article] [PubMed] [Google Scholar]
- 31. Isakovic AM, Dulovic M, Markovic I, et al. Autophagy suppression sensitizes glioma cells to IMP dehydrogenase inhibition‐induced apoptotic death. Exp Cell Res. 2017;350:32‐40. [DOI] [PubMed] [Google Scholar]
- 32. Johansson H, Gray KP, Pagani O, et al. Impact of CYP19A1 and ESR1 variants on early‐onset side effects during combined endocrine therapy in the TEXT trial. Breast Cancer Res. 2016;18:110. [DOI] [PMC free article] [PubMed] [Google Scholar]
- 33. Heuson JC. Current overview of EORTC clinical trials with tamoxifen. Cancer Treat Rep. 1976;60:1463‐1466. [PubMed] [Google Scholar]
- 34. Zhang W, Couldwell WT, Song H, Takano T, Lin JH, Nedergaard M. Tamoxifen‐induced enhancement of calcium signaling in glioma and MCF‐7 breast cancer cells. Cancer Res. 2000;60:5395‐5400. [PubMed] [Google Scholar]
- 35. Kuo YC, Cheng SJ. Brain targeted delivery of carmustine using solid lipid nanoparticles modified with tamoxifen and lactoferrin for antitumor proliferation. Int J Pharm. 2016;499:10‐19. [DOI] [PubMed] [Google Scholar]
- 36. Zou Y, Ding L, Coleman M, Wang Z. Estrogen receptor‐alpha (ER‐alpha) suppresses expression of its variant ER‐alpha 36. FEBS Lett. 2009;583:1368‐1374. [DOI] [PMC free article] [PubMed] [Google Scholar]
- 37. Zhang X, Ding L, Kang L, Wang ZY. Estrogen receptor‐alpha 36 mediates mitogenic antiestrogen signaling in ER‐negative breast cancer cells. PLoS ONE. 2012;7:e30174. [DOI] [PMC free article] [PubMed] [Google Scholar]
- 38. Nass N, Kalinski T. Tamoxifen resistance: from cell culture experiments towards novel biomarkers. Pathol Res Pract. 2015;211:189‐197. [DOI] [PubMed] [Google Scholar]
- 39. Tylichova Z, Strakova N, Vondracek J, Vaculova AH, Kozubik A, Hofmanova J. Activation of autophagy and PPARgamma protect colon cancer cells against apoptosis induced by interactive effects of butyrate and DHA in a cell type‐dependent manner: the role of cell differentiation. J Nutr Biochem. 2016;39:145‐155. [DOI] [PubMed] [Google Scholar]
- 40. Jo YK, Roh SA, Lee H, et al. Polypyrimidine tract‐binding protein 1‐mediated down‐regulation of ATG10 facilitates metastasis of colorectal cancer cells. Cancer Lett. 2017;385:21‐27. [DOI] [PubMed] [Google Scholar]
- 41. Zhan L, Zhang Y, Wang W, et al. Autophagy as an emerging therapy target for ovarian carcinoma. Oncotarget. 2016;7:83476‐83487. [DOI] [PMC free article] [PubMed] [Google Scholar]
- 42. Ulasov IV, Shah N, Kaverina NV, et al. Tamoxifen improves cytopathic effect of oncolytic adenovirus in primary glioblastoma cells mediated through autophagy. Oncotarget. 2015;6:3977‐3987. [DOI] [PMC free article] [PubMed] [Google Scholar]
- 43. Huang W, Quan C, Duan P, Tang S, Chen W, Yang K. Nonylphenol induced apoptosis and autophagy involving the Akt/mTOR pathway in prepubertal Sprague‐Dawley male rats in vivo and in vitro. Toxicology. 2016;373:41‐53. [DOI] [PubMed] [Google Scholar]
- 44. Majewska E, Szeliga M. AKT/GSK3beta signaling in glioblastoma. Neurochem Res. 2017;42:918‐924. [DOI] [PMC free article] [PubMed] [Google Scholar]
- 45. Liang K, Lu Y, Jin W, Ang KK, Milas L, Fan Z. Sensitization of breast cancer cells to radiation by trastuzumab. Mol Cancer Ther. 2003;2:1113‐1120. [PubMed] [Google Scholar]
- 46. Nakamura JL, Karlsson A, Arvold ND, et al. PKB/Akt mediates radiosensitization by the signaling inhibitor LY294002 in human malignant gliomas. J Neurooncol. 2005;71:215‐222. [DOI] [PubMed] [Google Scholar]
- 47. Elliott NT, Yuan F. A review of three‐dimensional in vitro tissue models for drug discovery and transport studies. J Pharm Sci. 2011;100:59‐74. [DOI] [PubMed] [Google Scholar]
- 48. Wenzel C, Riefke B, Grundemann S, et al. 3D high‐content screening for the identification of compounds that target cells in dormant tumor spheroid regions. Exp Cell Res. 2014;323:131‐143. [DOI] [PubMed] [Google Scholar]
- 49. Hirt C, Papadimitropoulos A, Mele V, et al. “In vitro” 3D models of tumor‐immune system interaction. Adv Drug Deliv Rev. 2014;79–80:145‐154. [DOI] [PubMed] [Google Scholar]
- 50. Lee MH, Koh D, Na H, et al. MTA1 is a novel regulator of autophagy that induces tamoxifen resistance in breast cancer cells. Autophagy. 2018;14:812‐824. [DOI] [PMC free article] [PubMed] [Google Scholar]
- 51. Kim HS, Tian L, Kim H, Moon WK. Investigation of discriminant metabolites in tamoxifen‐resistant and choline kinase‐alpha‐downregulated breast cancer cells using 1H‐nuclear magnetic resonance spectroscopy. PLoS ONE. 2017;12:e0179773. [DOI] [PMC free article] [PubMed] [Google Scholar]


