

Abstract
Immunotherapy using anti‐PD‐1/PD‐L1 antibodies for several types of cancer has received considerable attention in recent decades. However, the molecular mechanism underlying PD‐L1 expression in pancreatic ductal adenocarcinoma (PDAC) cells has not been clearly elucidated. We investigated the clinical significance and regulatory mechanism of PD‐L1 expression in PDAC cells. Among the various cytokines tested, tumor necrosis factor (TNF)‐α upregulated PD‐L1 expression in PDAC cells through NF‐κB signaling. The induction of PD‐L1 expression was also caused by co‐culture with activated macrophages, and the upregulation was inhibited by neutralization with anti‐TNF‐α antibody after co‐culture with activated macrophages. PD‐L1 expression in PDAC cells was positively correlated with macrophage infiltration in tumor stroma of human PDAC tissues. In addition, survival analysis revealed that high PD‐L1 expression was significantly associated with poor prognosis in 235 PDAC patients and especially in patients harboring high CD8‐positive T‐cell infiltration. These findings indicate that tumor‐infiltrating macrophage‐derived TNF‐α could be a potential therapeutic target for PDAC.
Keywords: macrophage, pancreatic cancer, PD‐L1, TNF‐α, tumor stroma
1. INTRODUCTION
Pancreatic cancer is the fourth leading cause of cancer death worldwide.1 The major histological type of pancreatic cancer is pancreatic ductal adenocarcinoma (PDAC).2 PDAC is often detected at an advanced stage due to the difficulty of early detection and further development of chemotherapeutic agents against PDAC is crucial. The overall 5‐year survival rate of PDAC patients remains poor.3
Solid tumors comprise not only malignant cells but also many other non‐malignant cell types. Many leukocytes related to chronic inflammation are known to exist in tumor tissues, and together with fibroblasts and vascular endothelial cells, form the tumor microenvironment.4, 5, 6 Inflammatory responses recruit many immune cells, among which macrophages play important roles.6, 7 Macrophages in tumor tissues are called tumor‐associated macrophages (TAM) and are thought to produce a number of potent angiogenic and lymphangiogenic growth factors, cytokines and proteases intended for tissue repair, but they promote tumor progression directly, or indirectly through angiogenesis induced by vascular endothelial growth factor (VEGF).6, 8, 9, 10, 11, 12, 13 In fact, macrophages are known to influence the poor prognosis in PDAC patients.5, 14 However, the role of TAM in immunotolerance has not yet been clarified.
Cancer immunotherapy using immune checkpoint blockades, such as anti‐PD‐1/PD‐L1 antibody drugs, has received considerable attention in recent decades. PD‐1 interacts with PD‐L1 expressed in antigen‐presenting cells, such as dendritic cells or cancer cells, when the PD‐1/PD‐L1 axis promotes immune suppression for adaptive resistance; anti‐PD‐1/PD‐L1 antibodies exhibit anti‐tumor activity by blocking this interaction. Importantly, previous studies have reported that PDAC patients harboring PD‐L1‐positive tumor cells showed significantly poorer prognosis than those harboring PD‐L1‐negative tumor cells.15, 16 In addition, PD‐L1 expression in cancer cells has been reported to be correlated with the number of TAM in hepatocellular carcinoma and gastric cancer.17, 18 Although these results suggest that infiltrating immune cells affect PD‐L1 expression level in PDAC cells, the correlation has not been clearly elucidated. Therefore, this study was conducted to elucidate the molecular mechanism underlying PD‐L1 expression mediated by infiltrating immune cells in PDAC.
2. MATERIALS AND METHODS
2.1. Patients
From January 2004 to December 2014, a total of 252 patients underwent surgical resection with curative intent for pancreatic cancer at Kumamoto University Hospital and Kumamoto Regional Medical Center in Kumamoto, Japan. After excluding 17 patients whose data were not fully available, 235 patients were eligible for this study. In addition, we collected 6 frozen pancreatic cancer tissues resected during the time period from September 2016 to December 2016 for real‐time PCR analysis to examine the mRNA expression of tumor necrosis factor (TNF)‐α. Clinical samples were obtained in accordance with protocols approved by the Kumamoto University Hospital Review Board (IRB approval no. 2292).
2.2. Immunohistochemistry analysis
Deparaffinized formalin‐fixed paraffin‐embedded (FFPE) consecutive tissue sections were prepared for heat‐induced antigen retrieval in citrate or EDTA solution. For immunostaining, we used an indirect method with a monoclonal mouse anti‐CD163 primary antibody (10D6; Leica, Newcastle, UK) or polyclonal rabbit anti‐CD8 primary antibody (ab4055; Abcam, Tokyo, Japan) or an avidin‐biotin complex method with a monoclonal rabbit anti‐PD‐L1 primary antibody (#13684; CST, Tokyo, Japan) and an anti‐mouse or anti‐rabbit IgG antibody conjugated to HRP (Dako, Tokyo, Japan) as the secondary antibody. Mouse or rabbit IgG was used as the negative control. Immunostaining evaluations were conducted by 2 pathologists blinded to the sample identity. CD163‐positive cells and CD8‐positive cells were counted randomly at 200× magnification (.028 mm2 per field), and the data were averaged. To normalize the data from the 2 institutes, normalized CD8 or CD163 scores were determined using the following formula: {(the number of CD8 or CD163‐positive cells) − (average)}/(SD). Based on the score, CD8‐positive T‐cell infiltration was graded as low or high according to the first quartile of the normalized CD8 score. The average proportions of PD‐L1‐positive cells were estimated at low magnification and given a percentage score ranging from 0 to 4 (0 = 0%, 1 = 0%‐10%, 2 = 10%‐20%, 3 = 20%‐50% and 4 = 50%‐100%). The intensities of positively stained cells were estimated at high magnification and given a score ranging from 0 to 3 (0 = no staining, 1 = weak staining, 2 = intermediate staining and 3 = strong staining). The immunohistochemistry (IHC) scores were then calculated by multiplying the percentage score by the intensity score. To normalize the data from the 2 institutes, normalized IHC scores were determined using the following formula: {(IHC score) − (average)}/(SD). Based on the score, PD‐L1 expression was graded as low or high.
2.3. Source data
For the Cancer Genome Atlas (TCGA) analysis, raw RNA‐seq data of TCGA samples were downloaded from Genomic Data Commons. PDCD1 samples were separated into 2 groups by third quartile values. The survival curves for these 2 groups (high, n = 133; low, n = 44) were constructed according to the Kaplan‐Meier method, and survival was compared between groups using the log‐rank test.
2.4. Double immunostaining
After IHC analysis with the anti‐PD‐L1 antibody using FFPE sections harvested from PDAC patients as described above, we stained and colored the same sections with an anti‐Iba 1 antibody (#019‐19741; WAKO, Osaka, Japan) and Histogreen (Linaris, Wertheim, Germany), respectively.
2.5. Cell lines
The human PDAC cell lines were purchased from RIKEN Cell Bank (Japan), and DAUDI cells were established from patients with Burkitt lymphoma (RIKEN Cell Bank). All cell lines were maintained in D‐MEM or RPMI medium (WAKO) supplemented with 10% FBS (Mediatech, Osaka, Japan).
2.6. Real‐time PCR
Total RNA was extracted from cultured cells or human tissues using a RNeasy Mini Kit (QIAGEN, Tokyo, Japan), and reverse transcription and real‐time PCR were performed as previously described.19 The following real‐time PCR primers were used:
CD274, 5′‐ GGCATCCAAGATACAAACTCAA‐ 3′ (forward)
and 5′‐ CAGAAGTTCCAATGCTGGATTA‐ 3′ (reverse);
TNF‐α, 5′‐ TCCAGACTTCCTTGAGACACG‐ 3′ (forward)
and 5′‐ CCCGGTCTGCCAAATAAATAC‐ 3′ (reverse).
2.7. Macrophage cultures
Human peripheral blood mononuclear cells (PBMC) were obtained from healthy volunteers in accordance with protocols approved by the Kumamoto University Hospital Review Board (IRB approval no. 1169). CD14+ monocytes were isolated using CD14‐microbeads (Miltenyi Biotec, Bergisch Gladbach, Germany) and then cultured with 2% human serum, macrophage colony‐stimulating factor (100 ng/mL, M‐CSF, WAKO) and granulocyte macrophage colony‐stimulating factor (1 ng/mL, GM‐CSF, WAKO) for 7 days to induce their differentiation into mature human monocyte‐derived macrophages.20
2.8. Co‐culture with human monocyte‐derived macrophages
After washed with PBS, monocyte‐derived macrophages were co‐cultured with S2‐013 or MIAPaCa2 cells for 24 or 48 hours with or without lipopolysaccharide (LPS) (100 ng/mL) to activate monocyte‐derived macrophages. Monocyte‐derived macrophages were also co‐cultured with S2‐013 or MIAPaCa2 cells and an anti‐TNF‐α antibody (HM2218; Hycult Biotech, Wayne, USA) at 1 μg/mL to neutralize the TNF‐α produced by the macrophages after treatment with LPS for 24 hours at 100 ng/mL.
2.9. Cytokine treatments
Cytokine treatments were performed as previously described.19 Briefly, S2‐013 and MIAPaCa2 cells were treated with: interleukin (IL)‐1α, IL‐1β, IL‐6, TNF‐α, IL‐7 or IL‐24 at 10 ng/mL; interferon (IFN)‐γ, IL‐4 or IL‐13 at 20 ng/mL; and LPS at 100 ng/mL. After treatment with these cytokines, PD‐L1 expression in cancer cells was evaluated.
2.10. Flow cytometry
Flow cytometry analysis was performed as previously described.21 Briefly, 1 × 10⁶ PDAC cells were collected after being treated with Accutase for 15 minutes and incubated with PE anti‐human CD274 (#329705; BioLegend, San Diego, USA) or PE anti‐mouse IgG (#504732; BioLegend) antibodies (2 μg/50 mL) for 30 minutes on ice. The cells were then counted on a BD FACS Verse flow cytometer (BD Biosciences, Tokyo, Japan) and analyzed using Flow Jo software (TOMY Digital Biology, Tokyo, Japan).
2.11. Inhibition of the nuclear factor‐kappa B signaling pathway
To inhibit the nuclear factor‐kappa B (NF‐κB) signaling pathway, MIAPaCa2 cells were treated with dehydroxymethylepoxyquinomicin (DHMEQ, 10 ng/mL, COSMO BIO, Japan) for 1 hour. The cells were then treated with TNF‐α at 20 ng/mL and an equal concentration of inhibitor for 6 hours for RNA extraction, 24 hours for PD‐L1 protein extraction, or 1 hour for NF‐κB and phosphorylated NF‐κB protein extraction.
2.12. Whole cell lysate extraction
Total protein was extracted using RIPA buffer (Thermo, Tokyo, Japan), and protein concentrations were determined using a BCA Protein Assay Kit (Thermo) according to the manufacturer's instructions.
2.13. Western blot analysis
Samples were prepared for western blot analysis by adding 4× SDS‐PAGE sample buffer and incubating for 5 minutes at 95°C. Proteins (7.5‐9 μg) were separated by 10% SDS‐PAGE and then transferred onto polyvinylidene difluoride membranes (Bio‐Rad, Tokyo, Japan). Proteins were detected by probing with the following primary antibodies: a rabbit anti‐PD‐L1 (E1L3N) mAb (#13684; CST, Japan), a rabbit anti‐NF‐κB p65 (C22B4) mAb (#4764; CST) or a rabbit anti‐phospho‐NF‐κB p65 (Ser536) (93H1) mAb (#3033; CST), followed by incubation with an HRP‐conjugated anti‐rabbit secondary antibody (Santa Cruz Biotechnology, USA). The membranes were developed using ECL Prime Western Blotting substrate (GE Healthcare, Amersham Place, UK) according to the manufacturer's instructions. Signals were detected on a LAS 4000 EPUV Mini imaging detection system (FUJIFILM, Tokyo, Japan).
2.14. Elisa
Media conditioned with PDAC cells alone, macrophages alone or macrophages treated with 100 ng/mL LPS for 48 hours were collected. The samples were subjected to ELISA as previously described19 using a Quantikine ELISA Human TNF‐α Immunoassay Kit (R&D Systems, Minneapolis, USA) according to the manufacturer's instructions.
2.15. Immunocytostaining
Macrophages were fixed with 1% paraformaldehyde, and CD163 expression was examined with an anti‐CD163 antibody (Clone No. AM‐3K, Transgenic, Japan) as described previously.22
2.16. Statistical analysis
Continuous variables are expressed as the means ± SD and were compared using Student's t tests. Categorical variables were compared using χ2‐tests. Correlation analysis was performed using Pearson's product‐moment correlation coefficient. All analyses were conducted with JMP 13.2.1 software (SAS, USA), and P‐values < .05 were considered significant.
3. RESULTS
3.1. PD‐L1 expression is significantly associated with poor prognosis in pancreatic ductal adenocarcinoma patients
The PD‐1/PD‐L1 interaction has a critical role in the immunotolerance by which cancer cells evade elimination by CD8‐positive T cells. To investigate the clinical significance of PD‐L1 expression and the number of CD8‐positive T cells in PDAC patients, immunohistochemistry analysis of PD‐L1 and CD8 was performed on consecutive paraffin sections from 235 PDAC patients. The overall survival in the high PD‐L1 expression group was significantly worse than that in the low PD‐L1 expression group (5‐year survival rate: 7.9% vs 33%, P = .0058, Figure 1A). The survival data from TCGA samples supported the survival data from our cohort (5‐year survival rate: high, .0% vs low, 37.3%, P = .0043, Figure 1B). In addition, our survival analysis showed that patients with high CD8‐positive T‐cell infiltration had a better prognosis than those with low CD8‐positive T‐cell infiltration (5‐year survival rate: 34.4% vs 12.5%, P = .0005, Figure 1C). Following a previous study,23 enrolled patients were allocated into 4 groups based on PD‐L1 expression and the number of infiltrating CD8‐positive T cells (Figure 1D). Although PD‐L1 expression did not have a significant impact on prognosis in PDAC patients harboring low CD8‐positive T‐cell infiltration (P = .46, Figure 1G), PD‐L1 expression was significantly associated with poor prognosis in PDAC patients harboring high CD8‐positive T‐cell infiltration (P = .030, Figure 1F).
Figure 1.
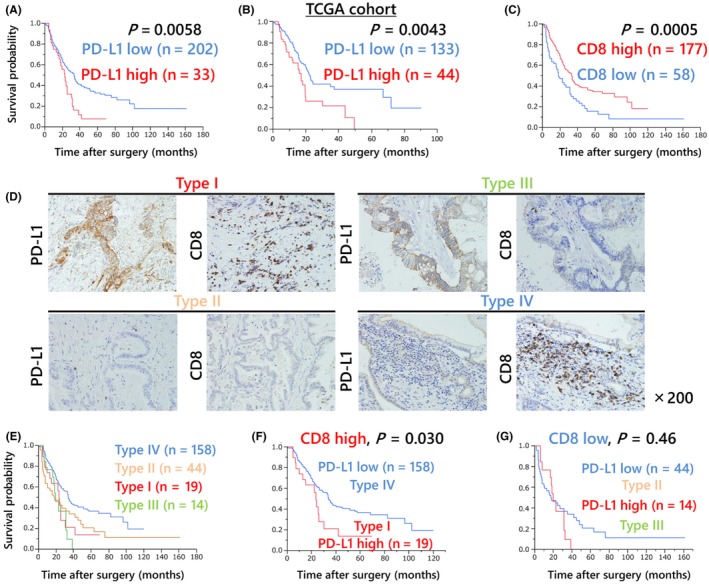
PD‐L1 expression is significantly associated with poor prognosis in pancreatic ductal adenocarcinoma (PDAC) patients. A, The overall survival of 235 PDAC patients who underwent surgical resection with curative intent according to their level of PD‐L1 expression. Patients in the high PD‐L1 expression group had a poorer survival rate than those in the low PD‐L1 expression group (5‐year survival rate: 6.6% vs 31%, P = .012). B, Kaplan‐Meier survival curve using pancreatic cancer TCGA data (n = 177). Higher expression of PD‐L1 in pancreatic cancer specimens was associated with poorer survival (5‐year survival rate: high, .0% vs low, 37.3%, P = .0043). C, The overall survival of 235 PDAC patients who underwent surgical resection with curative intent according to CD8‐positive T‐cell infiltration. Patients with high CD8‐positive T‐cell infiltration had better prognosis than those with low CD8‐positive T‐cell infiltration (5‐year survival rate: 36.1% vs 12.3%, P = .027). D, Enrolled patients were allocated to 4 groups based on PD‐L1 expression and the number of infiltrating CD8‐positive T cells: high PD‐L1 expression and high CD8 T‐cell infiltration (Type I), low and low (Type II), high and low (Type III), or low and high (Type IV). E, The overall survival of the same patients according to their types. The Type I group showed the poorest prognosis among all groups. The combination of PD‐L1 expression and CD8‐positive T‐cell infiltrations was correlated with prognosis. F, G, Mortality after patients were subcategorized according to the intensity of CD8‐positive T cells. For higher CD8‐positive T‐cell infiltration, the PD‐L1‐high expression group showed significantly poorer prognosis than the PD‐L1‐low expression group (P = .012)
3.2. PD‐L1 expression is correlated with CD163‐positive tumor‐infiltrating macrophages
To examine the relationship between PD‐L1 expression and tumor‐infiltrating macrophages, immunohistochemistry analysis was performed on consecutive paraffin sections from 235 PDAC patients (Figure 2A). PD‐L1 expression on PDAC cells was modestly but significantly correlated with the number of CD163‐positive tumor‐infiltrating macrophages (r = .15, P = .023, Figure 2B). The clinicopathological characteristics of patients in the high PD‐L1 expression (PD‐L1 high) and low PD‐L1 expression (PD‐L1 low) groups are shown in Table 1. No significant differences in age, sex or tumor‐related factors, such as the tumor site, tumor size, value of tumor markers or TNM stage, were observed between the 2 groups. We demonstrated by double immunostaining that macrophages infiltrated around PDAC cells expressing PD‐L1 (Figure 2C). Moreover, we examined the survival analysis based on CD163‐positive macrophage infiltration. Consistent with the results of a previous study,24 PDAC patients with high CD163‐positive macrophage infiltration tended to have poorer prognosis than those with low CD163‐positive macrophage infiltration; however, this difference was not significant in our cohort (Figure S1, P = .19).
Figure 2.
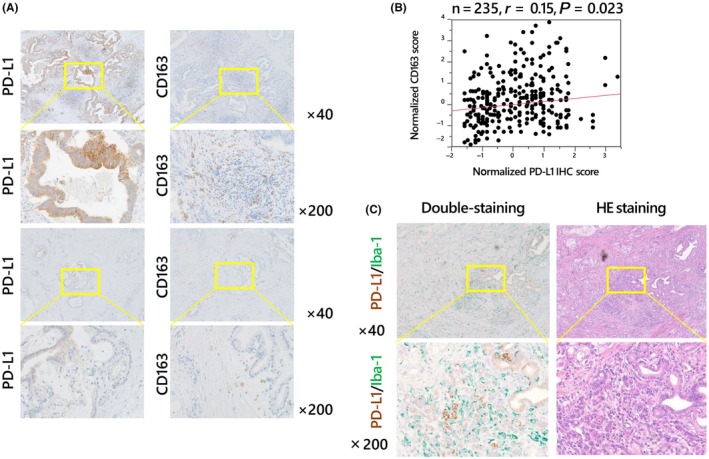
Correlation between PD‐L1 expression on cancer cells and tumor‐infiltrating macrophages. Immunohistochemistry analysis of consecutive paraffin sections harvested from 235 patients with pancreatic ductal adenocarcinoma (PDAC) with an anti‐PD‐L1 antibody (left column) or an anti‐CD163 antibody (right column) (A). PD‐L1 expression on cancer cells showed a significant positive correlation with the number of tumor‐infiltrating CD163‐positive macrophages (B). Double immunostaining (left column) with PD‐L1 (brown) and Iba‐1 (green) antibodies, which stained infiltrating macrophages in tumor stroma (C). Macrophages infiltrated around PDAC cells expressing PD‐L1. H&E staining of the consecutive paraffin sections is shown in the right column (C)
Table 1.
Comparisons of clinicopathological characteristics between the PD‐L1 high and PD‐L1 low groups
| Variables | PD‐L1 high (n = 33) | PD‐L1 low (n = 202) | P‐value |
|---|---|---|---|
| Age | 70.3 ± 9.0 | 67.5 ± 9.8 | .18 |
| Sex (Male : Female) | 15:18 | 107:95 | .42 |
| Body mass index | 22.5 ± 3.1 | 21.9 ± 3.1 | .19 |
| White blood cells | 6300 ± 2206 | 5800 ± 1777 | .36 |
| C‐reactive protein | .44 ± .54 | .85 ± 2.43 | .93 |
| Albumin (g/dL) | 4.0 ± .5 | 4.0 ± .5 | .88 |
| Hemoglobin (g/dL) | 13.3 ± 1.3 | 12.8 ± 1.7 | .09 |
| CEA (ng/mL) | 2.9 (.7‐45.7) | 2.8 (.2‐2089) | .54 |
| CA19‐9 (U/mL) | 68 (.9‐9060) | 69 (.1‐50000) | .69 |
| Tumor site (head/body or tail) | 17/4 | 62/39 | .088 |
| Tumor size (mm) | 20.0 ± 15.6 | 17.9 ± 16.5 | .44 |
| Surgery (PD/TP or DP) | 25/8 | 141/61 | .49 |
| R0/R1 or R2 | 26/7 | 168/34 | .54 |
| T1‐2/T3‐4 | 1/32 | 23/179 | .14 |
| N (−)/N (+) | 12/21 | 70/132 | .85 |
| M0/M1 | 29/4 | 175/27 | .85 |
| Invasion to nerves | 32 (97%) | 175 (88%) | .13 |
| Invasion to lymph ducts | 27 (82%) | 145 (72%) | .24 |
CA19‐9, carbohydrate antigen 19‐9; CEA, carcinoembryonic antigen; DP, distal pancreatectomy; PD, pancreaticoduodenectomy; TP, total pancreatectomy.
3.3. PD‐L1 expression in pancreatic ductal adenocarcinoma cells is enhanced after co‐culture with macrophages derived from human monocytes
To investigate the molecular mechanism of PD‐L1 expression in PDAC cells, we first examined PD‐L1 mRNA and protein expression in PDAC cells (Figures 3A,B and S2). Macrophages were differentiated from human monocytes and co‐cultured with these PDAC cells. Activated macrophages harboring CD163 produced abundant cytokines (Figure S3) and were also co‐cultured with PDAC cells. PD‐L1 mRNA expression was assessed in PDAC cells co‐cultured with macrophages, which revealed upregulated expression in both S2‐013 and MIAPaCa2 cells co‐cultured with activated macrophages (Figures 3C,D).
Figure 3.
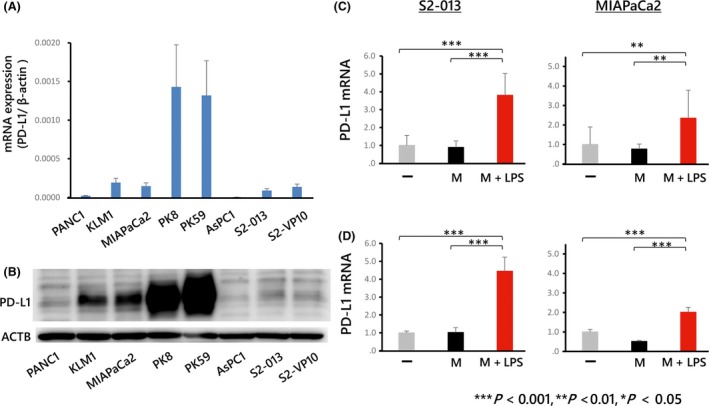
PD‐L1 expression in pancreatic ductal adenocarcinoma (PDAC) cells determined using real‐time PCR (A) and western blot analysis (B). PD‐L1 expression was higher in some PDAC cells (PK8, PK59) and lower in other cells (AsPC‐1). S2‐013 and MIAPaCa2 were chosen for subsequent experiments. Full‐length gels are presented in Figure S2. C, D, PD‐L1 mRNA levels in PDAC cells (S2‐013 or MIAPaCa2) co‐cultured with macrophages. The minus symbol indicates cells cultured without macrophages. “M” indicates cells co‐cultured with macrophages, and “M+LPS” indicates cells co‐cultured with macrophages after activation with lipopolysaccharide (LPS). PD‐L1 mRNA expression was significantly enhanced in PDAC cells co‐cultured with macrophages treated with LPS for 24 (C) or 48 h (D)
3.4. Tumor necrosis factor‐α strongly induces PD‐L1 expression in pancreatic ductal adenocarcinoma cells
The specificity of the anti‐PD‐L1 antibody was tested using PDAC cell lines (Figure 4A). Of the various cytokines tested, TNF‐α and IFN‐γ strongly induced PD‐L1 expression in both S2‐013 (Figure 4B) and MIAPaCa2 cells (Figure 4C). In addition, TNF‐α promoted PD‐L1 protein expression on these cells as determined by flow cytometry analysis (Figures 4D,E). The PD‐L1 mRNA levels corresponded to PD‐L1 expression on the cancer cell membrane.
Figure 4.
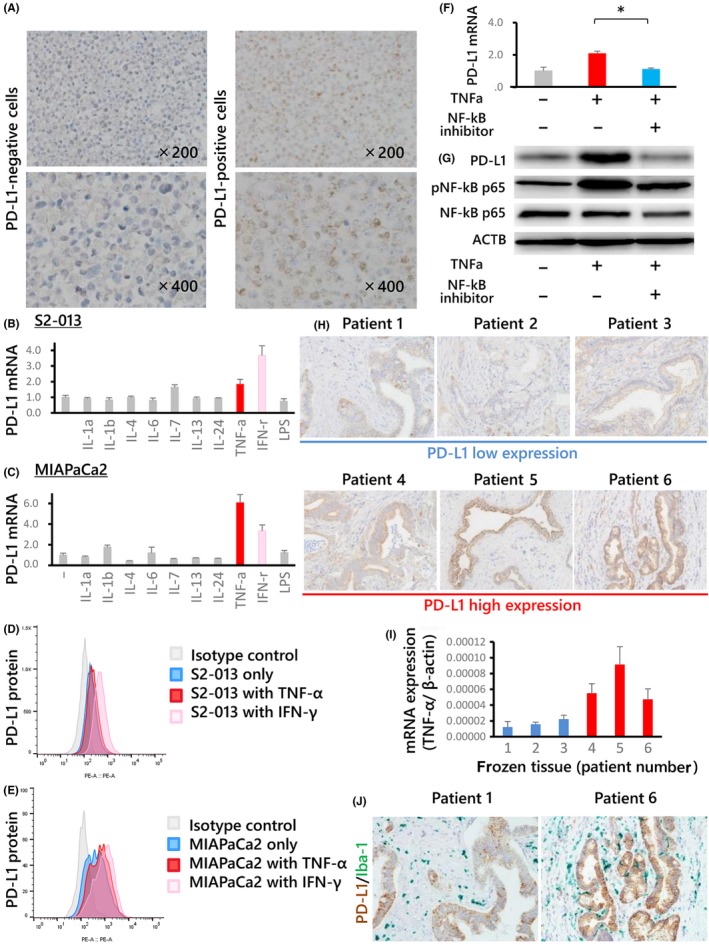
A, PD‐L1 expression on DAUDI (left) and pancreatic ductal adenocarcinoma (PDAC) cells (right) as determined by immunohistochemistry analysis with an anti‐PD‐L1 antibody; Burkitt lymphoma cells were utilized as the negative control. The upper panel shows 200× magnification, and the bottom panel shows 400× magnification. PD‐L1 expression in S2‐013 (B, D) and MIAPaCa2 (C, E) cells after cytokine assays, determined by real‐time PCR (B, C) or flow cytometry (D, E). The minus symbol indicates that no cytokines were added. Among the various cytokines (including LPS) analyzed, tumor necrosis factor (TNF)‐α and interferon (IFN)‐γ strongly induced PD‐L1 expression in both cell lines (S2‐013 and MIAPaCa2). F, Inhibitor assay with MIAPaCa2 cells using a nuclear factor‐kappa B (NF‐κB) inhibitor. The plus sign indicates that the inhibitor was added, whereas the minus sign indicates that the inhibitor was not added. PD‐L1 expression was increased in MIAPaCa2 cells after treatment with TNF‐α and was inhibited after treatment with both TNF‐α and NF‐κB inhibitors. G, Western blot analysis of proteins detected by probing with anti‐NF‐κB or anti‐phosphorylated NF‐κB antibodies. TNF‐α increased the level of phosphorylated NF‐κB. Full‐length gels are presented in Figure S4. H, Correlation between PD‐L1 expression and TNF‐α mRNA levels in frozen human PDAC tissues. Patients were sorted into a high or low PD‐L1 expression group based on analysis of frozen tissues, and the (H) PD‐L1 expression in paraffin sections and TNF‐α mRNA expression in frozen tissues harvested from the same PDAC patients (I) were compared. PD‐L1 expression was typically high in patients with high TNF‐α mRNA levels. Macrophage infiltration was also confirmed in consecutive paraffin sections using double immunostaining with PD‐L1 and Iba‐1 antibodies (J). The cells stained brown represent PD‐L1‐expressing PDAC cells, whereas those stained green are infiltrating macrophages
3.5. Molecular mechanism of PD‐L1 expression in pancreatic ductal adenocarcinoma cells
An inhibitor assay was performed to clarify the molecular mechanism of PD‐L1 expression. MIAPaCa2 cells were used for the inhibitor assay because flow cytometry indicated that PD‐L1 was expressed at higher levels on MIAPaCa2 cells than on S2‐013 cells after TNF‐α treatment. PD‐L1 mRNA expression was increased after TNF‐α was added, and this upregulation was inhibited by the NF‐κB inhibitor in MIAPaCa2 cells (Figure 4F). These findings suggest that TNF‐α can promote PD‐L1 expression in PDAC cells via the NF‐κB pathway. This result was further supported by the results of western blot analysis, which showed that PD‐L1 and phosphorylated NF‐κB levels were increased after the addition of TNF‐α and that this upregulation was inhibited by the NF‐κB inhibitor in MIAPaCa2 cells (Figures 4G and S4).
3.6. Correlation between PD‐L1 expression and tumor necrosis factor‐α mRNA expression in cancer tissues
Immunohistochemistry analyses and real‐time PCR were performed to examine PD‐L1 protein expression and TNF‐α mRNA levels in the same series of PDAC tissues. A positive correlation was observed (Figure 4H,I). Macrophage infiltration around PD‐L1‐positive PDAC cells was also confirmed using double immunostaining (Figure 4J).
3.7. PD‐L1 expression in pancreatic ductal adenocarcinoma cells is enhanced by macrophage‐derived tumor necrosis factor‐α
ELISA analysis revealed that human monocyte‐derived macrophages activated by LPS produced substantial amounts of TNF‐α (Figure 5A). The amount of TNF‐α was almost identical among all types of macrophages tested (Figure S3b). Furthermore, the upregulation of PD‐L1 after co‐culture with macrophages was inhibited by an anti‐TNF‐α antibody (Figure 5B). This result was further supported by the results of western blot analysis (Figures 5C and S5). These findings suggest that PD‐L1 expression in PDAC cells is upregulated by macrophage‐derived TNF‐α.
Figure 5.
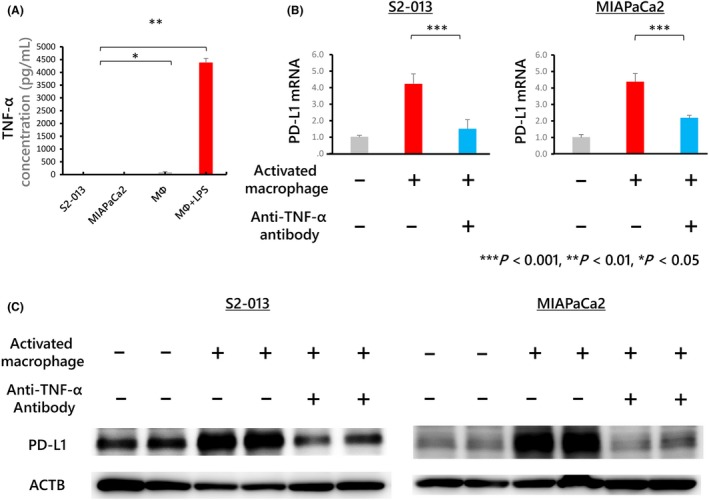
A, The concentration of tumor necrosis factor (TNF)‐α in each conditioned medium determined by ELISA. Macrophages treated with lipopolysaccharide (LPS) produced substantial amounts of TNF‐α. B, Human monocyte‐derived macrophages were co‐cultured with S2‐013 or MIAPaCa2 cells. An anti‐TNF‐α antibody was then used at 1 μg/mL to neutralize TNF‐α produced by macrophages treated with 100 ng/mL LPS for 24 h. PD‐L1 mRNA expression in S2‐013 and MIAPaCa2 cells was upregulated after co‐culture with activated macrophages; this upregulation was inhibited by treatment with 1 μg/mL anti‐TNF‐α antibody. The plus symbol indicates that the antibody was added, and the minus symbol indicates that the antibody was not added. C, Western blot analysis of proteins detected by probing with anti‐PD‐L1 antibodies. PD‐L1 expression upregulated by co‐culture with activated macrophages was inhibited by an anti‐TNF‐α antibody. Full‐length gels are presented in Figure S5
4. DISCUSSION
In general, naive T cells accumulate around cancer cells, and given that T‐cell receptors (TCR) recognize the major histocompatibility complex (MHC) on cancer cells, T cells are activated to secrete IFN‐γ. Elevated local levels of IFN‐γ induce PD‐L1 expression on cancer cells, which leads to a reduction in T‐cell activity through binding to PD‐1 on T cells.25, 26 Therefore, anti‐PD‐1 and PD‐L1 antibody drugs block the PD‐1/PD‐L1 signaling pathway, removing the inhibitory signal and allowing T cells to attack tumor cells. In brief, the immune checkpoint system impairs T‐cell activity, and anti‐PD‐1 and PD‐L1 antibody drugs function as immune checkpoint blockades by reactivating the immune T‐cell responses to cancer cells.25 Recently, anti‐PD‐1 and PD‐L1 antibody drugs have been proven to be safe and effective in the treatment of several cancers, including melanoma, non‐small cell lung cancer, renal cell carcinoma and gastric cancer,27, 28, 29 and are known to have abundant clinical benefits. In addition, our survival analysis revealed that PD‐L1‐high patients with PDAC had poorer prognoses than PD‐L1‐low patients, supporting previous findings that patients harboring PD‐L1‐positive tumor cells had significantly poorer prognoses than those harboring PD‐L1‐negative tumor cells in several types of cancer,30, 31 including pancreatic cancer.15, 16
The infiltration rate of CD8‐positive T cells has been reported to be correlated with better prognosis.32, 33, 34, 35, 36 Similarly, our survival analysis showed that patients with high CD8‐positive T‐cell infiltration had a better prognosis than those with low CD8‐positive T‐cell infiltration. To address whether PD‐L1 expression on PDAC cells leads to poor prognosis of PDAC patients through immunotolerance, we examined the impact of PD‐L1 expression on prognosis in situations of high or low CD8‐positive T‐cell infiltration. PD‐L1 expression was found to be significantly associated with poor prognosis in PDAC patients harboring high CD8‐positive T‐cell infiltration. This finding suggests that high PD‐L1 expression is correlated with poor prognosis via immunotolerance in PDAC patients.
Notably, we found that CD163‐positive macrophage infiltration was significantly associated with PD‐L1 expression in PDAC cells in consecutive paraffin sections harvested from PDAC patients, supporting observations in other types of cancer.17, 18 Consistent with this finding, PD‐L1 expression was upregulated in PDAC cells co‐cultured with activated macrophages derived from human monocytes. Macrophages are known to produce various cytokines, including TNF‐α, IL‐1 and IL‐6, and among these cytokines, we determined that TNF‐α enhanced PD‐L1 expression in PDAC cells. Moreover, the upregulation of PD‐L1 after co‐culture with macrophages was inhibited by an anti‐TNF‐α antibody. These results suggest that PD‐L1 expression in PDAC cells is upregulated by macrophage‐derived TNF‐α in the tumor microenvironment. Macrophages also produce low levels of IFN‐γ under LPS‐stimulation,37 and it has been suggested that in addition to TNF‐α, macrophage‐derived IFN‐γ enhanced PD‐L1 expression in PDAC cells.
Cytotoxic T lymphocytes (CTL) are stimulated by IFN‐γ production after the TCR binds the MHC, and IFN‐γ promotes PD‐L1 expression in cancer cells via the JAK/STAT pathway.38, 39 The transcription factor NF‐κB, which is downstream of TNF‐α, has been shown to induce the expression of inflammatory mediators and other transcription factors during the immune response, suggesting that NF‐κB is responsible for both inflammation‐induced carcinogenesis and anti‐tumor immunity. To address the molecular mechanism of PD‐L1 expression, we examined the effect of an NF‐κB inhibitor on PD‐L1 expression and showed that NF‐κB signaling was important in PD‐L1 upregulation in PDAC cells. Thus, the current study identified another potential mechanism underlying PD‐L1 expression: production of TNF‐α by activated macrophages and subsequent promotion of PD‐L1 expression by TNF‐α via NF‐κB signaling in PDAC cells.
In conclusion, PD‐L1 expression in PDAC cells is promoted by TNF‐α derived from tumor‐infiltrating macrophages, potentially leading to a poor prognosis for patients with PDAC. These findings suggest the possibility of inhibiting aberrant PD‐L1 induction by blocking with an anti‐TNF‐α antibody.
CONFLICTS OF INTEREST
We have no conflicts of interest to disclose.
Supporting information
Tsukamoto M, Imai K, Ishimoto T, et al. PD‐L1 expression enhancement by infiltrating macrophage‐derived tumor necrosis factor‐α leads to poor pancreatic cancer prognosis. Cancer Sci. 2019;110:310–320. 10.1111/cas.13874
REFERENCES
- 1. Siegel RL, Miller KD, Jemal A. Cancer statistics, 2015. CA Cancer J Clin. 2015;65:5‐29. [DOI] [PubMed] [Google Scholar]
- 2. Ryan DP, Hong TS, Bardeesy N. Pancreatic adenocarcinoma. N Engl J Med. 2014;371:1039‐1049. [DOI] [PubMed] [Google Scholar]
- 3. Hidalgo M. Pancreatic cancer. N Engl J Med. 2010;362:1605‐1617. [DOI] [PubMed] [Google Scholar]
- 4. Monis B, Weinberg T. Cytochemical study of esterase activity of human neoplasms and stromal macrophages. Cancer. 1961;14:369‐377. [DOI] [PubMed] [Google Scholar]
- 5. Komohara Y, Jinushi M, Takeya M. Clinical significance of macrophage heterogeneity in human malignant tumors. Cancer Sci. 2014;105:1‐8. [DOI] [PMC free article] [PubMed] [Google Scholar]
- 6. Pollard JW. Tumour‐educated macrophages promote tumour progression and metastasis. Nat Rev Cancer. 2004;4:71‐78. [DOI] [PubMed] [Google Scholar]
- 7. Libby P. Inflammation in atherosclerosis. Nature. 2002;420:868‐874. [DOI] [PubMed] [Google Scholar]
- 8. Mantovani A, Sozzani S, Locati M, Allavena P, Sica A. Macrophage polarization: tumor‐associated macrophages as a paradigm for polarized M2 mononuclear phagocytes. Trends Immunol. 2002;23:549‐555. [DOI] [PubMed] [Google Scholar]
- 9. Bingle L, Brown NJ, Lewis CE. The role of tumour‐associated macrophages in tumour progression: implications for new anticancer therapies. J Pathol. 2002;196:254‐265. [DOI] [PubMed] [Google Scholar]
- 10. Ishimoto T, Sugihara H, Watanabe M, et al. Macrophage‐derived reactive oxygen species suppress miR‐328 targeting CD44 in cancer cells and promote redox adaptation. Carcinogenesis. 2014;35:1003‐1011. [DOI] [PubMed] [Google Scholar]
- 11. Coussens LM, Werb Z. Inflammation and cancer. Nature. 2002;420:860‐867. [DOI] [PMC free article] [PubMed] [Google Scholar]
- 12. Schoppmann SF, Birner P, Stöckl J, et al. Tumor‐associated macrophages express lymphatic endothelial growth factors and are related to peritumoral lymphangiogenesis. Am J Pathol. 2002;161:947‐956. [DOI] [PMC free article] [PubMed] [Google Scholar]
- 13. Noy R, Pollard JW. Tumor‐associated macrophages: from mechanisms to therapy. Immunity. 2014;41:49‐61. [DOI] [PMC free article] [PubMed] [Google Scholar]
- 14. Wang X, Yang L, Huang F, et al. Inflammatory cytokines IL‐17 and TNF‐alpha up‐regulate PD‐L1 expression in human prostate and colon cancer cells. Immunol Lett. 2017;184:7‐14. [DOI] [PMC free article] [PubMed] [Google Scholar]
- 15. Nomi T, Sho M, Akahori T, et al. Clinical significance and therapeutic potential of the programmed death‐1 ligand/programmed death‐1 pathway in human pancreatic cancer. Clin Cancer Res. 2007;13:2151‐2157. [DOI] [PubMed] [Google Scholar]
- 16. Wang L, Ma Q, Chen X, et al. Clinical significance of B7‐H1 and B7‐1 expressions in pancreatic carcinoma. World J Surg. 2010;34:1059‐1065. [DOI] [PubMed] [Google Scholar]
- 17. Chen J, Li G, Meng H, et al. Upregulation of B7‐H1 expression is associated with macrophage infiltration in hepatocellular carcinomas. Cancer Immunol Immunother. 2012;61:101‐108. [DOI] [PMC free article] [PubMed] [Google Scholar]
- 18. Harada K, Dong X, Estrella JS, et al. Tumor‐associated macrophage infiltration is highly associated with PD‐L1 expression in gastric adenocarcinoma. Gastric Cancer. 2017;21:31‐40. [DOI] [PubMed] [Google Scholar]
- 19. Ishimoto T, Miyake K, Nandi T, et al. Activation of transforming growth factor beta 1 signaling in gastric cancer‐associated fibroblasts increases their motility, via expression of rhomboid 5 homolog 2, and ability to induce invasiveness of gastric cancer cells. Gastroenterology. 2017;153:191‐204.e116. [DOI] [PubMed] [Google Scholar]
- 20. Horlad H, Ma C, Yano H, et al. An IL‐27/Stat3 axis induces expression of programmed cell death 1 ligands (PD‐L1/2) on infiltrating macrophages in lymphoma. Cancer Sci. 2016;107:1696‐1704. [DOI] [PMC free article] [PubMed] [Google Scholar]
- 21. Izumi D, Ishimoto T, Miyake K, et al. CXCL12/CXCR4 activation by cancer‐associated fibroblasts promotes integrin beta1 clustering and invasiveness in gastric cancer. Int J Cancer. 2016;138:1207‐1219. [DOI] [PubMed] [Google Scholar]
- 22. Komohara Y, Hirahara J, Horikawa T, et al. AM‐3K, an anti‐macrophage antibody, recognizes CD163, a molecule associated with an anti‐inflammatory macrophage phenotype. J Histochem Cytochem. 2006;54:763‐771. [DOI] [PubMed] [Google Scholar]
- 23. Teng MW, Ngiow SF, Ribas A, Smyth MJ. Classifying cancers based on T‐cell infiltration and PD‐L1. Can Res. 2015;75:2139‐2145. [DOI] [PMC free article] [PubMed] [Google Scholar]
- 24. Hu H, Hang JJ, Han T, Zhuo M, Jiao F, Wang LW. The M2 phenotype of tumor‐associated macrophages in the stroma confers a poor prognosis in pancreatic cancer. Tumour Biol. 2016;37:8657‐8664. [DOI] [PubMed] [Google Scholar]
- 25. Pardoll DM. The blockade of immune checkpoints in cancer immunotherapy. Nat Rev Cancer. 2012;12:252‐264. [DOI] [PMC free article] [PubMed] [Google Scholar]
- 26. Boussiotis VA. Molecular and biochemical aspects of the PD‐1 checkpoint pathway. N Engl J Med. 2016;375:1767‐1778. [DOI] [PMC free article] [PubMed] [Google Scholar]
- 27. Topalian SL, Hodi FS, Brahmer JR, et al. Safety, activity, and immune correlates of anti‐PD‐1 antibody in cancer. N Engl J Med. 2012;366:2443‐2454. [DOI] [PMC free article] [PubMed] [Google Scholar]
- 28. Brahmer JR, Tykodi SS, Chow LQ, et al. Safety and activity of anti‐PD‐L1 antibody in patients with advanced cancer. N Engl J Med. 2012;366:2455‐2465. [DOI] [PMC free article] [PubMed] [Google Scholar]
- 29. Kang YK, Boku N, Satoh T, et al. Nivolumab in patients with advanced gastric or gastro‐oesophageal junction cancer refractory to, or intolerant of, at least two previous chemotherapy regimens (ONO‐4538‐12, ATTRACTION‐2): a randomised, double‐blind, placebo‐controlled, phase 3 trial. Lancet. 2017;390:2461‐2471. [DOI] [PubMed] [Google Scholar]
- 30. Thompson RH, Kuntz SM, Leibovich BC, et al. Tumor B7‐H1 is associated with poor prognosis in renal cell carcinoma patients with long‐term follow‐up. Can Res. 2006;66:3381‐3385. [DOI] [PubMed] [Google Scholar]
- 31. Ohigashi Y, Sho M, Yamada Y, et al. Clinical significance of programmed death‐1 ligand‐1 and programmed death‐1 ligand‐2 expression in human esophageal cancer. Clin Cancer Res. 2005;11:2947‐2953. [DOI] [PubMed] [Google Scholar]
- 32. Sato E, Olson SH, Ahn J, et al. Intraepithelial CD8 + tumor‐infiltrating lymphocytes and a high CD8 + /regulatory T cell ratio are associated with favorable prognosis in ovarian cancer. Proc Natl Acad Sci USA. 2005;102:18538‐18543. [DOI] [PMC free article] [PubMed] [Google Scholar]
- 33. Gao Q, Qiu SJ, Fan J, et al. Intratumoral balance of regulatory and cytotoxic T cells is associated with prognosis of hepatocellular carcinoma after resection. J Clin Oncol. 2007;25:2586‐2593. [DOI] [PubMed] [Google Scholar]
- 34. Mahmoud SM, Paish EC, Powe DG, et al. Tumor‐infiltrating CD8 + lymphocytes predict clinical outcome in breast cancer. J Clin Oncol. 2011;29:1949‐1955. [DOI] [PubMed] [Google Scholar]
- 35. Sudo T, Nishida R, Kawahara A, et al. Clinical impact of tumor‐infiltrating lymphocytes in esophageal squamous cell carcinoma. Ann Surg Oncol. 2017;24:3763‐3770. [DOI] [PubMed] [Google Scholar]
- 36. Lohneis P, Sinn M, Bischoff S, et al. Cytotoxic tumour‐infiltrating T lymphocytes influence outcome in resected pancreatic ductal adenocarcinoma. Eur J Cancer. 2017;83:290‐301. [DOI] [PubMed] [Google Scholar]
- 37. Darwich L, Coma G, Peña R, et al. Secretion of interferon‐gamma by human macrophages demonstrated at the single‐cell level after costimulation with interleukin (IL)‐12 plus IL‐18. Immunology. 2009;126:386‐393. [DOI] [PMC free article] [PubMed] [Google Scholar]
- 38. Zhang X, Zeng Y, Qu Q, et al. PD‐L1 induced by IFN‐gamma from tumor‐associated macrophages via the JAK/STAT3 and PI3K/AKT signaling pathways promoted progression of lung cancer. Int J Clin Oncol. 2017;22:1026‐1033. [DOI] [PubMed] [Google Scholar]
- 39. Ritprajak P, Azuma M. Intrinsic and extrinsic control of expression of the immunoregulatory molecule PD‐L1 in epithelial cells and squamous cell carcinoma. Oral Oncol. 2015;51:221‐228. [DOI] [PubMed] [Google Scholar]
Associated Data
This section collects any data citations, data availability statements, or supplementary materials included in this article.
Supplementary Materials