Abstract
DEP domain containing 1 (DEPDC1) protein is a novel oncoantigen upregulated in multiple types of cancers which present oncogenic activity and high immunogenicity. However, the function and therapeutic potential of DEPDC1 in hepatocellular carcinoma (HCC) remain unclear. In the present study, we showed that DEPDC1 was frequently upregulated in HCC and associated with cancer diagnosis and poor prognosis for HCC patients. Moreover, DEPDC1 promotes HCC cell proliferation in vitro as well as carcinogenesis in vivo. Notably, DEPDC1 overexpression also increases the neoplasm metastasis ability of HCC cells both in vivo and in vitro. Gene set enrichment analysis results showed that DEPDC1 expression is positively correlated with K‐RAS signal pathway, pathways in cancer and WNT/β‐catenin signal pathway, all of which are closely associated with specific cancer‐related gene sets. Our study provides the basis for further investigation of the molecular mechanism by which DEPDC1 promotes the development and metastasis of HCC.
Keywords: carcinogenesis, cell proliferation, DEP domain containing 1 protein, hepatocellular carcinoma, neoplasm metastasis
1. INTRODUCTION
Primary liver cancer is one of the most malignant and prevalent tumors in adults and is the leading cause of death in China.1, 2, 3 In particular, hepatocellular carcinoma (HCC) is one of the most frequent primary liver cancers with poor prognosis and an increasing worldwide incidence.4 Although medical technology has greatly improved and advanced clinical applications, such as surgical resection, liver transplantation, targeted drug therapy, radiation therapy and chemotherapy have emerged, the 5‐year survival rate of HCC is still no more than 30%.5 Moreover, the molecular mechanisms underlying hepatic carcinogenesis remain elusive.
Transcription factor (TF) protein plays multifunctional roles throughout the life of cells and the organism and they function in a coordinated way to direct cell division, cell growth, cell migration and organization.6, 7 Groups of TF are either tumor suppressors or oncogenes and, thus, mutations or dysregulated transcription of them is associated with cancer, such as nuclear factor kappa B (NF‐κB), AP‐1 and the STAT family.8, 9, 10, 11 The Cancer Genome Atlas (TCGA) has carried out a comprehensive, multidimensional repertoire of genomic changes in 33 types of cancer,12, 13, 14 including DNA methylation, gene expression, miRNA expression, exon expression, gene‐level mutation, copy number, and clinical information for HCC patients. The open‐access TCGA data provide a great resource for investigators to explore this area and to identify new methods for cancer diagnosis, treatment and prevention.
In the present study, we obtained the latest TF catalog including 1935 genes and analyzed the transcriptional profiles of these TF in the TCGA liver hepatocellular carcinoma (LIHC) dataset.15, 16 We identified 331 upregulated TF genes and 72 downregulated TF genes in HCC tissue. Among the genes identified, 110 TF correlated with poor patient prognosis. Furthermore, we found DEP domain containing 1 (DEPDC1) most significantly associated with overall patient survival, and that DEPDC1 can serve as a biomarker for HCC diagnosis. Notably, DEPDC1 was further shown to have a biological signature in hepatocarcinogenesis validated by in vivo and in vitro experimental validation. Our results demonstrate a novel mechanism for the oncogenic role of DEPDC1 in HCC and suggest DEPDC1 as a potential therapeutic target.
2. MATERIALS AND METHODS
2.1. Tissue specimens
All human tissue specimens were obtained from June 2013 to November 2017 at the Department of Oncology, The Second Affiliated Hospital of Harbin Medical University. Totally, a collection of 24 pairs of HCC and normal liver tissues was snap‐frozen and preserved in liquid nitrogen until use. None of the patients had received previous radiation treatment. All human tissue was collected according to protocols approved by the Ethics Committee of the Second Affiliated Hospital of Harbin Medical University. Written consent was obtained from all subjects. Studies using human material were approved by the Second Affiliated Hospital of Harbin Medical University.
2.2. Cell culture
SMMC‐7721, SK‐HEP‐1 and HEK‐293T cells were obtained from Harbin Medical University (Harbin, China). All cell lines were cultured in DMEM (Gibco, New York, NY, USA). All cells were cultured at humidified 37°C with a 5% CO2 atmosphere in DMEM supplemented with 10% FBS, 100 U/mL penicillin, and 100 μg/mL streptomycin.
2.3. Quantitative real‐time PCR
Cell lines and tissue total RNA were extracted using TRIzol reagent (Thermo Fisher Scientific, Waltham, MA, USA) according to the manufacturer's instructions. Complementary DNA was synthesized using the PrimeScriptRT reagent kit (TaKaRa Bio, Tokyo, Japan). Quantitative real‐time PCR (qPCR) was carried out using an iQ5 machine and SYBR Premix Ex Taq II (TaKaRa). Relative gene expression from cell lines was calculated and normalized to β‐actin. Relative genomic level of tumor tissues was compared with that of normal liver tissues. The primers that were used are listed in Supporting Information Table S1.
2.4. Western blot analysis
Proteins were separated by SDS‐PAGE and transferred to nitrocellulose membrane (Bio‐Rad, Hercules, CA, USA). Thereafter, membranes were blocked in PBS/Tween‐20 containing 5% non‐fat milk and incubated with the indicated primary antibodies. Proteins were detected using ECL reagents (Thermo Fisher Scientific). The primary antibodies used were anti‐DEPDC1 (Cell Signaling Technology, Beverly, MA, USA) and anti‐β‐actin (ProteinTech Group, Chicago, IL, USA).
2.5. shRNA stable expression
Three shRNA retroviruses targeting human DEDPC1 and a control shRNA retrovirus were constructed using a three‐plasmid packaging system. Briefly, the lentiGuide‐Puro (lenti‐gRNA, #52963; Addgene, Watertown, MA, USA) vector expressing the shRNA sequence was cotransfected into HEK‐293T cells. After 48 hours of incubation, the viral supernatant was collected and used to transduce cells in the presence of 10 μg/mL polybrene (Sigma Aldrich, St Louis, MO, USA). The infected cells were selected with puromycin (1 μg/mL) for 1 week to generate stable shRNA‐expressing cancer cells and then continuously cultured with 0.5 μg/mL puromycin. The sh‐RNA sequence that was used is listed in Supporting Information Table S2.
2.6. Lentivirus production and infection
Lentiviral particles were received 48 hours after pWPXL lentiviral vector was cotransfected with the packaging plasmid psPAX2 and the VSV‐G envelope plasmid pMD2.G into HEK‐293T cells using Lipofectamine 2000 reagent (Invitrogen, Carlsbad, CA, USA). The cells were infected with recombinant lentivirus plus 6 μg/mL polybrene (Sigma Aldrich).
2.7. Cell proliferation and colony formation assays
Cell proliferation assay was measured using CCK‐8 (Dojindo, Kyushu, Japan) at 1, 3, and 5 days after lenti‐DEPDC1 or lenti‐vector SMMC‐7721 infection. Cells were seeded into a 96‐well plate at a density of 1500 cells/well, and 10 μL CCK‐8 was added to 90 μL culture medium per well. The cells were subsequently incubated at 37°C for 2 hours, and optical density was measured at 450 nm. For colony formation assays, 1000 cells were seeded into each well of a six‐well plate. Approximately 14 days after culturing, the cells were stained with 0.1% crystal violet and 20% methanol. Images were taken and the colonies were counted.
2.8. In vivo assays for tumor formation
For in vivo proliferation assays, SMMC‐7721 cells stably expressing sh‐DEPDC1 or sh‐control were harvested and suspended in DMEM. Each mouse (male BALB/c‐nu/nu, 6 weeks old) was injected in the lower back with 2 × 10⁶ SMMC‐7721 cells in 200 μL serum‐free DMEM. After 60 days, mice were killed and examined for growth of tumors. The mice were housed and manipulated using protocols approved by the Heilongjiang Medical Experimental Animal Care Commission.
2.9. In vitro migration and invasion assays
Migration was carried out in a Transwell assay in a 24‐well chamber, and 4 × 10⁴ cells were plated in the upper chamber with a non‐coated membrane. For the invasion assays, 2 × 10⁵ cells were placed into the upper chamber with a Matrigel‐coated membrane. After 24 hours of culturing, cells that migrated or invaded were fixed and stained in 20% methanol and dye solution containing 0.1% crystal violet. The number of cells that had migrated or invaded was counted and imaged using an inverted microscope (Olympus, Tokyo, Japan).
2.10. In vivo assays for metastasis
For the in vivo metastasis assays, 2 × 10⁶ SMMC‐7721 cells with lenti‐DEPDC1 or lenti‐vector transfection were mixed in 0.2 mL serum‐free DMEM and s.c. injected into nude mice liver (female BALB/c‐nu/nu mice, 10 per group). After 60 days, the mice were killed, and their livers and lungs were dissected, then fixed with phosphate‐buffered neutral formalin, and prepared for standard histological examination. Number of metastatic foci in liver and lung was determined using H&E staining in tissue sections under a binocular microscope (Olympus).
2.11. Survival and hazard analysis
Expression levels of all HCC samples for each selected TF gene were used to investigate whether the expression level of a given TF gene is associated with prognosis in HCC patients. All HCC samples were dichotomized into two groups using the median expression level for each gene. Kaplan‐Meier analysis was used to evaluate the overall survival time for the two groups. Differences in the survival times were compared using the log‐rank test. Univariate Cox analysis and multivariate Cox proportional hazards regression model were used to determine the independent factors that influenced survival and recurrence based on the investigated variables.
2.12. Gene set enrichment analysis
Gene set enrichment analysis (GSEA) was used to identify genes (grouped as gene sets) comparatively enriched between sh‐DEPDC1 and sh‐control SMMC‐7721 cells. Curated gene sets compiled from the Hallmark Gene Set Collection and the Kyoto Encyclopedia of Genes and Genomes were pulled from the Molecular Signature Database of GSEA. Expression data of DEPDC1 downregulation and control cells were analyzed using the GSEA tool (version 2.2.1).
2.13. Statistical analysis
Student's t test and Mann‐Whitney test were used after using the Shapiro‐Wilk test to determine data normality. Distributions of data were expressed as mean ± SD. P‐value < .05 was considered statistically significant. Two‐way ANOVA was used to analyze differences in the CCK‐8 results between groups.
Diagnostic efficiency of DEPDC1 and alpha‐fetoprotein (AFP) was evaluated by ROC (receiver operating characteristic curve). In addition, the Youden's index was generated to evaluate the optimized cut‐off point and calculate the exact sensitivity and specificity of the variable. Comparison of two ROC curves and the area under the curve (AUC) 95% confidence intervals were calculated according to the DeLong method. All statistical analyses were carried out using R language (version 3.4.2, Auckland, New Zealand); The following R packages were used in this study: “pROC”, “ROCR”, “rms”, “survival”, and “pheatmap”.
3. RESULTS
3.1. Transcription factor genes differentially expressed in LIHC samples
To analyze the expression level of TF in liver cancer development, we examined 1935 TF genes from TCGA expression profile. Then, we used the hierarchical clustering method to further elaborate the expression of all TF in HCC samples. Fifty paired tissue samples (normal liver and HCC tissue) were used for differential expression analysis. Results showed that 331 TF were upregulated in tumor samples compared with normal samples, whereas 72 TF were downregulated (Figure 1A; Table S3).
Figure 1.
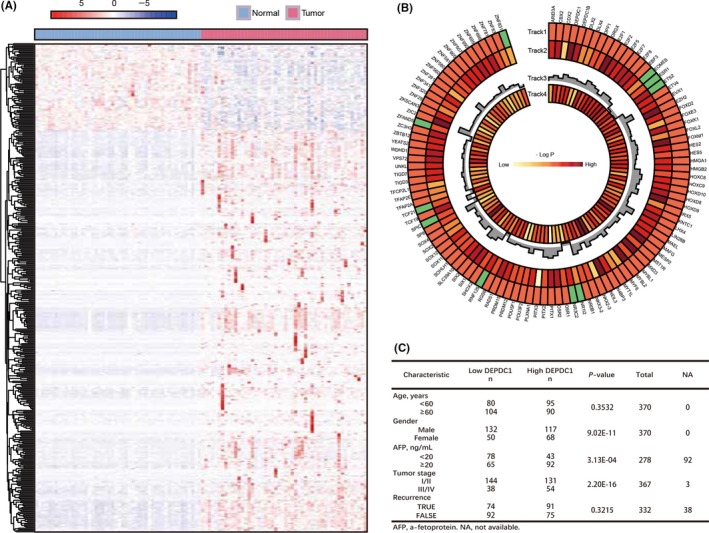
Transcriptomic analyses of differentially expressed transcription factor genes in The Cancer Genome Atlas (TCGA) liver hepatocellular carcinoma (LIHC) cohort. A, Heatmaps of unsupervised clustering of differently expressed transcription factor genes in 50 pairs of normal and hepatocellular carcinoma (HCC) samples from TCGA LIHC cohort, with rows representing genes and columns representing samples. B, Track 1 shows 100 upregulated (red boxes) and 10 downregulated (green boxes) transcription factor genes in liver HCC samples. P‐values on track 2 were generated from Kaplan‐Meier analysis of overall survival. Track 3 shows the fold‐change of differentially expressed genes, and track 4 shows somatic mutation frequency. Genes whose expression levels were significantly associated with overall patient survival are shown in red. C, Correlation of clinicopathological features with tumor DEP domain containing 1 (DEPDC1) expression level in TCGA LIHC cohort
To investigate the roles of TF in HCC patients for prognosis evaluation, an overall survival analysis was carried out to determine the association of these differentially expressed TF and patients’ survival time. Three hundred seventy TCGA clinical characteristics and whole TF expression profiles were used for survival analyses. Samples were classified into two groups according to the median gene expression level for each TF, and the difference of accumulated survival curves between two groups was carried out by Kaplan‐Meier analysis (see Methods). As a result, 10 downregulated and 100 upregulated TF genes were significantly correlated with overall survival (P < .05, log‐rank test, Figure 1B). Somatic mutation frequencies of all the significantly expressed TF genes in TCGA are also shown in Figure 1B. Additionally, we investigated a possible correlation between clinical characteristics and tumor DEPDC1 expression level in TCGA LIHC patients. Results showed that patients with high DEPDC1 expression level had significant correlation with poorly differentiated tumors and high AFP level (Figure 1C).
3.2. DEP domain containing 1 is frequently upregulated in HCC and is associated with cancer diagnosis and poor prognosis in HCC patients
To compare the expression level of DEPDC1 in HCC tissues and normal tissues, we carried out real‐time PCR on 24 HCC biopsy tissues and 24 paired liver tissues of healthy controls. DEPDC1 was significantly upregulated at the mRNA level in HCC samples compared with normal liver tissues (P < .001, Figure 2A). Kaplan‐Meier survival analysis showed that HCC patients with high DEPDC1 expression had poorer outcomes (P < .001, Figure 2B).
Figure 2.
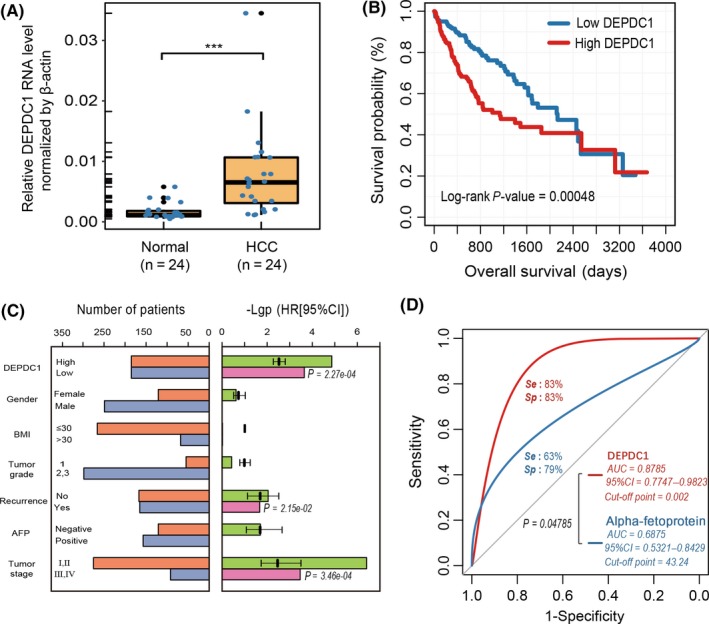
Differential DEP domain containing 1 (DEPDC1) expression level shows diagnostic and prognostic significance in liver hepatocellular carcinoma (LIHC) samples. A, Expression level of DEPDC1 in 24 paired hepatocellular carcinoma (HCC) tissues. B, Overall survival of The Cancer Genome Atlas (TCGA) LIHC patients with DEPDC1 expression level. P‐values were calculated using the log‐rank test. C, Risk evaluation of DEPDC1 and clinical parameters. Left bar panel shows the number of patients in different groups divided by the status of each clinical parameter. Right bar panel shows the P‐value (−log10 transformed) and hazard ratio of univariate Cox regression for each clinical parameter. The clinical parameter with a significant P‐value (< .01) was selected to construct multivariate Cox regression, and the significant P‐value is indicated beside the corresponding bars (pink). BMI, body mass index. D, Receiver operating characteristic curve of DEPDC1 expression level contrasted with alpha‐fetoprotein (AFP; ng/mL) on 24 paired HCC tumor and normal liver tissues. ***P < .001
To investigate whether the expression level of DEPDC1 was an independent prognostic factor from TCGA LIHC cohort, we applied univariate and multivariate analyses using the Cox proportional hazard regression model comparing DEPDC1 expression value with clinicopathological factors (gender, body mass index [BMI], tumor grade, tumor stage, tumor recurrence and AFP level) as covariates. Univariate analysis showed that expression level of DEPDC1, tumor stage and tumor recurrence were prognostic factors that were significantly correlated with patients’ overall survival (Figure 2C). Moreover, multivariate cox regression analysis constructed by these three independent factors showed that HCC patients with a high expression level of DEPDC1 in tumors harbored a 1.238‐fold high risk of death (95% CI, 1.105‐1.387, P‐value = 2.27e‐04) (Figure 2C).
We then investigated the utility of DEPDC1 for HCC diagnostic prediction compared with the traditional diagnostic biomarker AFP. In bio‐proven HCC patients, normalized expression level (Δct normalized by β‐actin) of DEPDC1 from RT‐PCR and serum AFP level (ng/mL) was used to construct a ROC curve to evaluate the diagnostic efficiency in HCC. As a result, DEPDC1 has a higher diagnostic sensitivity and specificity than AFP for HCC diagnosis (AUC 0.8785 vs 0.6875, P < .05, Figure 2D). Thus, these results showed that upregulated expression of DEPDC1 is an independent unfavorable prognostic factor in HCC and can serve as an excellent biomarker for HCC diagnosis.
3.3. DEP domain containing 1 promotes HCC cell proliferation and tumorigenicity in vitro and in vivo
To further investigate the effects of DEPDC1 on HCC cell proliferation and tumorigenicity, we knocked down DEPDC1 expression through shRNA‐mediated silencing in two different HCC cell lines, SMMC‐7721 and SK‐HEP‐1. Knockdown efficiency was validated by RT‐PCR and western blot which confirmed that DEPDC1 expression was significantly depleted at both mRNA and protein levels in two cell lines (Figure S1A). We then examined whether silencing of DEPDC1 could affect the proliferation of HCC cell lines. Results of CCK‐8 proliferation and colony formation assay clearly indicated that knockdown of DEPDC1 led to significant inhibition of proliferation in both SMMC‐7721 and SK‐HEP‐1 cell lines (Figure 3A,B).
Figure 3.
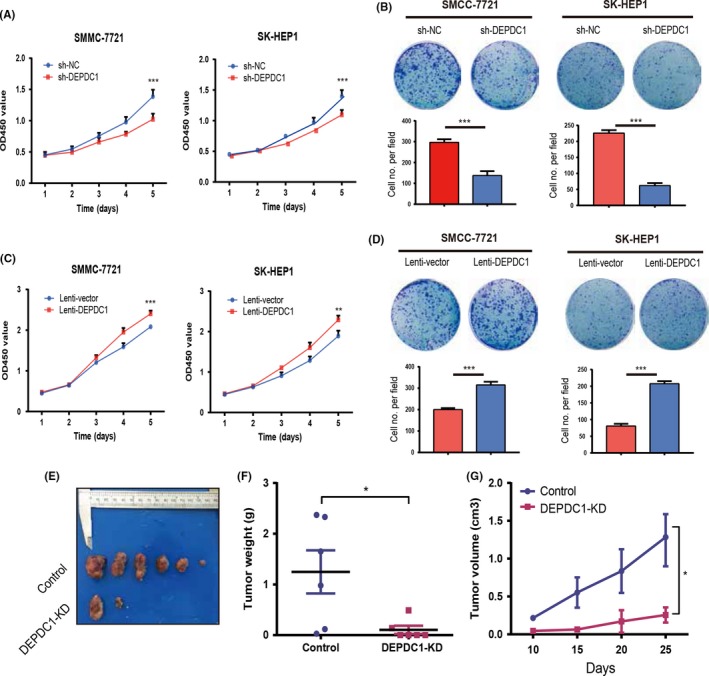
DEP domain containing 1 (DEPDC1) promotes hepatocellular carcinoma (HCC) cell proliferation in vitro and in vivo. A, Proliferation of SMMC‐7721 and SK‐HEP‐1 cell transfer with a pool of three DEPDC1 sh‐RNAs measured by a cell counting assay. B, Colony formation for SMMC‐7721 and SK‐HEP‐1 cells target with a pool of three DEPDC1 sh‐RNAs was measured by colony formation assay. C, Proliferation results of SMMC‐7721 and SK‐HEP‐1 cells overexpressing DEPDC1 was measured by cell counting assay. D, Colony formation results of SMMC‐7721 and SK‐HEP‐1 cells overexpressing DEPDC1 measured by colony formation assay. E, Macroscopic photographs of xenograft tumors derived from control and DEPDC1‐KD SMCC‐7721 cell line. F,G, Weight (F) and volume (G) of SMMC‐7721 xenograft tumors with or without DEPDC1 knockdown. Data are presented as median (F) or means ± SEM (G) (n = 6 mice per group). *P < .05; **P < .01; *** P < .001
Moreover, we overexpressed DEPDC1 in both SMCC‐7721 and SK‐HEP‐1 cell lines using the lentivirus system to construct two stable DEPDC1‐overexpressed HCC cell lines. Overexpression efficiency was evaluated by RT‐PCR and western blot (Figure S1B). Subsequently, the effect of DEPDC1 overexpression on tumor cell proliferation was determined by CCK‐8 and colony formation assay. Results showed that overexpression of DEPDC1 significantly promoted proliferation of SMMC‐7721 and SK‐HEP‐1 cell lines (Figure 3C,D).
To further explore the effects of DEPDC1 on HCC tumor growth in vivo, we used SMCC‐7721 cells which were transduced with sh‐DEPDC1 and sh‐control and implanted into the flanks of nude mice. The mice were monitored closely for tumor growth for 6 weeks. Results showed that tumors derived from sh‐control cells were significantly bigger than those derived from sh‐DEPDC1 cells in terms of both tumor volume and weight (Figure 3F,G). These results illustrated that DEPDC1 significantly promotes HCC cell proliferation both in vitro and in vivo.
3.4. DEP domain containing 1 promotes HCC cell invasion and migration in vitro and in vivo
To determine the effect of DEPDC1 on cell metastasis, Transwell migration and invasion assays were carried out in vitro. Results showed that DEPDC1 knockdown by shRNA significantly repressed migration and invasion of HCC cell lines (Figure 4A), whereas overexpression of DEPDC1 significantly enhanced HCC cell migration and invasion (Figure 4B). Moreover, we transplanted the DEPDC1‐overexpressing cells and control cells that were derived from SMCC‐7721 cell lines into the liver of nude mice. After the transplantation, cells grew within the liver for 8 weeks. The mice were then killed and the number of metastatic foci were examined under a microscope. Results showed that DEPDC1 significantly increased the metastatic ability of SMCC‐7721 in vivo (Figure 4C,D).
Figure 4.
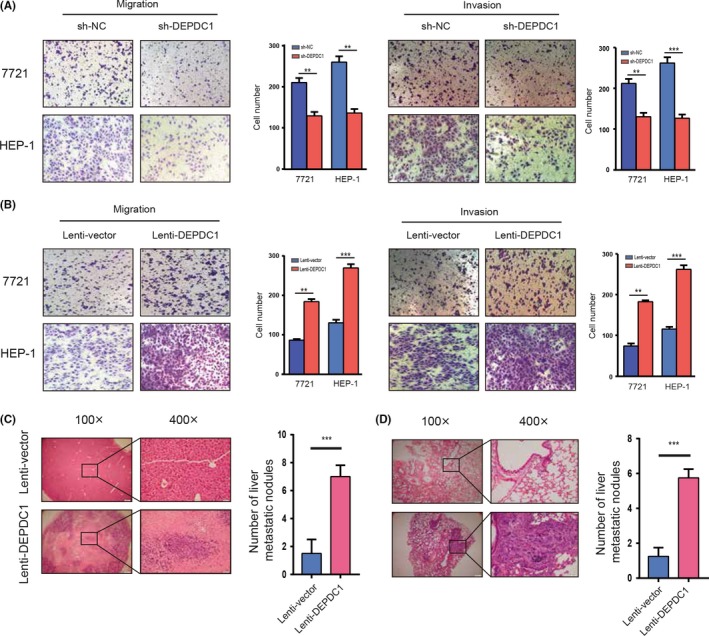
DEP domain containing 1 (DEPDC1) promotes hepatocellular carcinoma cell metastasis and invasion in vivo and in vitro. A, Transwell migration and invasion assays for SMMC‐7721 and SK‐HEP‐1 cells transfected with DEPDC1 siRNAs or control, respectively. B, Results of Transwell migration and invasion assays for SMMC‐7721 and SK‐HEP‐1 infected with the lentivirus overexpressing DEPDC1 or the control, respectively. C,D, In vivo metastasis assay of SMMC‐7721 cells infected with lentivirus expressing DEPDC1 and control. Cells were orthotopically injected into nude mice liver. The mice were killed after 8 weeks feed, and the livers (C) and lungs (D) of mice were processed for immunohistochemical staining. H&E staining of sections with metastatic nodules in the liver, lung and number of metastatic nodules were analyzed by Student's t test. **P < 0.01; *** P < 0.001
3.5. Gene set enrichment analysis of DEPDC1‐associated signaling pathways
To evaluate the contribution of DEPDC1 on HCC development, we carried out DEPDC1 knockdown in SMMC‐7721 cells and then undertook RNA‐seq analysis. We evaluated transcriptomic profile changes in sh‐DEPDC1 and sh‐control samples and found 26 upregulated genes and 152 downregulated genes (|fold‐change >2|, Table S4). To further explore the biological role of DEPDC1 in HCC in an unbiased way, we carried out GSEA of RNA‐seq data. Functional annotation showed genes in the top‐scoring processes, such as the K‐RAS signal pathway, pathways in cancer and the WNT/β‐catenin signal pathway (Figure 5A‐C), all of which were selected according to nominal P‐value rank. Then, we selected the significantly changed genes in the aforementioned three pathways for validation. mRNA levels showed that alteration of DEPDC1 expression significantly changed the expression of most of the selected genes in the SMCC‐7721 cells (Figure 5D), including NR4A2, SEPP1, EDN2, LYPD3, MMP9, WNT6, RAC2, WNT1, PTCH1 and CTNNB1. The oncogenic function of RAC2, NR4A2, MMP9 WNT1, PTCH1 and CTNNB1 has been reported in HCC.17, 18, 19, 20, 21, 22 These results indicated that DEPDC1 may activate specific oncogenic signal pathways to promote HCC cell proliferation and metastasis.
Figure 5.
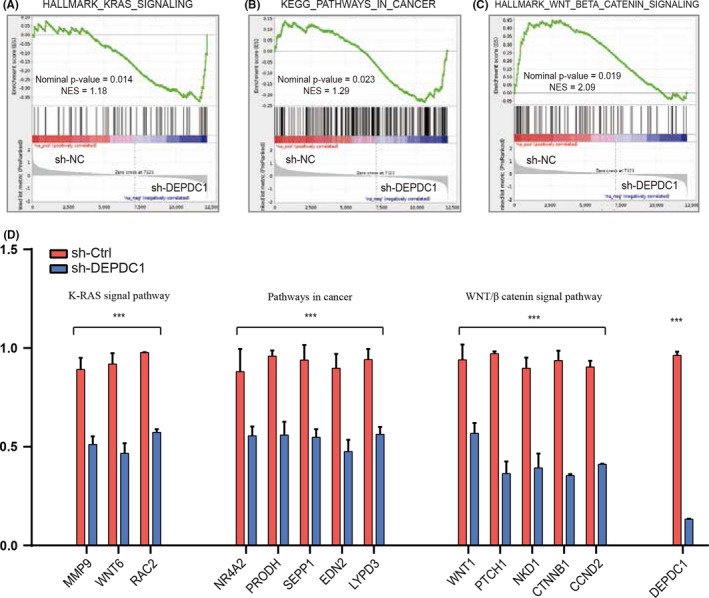
Gene set enrichment analysis of DEP domain containing 1 (DEPDC1)‐regulated cancer‐related pathways. A‐C, Genes involved in the Kyoto Encyclopedia of Genes and Genomes (KEGG) K‐RAS signal pathway, pathways in cancer and WNT/β catenin signal pathway showed significant change in DEPDC1 shRNA or control in SMMC‐7721 cell based on RNA sequencing. Normalized enrichment scores (NES) for each gene and the value of the ranking metric moving down or moving up the list of ranked genes is shown. D, Real‐time PCR analysis shows a significant decrease in the expression levels of MMP9, WNT6, RAC2, NR4A2, PRODH, SEPP1, EDN2, LYPD3, WNT1, PTCH1, NKD1, CTNNB1 and CCND2 in SMMC‐7721 cells infected with sh‐DEPDC1. ***P < 0.001
4. DISCUSSION
Several studies have shown that DEPDC1 is aberrantly overexpressed in diverse human cancers and acts as an oncogene in tumorigenesis and tumor progression.23, 24, 25, 26 In a previous study, Feng et al27 reported that DEPDC1 is essentially required for accelerating cell cycle progression and motility in nasopharyngeal carcinoma through the NF‐κB signal pathway. In another study, researchers discovered an oncogenic role of DEPDC1 in prostate cancer through activation of E2F signaling which has a broad impact on HCC progression.28 Moreover, miR‐130a, acting as a tumor suppressor miRNA, epigenetically downregulated DEPDC1 expression and changed key molecular and phenotypic features in prostate carcinogenesis.29 In the present study, we carried out a combination of transcriptomic analyses evaluated by Kaplan‐Meier analysis to investigate the correlation between the expression level of oncogenic TF genes with patient prognosis in TCGA HCC tissue samples.
Alpha‐fetoprotein is a traditional biomarker for prognostic assessment and early diagnosis of HCC. However, its low sensitivity renders it inadequate to identify all patients that will develop HCC.30 In the present study, DEPDC1 expression level had a higher diagnostic sensitivity and specificity than AFP for detecting HCC patients, which confirmed the utility of a combined diagnostic method by DEPDC1 and AFP in HCC diagnosis and prognosis.26 In addition, we confirmed the role of DEPDC1 in proliferation and metastasis by using lentivirus knockdown and overexpression systems as well as in vivo experiments to further verify our in vitro results (Figure S2).
For a preliminary exploration of the DEPDC1 oncogenic mechanism in HCC, we developed SMMC‐7721 sh‐DEPDC1 and sh‐control cells and then undertook RNA‐seq analysis. GSEA of the RNA‐seq data showed that the K‐RAS, WNT/β‐catenin signal pathway, and pathways in cancer were differentially enriched, which promote tumorigenesis, cell metastasis and cell proliferation in HCC.31, 32 These results demonstrated that DEPDC1 might promote HCC cell proliferation and metastasis through activation of these signaling pathways. However, further investigation of the molecular mechanisms of DEDPC1 is necessary.
In conclusion, we showed that DEPDC1 regulates HCC cell proliferation and metastasis both in vivo and in vitro. Low expression of DEPDC1 correlated with repression of oncogenic pathways. Our study provided a new way to investigate the molecular mechanism by which DEPDC1 influences HCC progression and gives a potential therapeutic target for HCC treatment.
CONFLICTS OF INTEREST
Authors declare no conflicts of interest for this article.
Supporting information
QU D, Cui F, Lu D, Yang Y, Xu Y. DEP domain containing 1 predicts prognosis of hepatocellular carcinoma patients and regulates tumor proliferation and metastasis. Cancer Sci. 2019;110:157–165. 10.1111/cas.13867
Qu and Cui contributed equally to this work.
Contributor Information
Yu Yang, Email: yangyu13836125585@163.com.
Yuqing Xu, Email: YuQX1983@163.com.
REFERENCES
- 1. Chen W, Zheng R, Baade PD, et al. Cancer statistics in China, 2015. CA Cancer J Clin. 2016;66:115‐132. [DOI] [PubMed] [Google Scholar]
- 2. Chen WQ, Li H, Sun KX, et al. Report of Cancer Incidence and Mortality in China, 2014. Zhonghua Zhong Liu Za Zhi. 2018;40:5‐13. [DOI] [PubMed] [Google Scholar]
- 3. Naghavi M, Wang H, Lozano R, et al. Global, regional, and national age‐sex specific all‐cause and cause‐specific mortality for 240 causes of death, 1990‐2013: a systematic analysis for the Global Burden of Disease Study 2013. Lancet. 2015;385:117‐171. [DOI] [PMC free article] [PubMed] [Google Scholar]
- 4. Rapisarda V, Loreto C, Malaguarnera M, et al. Hepatocellular carcinoma and the risk of occupational exposure. World J Hepatol. 2016;8:573‐590. [DOI] [PMC free article] [PubMed] [Google Scholar]
- 5. Goh GB, Chang PE, Tan CK. Changing epidemiology of hepatocellular carcinoma in Asia. Best Pract Res Clin Gastroenterol. 2015;29:919‐928. [DOI] [PubMed] [Google Scholar]
- 6. Karin M. Too many transcription factors: positive and negative interactions. New Biol. 1990;2:126‐131. [PubMed] [Google Scholar]
- 7. Lee TI, Young RA. Transcription of eukaryotic protein‐coding genes. Annu Rev Genet. 2000;34:77‐137. [DOI] [PubMed] [Google Scholar]
- 8. Libermann TA, Zerbini LF. Targeting transcription factors for cancer gene therapy. Curr Gene Ther. 2006;6:17‐33. [DOI] [PubMed] [Google Scholar]
- 9. Feng C, Wu B, Fan H, Li C, Meng S. [NF‐kappaB‐induced gp96 up‐regulation promotes hepatocyte growth, cell cycle progression and transition]. Wei Sheng Wu Xue Bao. 2014;54:1212‐1220. [PubMed] [Google Scholar]
- 10. Hsieh MJ, Lin CW, Yang SF, Chen MK, Chiou HL. Glabridin inhibits migration and invasion by transcriptional inhibition of matrix metalloproteinase 9 through modulation of NF‐kappaB and AP‐1 activity in human liver cancer cells. Br J Pharmacol. 2014;171:3037‐3050. [DOI] [PMC free article] [PubMed] [Google Scholar]
- 11. Yang S, Luo C, Gu Q, et al. Activating JAK1 mutation may predict the sensitivity of JAK‐STAT inhibition in hepatocellular carcinoma. Oncotarget. 2016;7:5461‐5469. [DOI] [PMC free article] [PubMed] [Google Scholar]
- 12. Chin L, Andersen JN, Futreal PA. Cancer genomics: from discovery science to personalized medicine. Nat Med. 2011;17:297‐303. [DOI] [PubMed] [Google Scholar]
- 13. Chin L, Hahn WC, Getz G, Meyerson M. Making sense of cancer genomic data. Genes Dev. 2011;25:534‐555. [DOI] [PMC free article] [PubMed] [Google Scholar]
- 14. Tomczak K, Czerwinska P, Wiznerowicz M. The Cancer Genome Atlas (TCGA): an immeasurable source of knowledge. Contemp Oncol (Pozn). 2015;19:A68‐A77. [DOI] [PMC free article] [PubMed] [Google Scholar]
- 15. Vaquerizas JM, Kummerfeld SK, Teichmann SA, Luscombe NM. A census of human transcription factors: function, expression and evolution. Nat Rev Genet. 2009;10:252‐263. [DOI] [PubMed] [Google Scholar]
- 16. Wilson D, Charoensawan V, Kummerfeld SK, Teichmann SA. DBD–taxonomically broad transcription factor predictions: new content and functionality. Nucleic Acids Res. 2008;36:D88‐D92. [DOI] [PMC free article] [PubMed] [Google Scholar]
- 17. Zhang JY, Weng MZ, Song FB, et al. Long noncoding RNA AFAP1‐AS1 indicates a poor prognosis of hepatocellular carcinoma and promotes cell proliferation and invasion via upregulation of the RhoA/Rac2 signaling. Int J Oncol. 2016;48:1590‐1598. [DOI] [PubMed] [Google Scholar]
- 18. Zhu B, Sun L, Luo W, et al. Activated Notch signaling augments cell growth in hepatocellular carcinoma via up‐regulating the nuclear receptor NR4A2. Oncotarget. 2017;8:23289‐23302. [DOI] [PMC free article] [PubMed] [Google Scholar]
- 19. Chen X, Liao Y, Yu Y, et al. Elevation of MAP17 enhances the malignant behavior of cells via the Akt/mTOR pathway in hepatocellular carcinoma. Oncotarget. 2017;8:92589‐92603. [DOI] [PMC free article] [PubMed] [Google Scholar]
- 20. Ahsani Z, Mohammadi‐Yeganeh S, Kia V, Karimkhanloo H, Zarghami N, Paryan M. WNT1 gene from WNT signaling pathway is a direct target of miR‐122 in hepatocellular carcinoma. Appl Biochem Biotechnol. 2017;181:884‐897. [DOI] [PubMed] [Google Scholar]
- 21. Wu X, Zhao B, Cheng Y, et al. Melittin induces PTCH1 expression by down‐regulating MeCP2 in human hepatocellular carcinoma SMMC‐7721 cells. Toxicol Appl Pharmacol. 2015;288:74‐83. [DOI] [PubMed] [Google Scholar]
- 22. Yang Y, Zhang N, Zhu J, et al. Downregulated connexin32 promotes EMT through the Wnt/beta‐catenin pathway by targeting Snail expression in hepatocellular carcinoma. Int J Oncol. 2017;50:1977‐1988. [DOI] [PMC free article] [PubMed] [Google Scholar]
- 23. Harada Y, Kanehira M, Fujisawa Y, et al. Cell‐permeable peptide DEPDC1‐ZNF224 interferes with transcriptional repression and oncogenicity in bladder cancer cells. Cancer Res. 2010;70:5829‐5839. [DOI] [PubMed] [Google Scholar]
- 24. Kanehira M, Harada Y, Takata R, et al. Involvement of upregulation of DEPDC1 (DEP domain containing 1) in bladder carcinogenesis. Oncogene. 2007;26:6448‐6455. [DOI] [PubMed] [Google Scholar]
- 25. Kassambara A, Schoenhals M, Moreaux J, et al. Inhibition of DEPDC1A, a bad prognostic marker in multiple myeloma, delays growth and induces mature plasma cell markers in malignant plasma cells. PLoS ONE. 2013;8:e62752. [DOI] [PMC free article] [PubMed] [Google Scholar]
- 26. Yuan SG, Liao WJ, Yang JJ, Huang GJ, Huang ZQ. DEP domain containing 1 is a novel diagnostic marker and prognostic predictor for hepatocellular carcinoma. Asian Pac J Cancer Prev. 2014;15:10917‐10922. [DOI] [PubMed] [Google Scholar]
- 27. Feng X, Zhang C, Zhu L, et al. DEPDC1 is required for cell cycle progression and motility in nasopharyngeal carcinoma. Oncotarget. 2017;8:63605‐63619. [DOI] [PMC free article] [PubMed] [Google Scholar]
- 28. Huang L, Chen K, Cai ZP, et al. DEPDC1 promotes cell proliferation and tumor growth via activation of E2F signaling in prostate cancer. Biochem Biophys Res Commun. 2017;490:707‐712. [DOI] [PubMed] [Google Scholar]
- 29. Ramalho‐Carvalho J, Martins JB, Cekaite L, et al. Epigenetic disruption of miR‐130a promotes prostate cancer by targeting SEC23B and DEPDC1. Cancer Lett. 2017;385:150‐159. [DOI] [PubMed] [Google Scholar]
- 30. Leguy MC, Tavares SR, Tsatsaris V, Lewin F, Clauser E, Guibourdenche J. Assessment of AFP in amniotic fluid: comparison of three automated techniques. Ann Biol Clin (Paris). 2011;69:441‐446. [DOI] [PubMed] [Google Scholar]
- 31. Li T, Li S, Chen D, et al. Transcriptomic analyses of RNA‐binding proteins reveal eIF3c promotes cell proliferation in hepatocellular carcinoma. Cancer Sci. 2017;108:877‐885. [DOI] [PMC free article] [PubMed] [Google Scholar]
- 32. Shukla R, Upton KR, Munoz‐Lopez M, et al. Endogenous retrotransposition activates oncogenic pathways in hepatocellular carcinoma. Cell. 2013;153:101‐111. [DOI] [PMC free article] [PubMed] [Google Scholar]
Associated Data
This section collects any data citations, data availability statements, or supplementary materials included in this article.
Supplementary Materials


