Abstract
Podocalyxin‐like protein (PODXL), a transmembrane glycoprotein with anti‐adhesive properties, is associated with an aggressive tumor phenotype and poor prognosis of several cancers. To elucidate the biological significance of PODXL and its molecular mechanism in gastric cancer (GC), we investigated the expression of PODXL in GC samples and assessed its effects on biological behaviors and the related signaling pathways in vitro and in vivo. Moreover, the possible and closely interacted partners of PODXL were identified. Our data showed that the protein or mRNA level of PODXL was significantly upregulated in tissues or serum of GC patients compared with normal‐appearing tissues (NAT) or those of healthy volunteers. Overall survival (OS) curves showed that patients with high PODXL levels in tissues or serum had a worse 5‐year OS. In vitro, restoring PODXL expression promoted tumor progression by increasing cell proliferation, colony formation, wound healing, migration and invasion, as well as suppressing the apoptosis. Furthermore, the PI3K/AKT, NF‐κB and MAPK/ERK signaling pathways were activated. There was a significant positive correlation between PODXL and RUN and FYVE domain containing 1 (RUFY1) expression in tissues or serum. Subsequent mass spectrometry analysis, co‐immunoprecipitation assays and western blot analysis identified PODXL/RUFY1 complexes in GC cells, and silencing RUFY1 expression in GC cells significantly attenuated PODXL‐induced phenotypes and their underlying signaling pathways. Our results suggested that PODXL promoted GC progression via a RUFY1‐dependent signaling mechanism. New GC therapeutic opportunities through PODXL and targeting the PODXL/RUFY1 complex might improve cancer therapy.
Keywords: gastric cancer, Mechanism, Podocalyxin‐like, progression, RUN and FYVE domain containing 1
1. INTRODUCTION
Gastric cancer (GC) is the 5th most prevalent malignant tumor and the 3rd leading cause of cancer‐related death worldwide. In 2012, there were nearly 1 million new cases and more than 700 000 deaths worldwide.1, 2 Despite the advanced diagnostic techniques and therapeutic approaches, the prognosis of GC patients is unsatisfactory, mainly because of our poor understanding of its causes and pathogenesis. Numerous molecules contribute to GC through partially characterized or unknown mechanisms.3 Therefore, it is crucial to search for highly specific markers for predicting prognosis and response to therapy.3, 4
Podocalyxin‐like protein is a cell surface transmembrane glycoprotein that belongs to the CD34 family.5 PODXL was first defined as a heavily sialylated and sulfated membrane protein, which expressed on the apical surface of glomerular epithelial cells or podocytes in the kidney.6 Subsequent research detected PODXL expression in hematopoietic stem cells, hemangioblasts, vascular endothelial cells, podocytes and a subset of neural progenitors.7, 8, 9 PODXL mainly regulated cell morphology and adhesion through interacting with intracellular proteins and extracellular ligands.10 PODXL disrupted cell junction complex localization and decreased tight junction‐dependent transepithelial resistance.11, 12 Moreover, the association of PODXL with actin‐binding proteins such as Na+/H+ exchanger regulatory factors and ezrin mediated the anti‐adhesive and migratory capabilities of tumor cells, which implicated the significant role of PODXL in tumor progression.13, 14
Podocalyxin‐like protein was expressed in diverse malignancies, and its overexpression was linked to a poor prognosis of cancer patients, including prostate cancer, urothelial bladder cancer, colorectal cancer, glioblastoma, pancreatic cancer and lung adenocarcinoma patients.15, 16, 17, 18, 19, 20 High PODXL expression was associated with features such as large tumor size, high histological grade and undetectable expression of the estrogen and progesterone receptors.21 Surprisingly, multivariate analysis revealed that women with tumors that expressed high PODXL experienced longer disease‐free survival. This was the only evidence that PODXL served as a biomarker in breast cancer with good prognosis.21 To the best of our knowledge, there are few reports on the mechanism of PODXL in GC progression, although there are reports of the poor prognostic value of PODXL expression for GC patients.22, 23, 24 RUN and FYVE domain containing 1 (RUFY1) is a member of the RUFY family, whose members contain an N‐terminal RUN domain and a C‐terminal FYVE domain.25, 26 RUFY proteins are localized predominantly to early endosomes and participate in the regulation of diverse cellular processes.25, 27, 28, 29, 30 For example, RUFY1 acted as a downstream effector of Etk. Tyrosine phosphorylation of RUFY1 by Etk might be important for its endosomal localization.27 RUFY1 regulated integrin trafficking and was involved in the migration of NIH‐3T3 fibroblasts.28 However, its clinical and biological functions in cancers are unknown.
The aim of the present study was to investigate the expression of PODXL in GC tissues and serum, and to assess its effects on biological behaviors in vitro and in vivo. The possible interacting partners of PODXL were explored, and a RUFY1‐dependent mechanism involved was also investigated.
2. MATERIALS AND METHODS
2.1. Clinical specimens and cell culture
Gastric cancer tissues and their corresponding NAT from 130 patients were obtained at the Department of General Surgery, the First Affiliated Hospital of Soochow University from September 2007 to October 2012. Tissues were cut and formalin‐fixed for the immunohistochemistry (IHC). Preoperative and postoperative serum samples were collected from these same patients. Serum from 36 normal subjects served as controls. Blood samples were collected prior to any therapeutic procedures on the day before tumor resections. The paired postoperative GC blood specimens were also obtained on the 7th day post‐surgery. The 5 mL of venous blood from each participant was centrifuged at 1789 g for 10 minutes at 4°C within 2 hours of collection, followed by a 2nd centrifugation at 16 099 g for 15 minutes at 4°C to eliminate any residual cells debris. Supernatant serum was then stored at −80°C until further processing. All patients underwent histological diagnosis and resections without chemotherapy or radiotherapy before surgery. Patients included entered a 5‐year follow‐up program. The human GC cell lines were obtained from the ATCC (Manassas, VA, USA). Cells were cultured in RPMI‐1640 medium supplemented with 10% FBS at 37°C in 5% CO2.
2.2. Upregulation of podocalyxin‐like protein and downregulation of podocalyxin‐like protein (or RUN and FYVE domain containing 1) in gastric cancer cells
The full‐length coding sequence of PODXL was amplified using RT‐PCR from human GC tissues, and the cDNA was inserted into the pMSCV‐GFP vector. The PODXL primers were 5′‐GAAGATCTCCAGAGGCGACGACACGATGC‐3′ and 5′‐CCGCTCGAGCTCTGTGGTGCTGCTGGAGGC‐3′. The PODXL‐specific shRNA (siRNA13‐PODXL, siRNA14‐PODXL and siRNA15‐PODXL) were introduced into cells using a recombinant lentivirus gene delivery system (with red fluorescence protein [RFP]). The siRNA were designed and synthesized by GeneChem Biomedical (Shanghai, China). Lentivirus supernatants were used to infect GC cells. The lentiviral infection efficiencies were determined according to GFP (or RFP) expression and verified using quantitative RT‐PCR (qRT‐PCR) or western blotting. Similarly, a LV‐RUFY1‐siRNA expressing RFP was purchased from GeneChem (Shanghai, China). Lentiviral infectious efficiencies were verified using western blot. Cells transfected with a scrambled shRNA vector were designated siRNA‐Con568, and cells treated with LV‐RUFY1‐siRNA were designated siRNA‐RUFY1. SGC‐7901 cells that stably expressed PODXL were simultaneously infected with the lentivirus supernatants of cells expressing shRNA‐RUFY1 and were designated PODXL‐siRNA‐RUFY1.
2.3. Immunohistochemistry
Tissues were fixed in neutral‐buffered formalin and embedded in paraffin. Sections (4‐μm thick) were cut and placed on silane‐coated slides. Tissue sections were incubated in a dry oven at 60°C for 1 hour and then deparaffinized in xylene 3 times for 10 minutes; they were rehydrated using a graded series of ethanol concentrations for 5 minutes. Antigen retrieval was performed by pretreating the slides in .01 mol/L citrate buffer (pH 6.0) for 10 minutes in a microwave oven. The sections were treated with 3% H2O2 for 10 minutes to block endogenous peroxidase activity. The slides were then blocked with 5% BSA (Boster Bioengineering, Wuhan, China) and incubated with polyclonal antibodies against PODXL (diluted 1:200, ab150358, Abcam) and RUFY1 (diluted 1:200, ALS16125, Abgent) overnight at 4°C. The sections were then incubated with diluted secondary antibody for 45 minutes at 37°C. Finally, the slides were visualized with 3, 3′‐diaminobenzidine, counterstained with hematoxylin and evaluated under a light microscope. The staining intensities of PODXL and RUFY1 were quantified by 2 independent experienced pathologists who were blinded to the data of patients. The number of positive tumor cells and degrees of staining were recorded in 5 randomly chosen fields. The extent of positive tumor cells was quantified according to the following criteria: score 0 (<10% positively stained cells), score 1 (11%‐25% positively stained cells), score 2 (26%‐50% positively stained cells), score 3 (>51%‐75% positively stained cells) and score 4 (>75% positively stained cells). Staining intensity was scored as follows: 0 = negative, 1 = weakly positive, 2 = moderately positive and 3 = strongly positive. Finally, the above scores were multiplied to obtain a total score: <6 as the low level (or negative staining) and ≥6 as the high level (or positive staining).
2.4. Confocal laser scanning microscopy
Gastric cancer cells that differentially expressed PODXL were cultured in 3.5‐cm glass‐bottom dishes (.5 × 105 cells/mL) and incubated overnight at 37°C. The next day, the medium was removed and washed with PBS, fixed in 4% paraformaldehyde for 15 minutes, permeabilized with .1% Triton X‐100 for 5 minutes and blocked with 5% BSA. The cells were incubated with 2 primary antibodies at room temperature for 2 hours as follows: anti‐F‐actin, dilution 1:400 (anti‐red fluorescent protein, ab112127; anti‐green fluorescent protein, ab139481, Abcam) at room temperature for 20 minutes. To visualize nuclei, cells were stained with DAPI at room temperature for 5 minutes. Images were obtained using a Zeiss confocal fluorescence microscope (LSM 510).
2.5. Quantitative RT‐PCR
Total RNA were extracted, and equivalent amounts of RNA (2 μg) were reverse‐transcribed using the M‐MLV reverse transcriptase with oligo (dT). Triplicates were performed using FastStart Universal SYBR Green Master (Roche Diagnostics GmbH, Mannheim, Germany). The primers of PODXL (5′‐TGAACCTCACAGGAAACACC‐3′ and 5′‐GCCGTATGCCGCACTTATC‐3′), RUFY1 (5′‐CTCTTAAGCGAGTTCTATGAGC‐3′ and 5′‐TTCATGCTCCTTGCCACCATC‐3′), MFF (5′‐ACGAACACTCTTCCGCTACG‐3′ and 5′‐ TGAGAGCCACTTTTGTCCCC‐3′), GRP78 (5′‐GAACGTCTGATTGGCGATGC‐3′ and 5′‐ACCACCTTGAACGGCAAGAA‐3′), TGM3 (5′‐TGGCATGATTGGCTGGAACT‐3′ and 5′‐ CCAGCAAGCACACCATTGTC‐3′), UBC (5′‐AGTAGTCCCTTCTCGGCGAT‐3′ and 5′‐GACGATCACAGCGATCCACA‐3′), CALML5 (5′‐TACGAGGAGTTCGCGAGGAT‐3′ and 5′‐AGAGTCCCAGCACAAAAGCA‐3′) and GAPDH (5′‐GGCACCACCATGTACCCTGGCAT‐3′ and 5′‐TCCTGCTTGCTGATCCACATCTGCT‐3′) were synthesized by Sangon Biotech (Shanghai, China). All samples were processed in replicate, and the mRNA levels were quantified and expressed as 1000 × 2‐∆Ct or 2‐∆∆Ct.
2.6. Western blotting and co‐immunoprecipitation analyses
Total proteins were prepared using standard procedures and quantified using the Bicinchoninic Acid (BCA) method (Pierce, Rockford, USA). For IP, cell lysates were treated with agarose‐protein A for 1 hour and incubated overnight at 4°C with the appropriate protein G‐conjugated primary antibodies. Beads were washed 3 times with RIPA buffer, denatured in boiling sample buffer, fractionated through SDS‐PAGE gels and transferred to PVDF membranes, which were blocked in 5% skim milk for 2 hours at room temperature and incubated overnight with the indicated primary antibodies. After washing in Triethanolamine‐Buffered Saline Solution with Tween (TBS‐T), the membranes were incubated with the appropriate secondary antibodies for 1 hour at room temperature, washed again in TBS‐T and visualized using an enhanced chemiluminescence kit (ECL‐kit, Santa Cruz Biotechnology, USA). Band densities were normalized to those of GAPDH. All experiments were performed in triplicate. Antibodies against PODXL (#150358 for western blotting and #205350 for co‐immunoprecipitation [co‐IP]) and RUFY1 (13498‐1‐AP) were purchased from Abcam and Proteintech (USA), respectively. Antibodies against PI3K (#4257), p‐PI3K (#4228), AKT (#4691), p‐AKT (#4060), MAPK (#8690), p‐MAPK (#4511), ERK1 (#ab109282), p‐ERK1 (#ab24157), NF‐κB (#8242), p‐NF‐κB (#3036), caspase‐3 (#9662), Bax (#5023), Bcl‐2 (#15071), MMP‐2 (#87809) and MMP‐9 (#13667) were purchased from Cell Signaling Technology or Abcam (USA). Antibodies against GAPDH (#5174) were purchased from Abgent (USA).
2.7. Silver staining and sample processing
Protein bands in the analytical gels were visualized using the Fast Silver Stain Kit (Beyotime, China). The enzymatic reduction reagent was added to the centrifuge tube and incubated at 50°C for 30 minutes on an oscillator. The gel was washed with 25 mmol/L ammonium bicarbonate, incubated with proteases and then reacted with alkylating reagents at room temperature for 45 minutes. The gel was then washed and dehydrated with 100% acetonitrile and dried at room temperature. The enzyme solution was incubated with the gel overnight. The gelatin was extracted with gelatinized extract, the enzyme was hydrolyzed, and the extract and dehydrating solution were combined and vacuum‐dried. The samples were then desalted and purified for mass spectrometry (MS).
2.8. Mass spectrometry and data analysis
Samples were resuspended in 40 μL of aqueous formic acid, and 8 μg of each sample was analyzed using an Ultimate 3000 RSLCnano, coupled with an Orbitrap Elite mass spectrometer (Thermo Fisher, San Jose, CA, USA). Separations were performed using a Zorbax 300SB‐C18 column (Agilent Technologies, Santa Clara, CA, USA). The gradient was linear from 0% to 44% of solvent B for 120 minutes, delivered at 50 μL/min. The Elite‐Orbitrap MS was operated in data‐dependent mode. Each full MS scan (120 000 resolving power) was followed by MS/MS scans, and the 5 most intense multiply charged ions were dynamically selected and fragmented by collision‐induced dissociation at a normalized collision energy = 27%. Samples were analyzed individually and simultaneous proteomic analysis was performed. Tandem mass spectra were extracted and charge‐state deconvoluted using Proteome Discoverer (Thermo Fisher, version 1.4.1.14). We used Sequest to compare all MS/MS spectra with entries in the UniProt database. Searches were performed using a parent ion tolerance = 5 ppm and a fragment ion tolerance = .60 Da. Trypsin was specified as the enzyme, allowing for 2 missed cleavages. Fixed modification of carbamidomethyl (C) and variable modifications of oxidation (M) and deamidation were specified in Sequest.
2.9. Cell proliferation and colony formation assay
Cells were harvested and incubated (3 × 10³ cells per well) with 100 μL of culture medium in 96‐well plates at 37°C in an atmosphere containing 5% CO2; 10 μL of CCK‐8 (Dojindo, Japan) was added to each well. After incubation for 2 hours at 37°C, OD450 absorbencies at different times were measured using a plate reader (ELx800, BioTek Instruments, USA). Cell growth was expressed as the relative absorbance minus the absorbance of the culture medium.
Single‐cell suspensions (3 × 10³) were added to 6‐well plates containing complete culture medium with .3% agar on the top of .6% agar in the same medium. The plates were incubated at 37°C in an atmosphere containing 5% CO2 for 14 days, and the colonies were fixed and stained with 3‐(4, 5‐dimethylthiazol‐2‐yl)‐2, 5‐diphenyltetrazolium bromide (5 mg/mL). Colonies containing at least 50 cells were scored.
2.10. Flow cytometric analysis and Hoechst33342 staining
Cell apoptotic rates were determined using the Annexin V Apoptosis Detection Kit PE or FITC according to the manufacturer's instructions (#88810272 and 88800572; Invitrogen, Carlsbad, CA, USA). Briefly, cells were harvested, washed with PBS and resuspended in 1× Binding Buffer to 1 × 10⁶ cells/mL. 5 μL Annexin‐V‐PE (or Annexin‐V‐FITC) and 5‐μL PI were added to 100 μL of the cell suspension and incubated for 15 minutes in the dark at room temperature. After incubation, 400 μL 1× Binding Buffer was added. Cells were analyzed using a flow cytometer. For Hoechst 33342 staining, cells (2 × 10⁵/mL) were harvested and added to 10 μL Hoechst 33342 (Keygen Biotech, Nanjing, China) for 15 minutes in the dark at 37°C. After centrifuging for 5 minutes and washing with PBS, 1 mL of Buffer A solution (Keygen Biotech, Nanjing, China) was added at room temperature. Finally, 20 μL of cell pellet was dropped onto a glass slide, and the cells were observed using the fluorescence microscope.
2.11. Scratch healing, migration and invasion assays
To assess wound healing, cells were wounded using a pipette tip and the adherent cells were gently washed with PBS. Wound closure was observed for 48 hours. The wound healing activity was expressed relative to the width of wound closure at 0 hours. Transwell chambers (8 μm, 24‐well insert, Corning Lowell, MA, USA) were used for the migration assay. Briefly, 600 μL of medium containing 10% FBS was added to the lower chamber, and 5 × 10³ cells in 200 μL of serum‐free medium were added to the upper chamber. Cells were incubated for 48 hours at 37°C, and the non‐migrated cells were removed using cotton swabs. Finally, the insert membranes were stained with .1% crystal violet and the migrated cells were counted using an inverted microscope. For the invasion assay, the insert membranes were coated with diluted Matrigel (BD Biosciences, CA, USA), and the other procedures were the same as for the migration assay.
2.12. Tumor growth in nude mice
After resuspension in 1× PBS, 5 × 10⁶ of cells in 200 μL were injected subcutaneously into the flanks of 4‐week‐old male BALB/c‐nude mice. Tumor volume (TV) was measured weekly and calculated as follows: TV (mm3) = length × width2 × .5. Mice were killed 5 weeks after inoculation. Tumor weights were calculated, and the tumors were immediately fixed in 10% neutralized formalin. The sections were reacted with an anti‐Ki‐67 antibody (#YM0392, 1:300; Immunoway, USA), an anti‐p‐AKT antibody (#4060, 1:100, Cell Signaling Technology, USA) and an anti‐p‐NF‐κB antibody (#4808, 1:150, Cell Signaling Technology, USA) using the standard IHC techniques described above. The images were photographed under the microscope.
2.13. Statistical analysis
Statistical analysis was performed using SPSS 19.0 software (SPSS, Chicago, IL, USA). All data were presented as the mean ± SD. Differences between groups were analyzed using the Pearson χ2 test, the Student t test or ANOVA. Spearman's rank correlation test was performed to analyze the correlations between PODXL and RUFY1 in tissues or serum. Survival curves were calculated using the Kaplan–Meier method, and the differences among groups were analyzed using the log‐rank test. The Cox's regression model was used for univariate analysis and multivariate analysis. P‐values <.05 were considered statistically significant.
3. RESULTS
3.1. Analysis of podocalyxin‐like protein and RUN and FYVE domain containing 1 expression in gastric cancer patients
As shown in Figure 1A, PODXL and RUFY1 were mainly detected in the cytoplasm. We divided the stained tissues into low and high expression groups according to the total score (<6 or ≥6). When calculating the relative positive percentage of PODXL expression between GC tissues and their corresponding NAT (normal mucosa), we found that PODXL was expressed in 61/130 (46.92%) tumor tissues and 32/130 (24.62%) NAT (P < .05). Similarly, among the 130 GC samples, RUFY1 was expressed at a relatively higher level in GC samples (73/130, 56.15%) compared with NAT (normal mucosa) (42/130, 32.31%; P < .05; Figure 1B,C). The possible associations between PODXL and RUFY1 in GC samples were evaluated using the SPSS software, and a significant positive correlation was found (r = .241, P = .002; Figure 1D). We also compared the percentage of RUFY1 (or PODXL) positive staining between PODXL (or RUFY1) positive and negative staining patients. Our data implied that RUFY1 (or PODXL) maintained a higher positive percentage in PODXL (or RUFY1) positive patients (P < .05; Figure S1A,B). This might imply that these 2 molecules are closely correlated in GC tissues.
Figure 1.
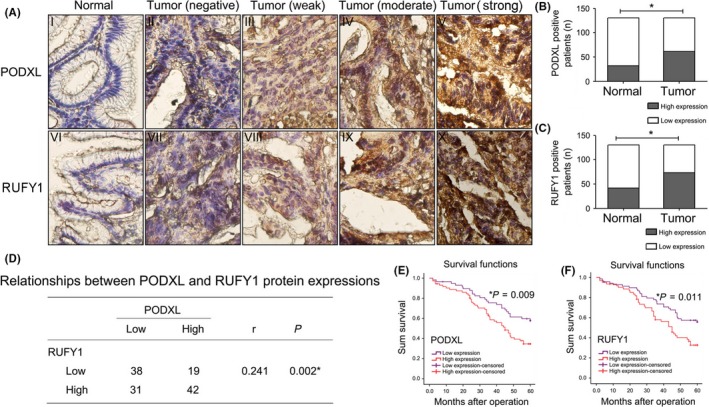
Immunohistochemical analysis of podocalyxin‐like protein (PODXL) and RUN and FYVE domain containing 1 (RUFY1) expression in gastric cancer (GC) tissues and the association of expression levels with the prognosis of GC patients. A, Representative images of PODXL and RUFY1 staining in GC tissues and their corresponding normal‐appearing tissues (NAT) (400×). B, C, Relative percentage of PODXL and RUFY1 positive staining in GC tissues and their corresponding NAT. D, A significant positive correlation between PODXL and RUFY1 expression was detected. E, F, Survival analysis showed that GC patients with high tissue levels of PODX or RUFY1 had a worse 5‐year OS compared with patients with low levels of each protein (*P < .05)
Overall survival curves were plotted, and the curves showed that GC patients with high PODXL levels had a worse 5‐year OS compared to patients with low PODXL levels (P = .009). Similarly, high RUFY1 levels also led to a poor prognosis in GC patients (P = .011; Figure 1E,F). The univariate and multivariate analysis using Cox's proportional hazards model showed that high protein expressing levels of tissue PODXL and RUFY1 retained as independent and significant prognostic factors for survival (PODXL, HR = 3.9, 95%CI = 2.272‐6.695, P = .0001, Table S1; RUFY1, HR = 1.799, 95%CI = 1.009‐3.208, P = .047, Table S2).
3.2. Association of tissue podocalyxin‐like protein (or RUN and FYVE domain containing 1) protein expression with clinicopathological factors of gastric cancer patients
According to the results from IHC staining, we evaluated the associations of PODXL (or RUFY1) with patients' clinicopathological features. The analysis revealed that high levels of PODXL in tumor tissues positively correlated with tumor size, depth of cancer invasion, lymph node metastasis, distant metastasis and TNM stage (P < .05). Meanwhile, the levels of tissue RUFY1 were also associated with tumor size, depth of cancer invasion, distant metastasis and TNM stage (P < .05; Table 1).
Table 1.
Relationships between PODXL (or RUFY1) and clinicopathological factors in 130 gastric cancer tissues
| Factors | Number of patients | PODXL | RUFY‐1 | ||||
|---|---|---|---|---|---|---|---|
| Low | High | P | Low | High | P | ||
| Gender | |||||||
| Male | 76 | 39 | 37 | .633 | 29 | 47 | .121 |
| Female | 54 | 30 | 24 | 28 | 26 | ||
| Age (year) | |||||||
| ≤65 | 87 | 46 | 41 | .947 | 35 | 52 | .237 |
| >65 | 43 | 23 | 20 | 22 | 21 | ||
| Tumor size | |||||||
| ≤5 cm | 78 | 48 | 30 | .018a | 40 | 38 | .036a |
| >5 cm | 52 | 21 | 31 | 17 | 35 | ||
| Site of tumor | |||||||
| Cardia | 35 | 13 | 22 | .086 | 19 | 16 | .176 |
| Body | 52 | 31 | 21 | 18 | 34 | ||
| Antrum | 43 | 25 | 18 | 20 | 23 | ||
| Depth of cancer invasion | |||||||
| T2 | 24 | 18 | 6 | .017a | 16 | 8 | .013a |
| T3‐T4 | 106 | 51 | 55 | 41 | 65 | ||
| Lymph node metastasis | |||||||
| Negative | 44 | 31 | 13 | .005a | 24 | 20 | .079 |
| Positive | 86 | 38 | 48 | 33 | 53 | ||
| Distant metastasis | |||||||
| Negative | 82 | 50 | 32 | .012a | 44 | 38 | .003a |
| Positive | 48 | 19 | 29 | 13 | 35 | ||
| TNM stage | |||||||
| I‐II | 40 | 31 | 9 | .000a | 25 | 15 | .004a |
| III‐IV | 90 | 38 | 52 | 32 | 58 | ||
P < .05
PODXL, podocalyxin‐like protein; RUFY1, RUN and FYVE domain containing 1.
3.3. Podocalyxin‐like protein and RUFY1 mRNA were elevated in the serum of gastric cancer patients and associated with prognosis
As shown in Figure 2A, our results from qRT‐PCR analysis showed that the levels of PODXL in serum were significantly higher than those of healthy volunteers (normal group; P < .05). Furthermore, PODXL mRNA levels in patients with lymph node metastases (Lx group), advanced stage (III‐IV) or distant metastases (M1) were higher than those without lymph node metastases (L0), who were early stage (I‐II) or who were without distant metastases (M0) (P < .05; Figure 2B‐D). Similar results were observed in GC patients with high serum RUFY1 levels (P < .05; Figure 2E‐H). We also collected the paired postoperative GC blood specimens on the 7th day post‐surgery. The data showed that both PODXL and RUFY1 mRNA levels significantly decreased after tumor resections when compared to their corresponding preoperative expressions, respectively (P < .05; Figure S2A,B).
Figure 2.
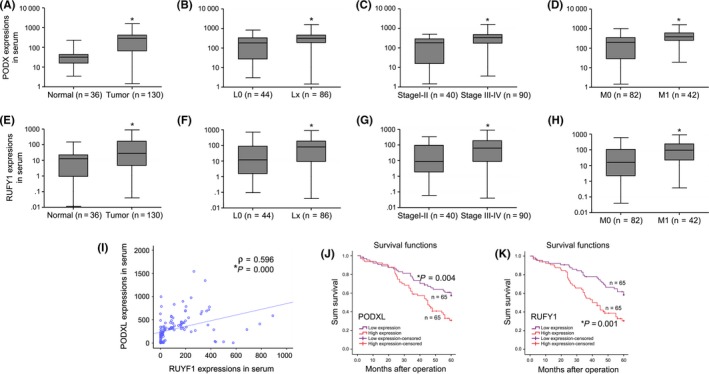
Analysis of the expression of podocalyxin‐like protein (PODXL) and RUN and FYVE domain containing 1 (RUFY1) mRNA in gastric cancer (GC) serum and the association of expression levels with the prognosis of GC patients. A, Serum PODXL levels in GC patients were significantly increased compared with those of healthy volunteers (normal group). B‐D, Serum PODXL levels in GC patients with positive lymph node metastases (Lx group), advanced stage (III‐IV) or distant metastases (M1) were higher than those without lymph node metastases (L0), of early stage (I‐II) or without distant metastases (M0). E, Serum RUFY1 levels in GC patients were significantly increased compared with those of healthy volunteers (normal group). F‐H, Serum RUFY1 levels in GC patients with positive lymph node metastases (Lx group), advanced stage (III‐IV stage) or distant metastases (M1) were higher than those without lymph node metastases (L0), of early stage (I‐II stage) or without distant metastases (M0). I, PODXL mRNA levels in the serum of GC patients were significantly associated with RUFY1 (r = .596 P = .000). J and K, Survival analysis indicated that GC patients with high levels of serum PODXL or RUFY1 had a shorter OS compared with those with low PODXL or RUFY1 levels (*P < .05)
To verify whether the tissue PODXL (or RUFY1) expression in GC patients was associated with its expression in serum, we first determined the tissue mRNA expressions of these 2 molecules. Our results showed that both PODXL and RUFY1 were significantly overexpressed in tumor tissues compared to the NAT (P < .05; Figure S3A,B). Interestingly, the tissue mRNA expression of PODXL (or RUFY1) was also closely positively correlated with the corresponding levels in serum (P < .05; Figure S3C,D). Moreover, PODXL mRNA levels in the serum were closely associated with those of RUFY1 (r = .596, P = .000; Figure 2I). The survival analysis indicated that the OS of patients with high serum levels of PODXL or RUFY1 was significantly shorter than that of patients with low PODXL or RUFY1 levels (P < .05; Figure 2J,K). Similarly, the univariate and multivariate analysis also confirmed that overexpression of serum PODXL or RUFY1 could serve as an independent prognostic factor for GC survival (PODXL, HR=2.87, 95%CI = 1.693‐4.865, P = .001, Table S3; RUFY1, HR = 3.857, 95%CI = 2.244‐6.63, P = .001, Table S4).
3.4. Establishment of cell lines that differentially expressed podocalyxin‐like protein
Our qRT‐PCR and western blotting results demonstrated that the mRNA and protein levels of PODXL in SGC‐7901 and MKN‐45 cells were relatively moderate, which guided us to choose the appropriate cell lines for the subsequent experiments (Figure 3A,B).
Figure 3.
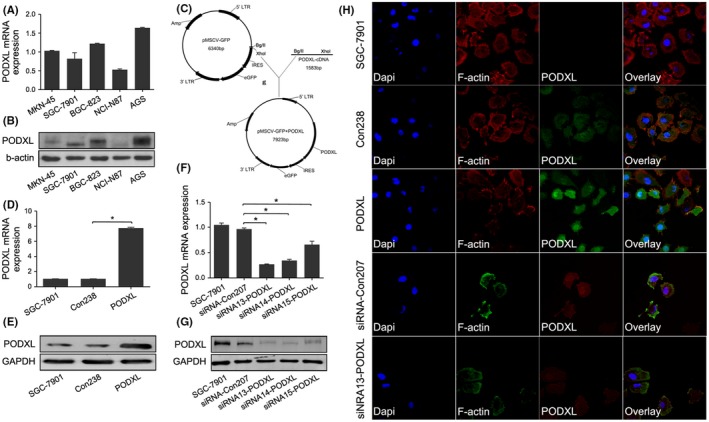
Establishment of gastric cancer (GC) cells that differentially expressed podocalyxin‐like protein (PODXL). A, B, PODXL mRNA and protein levels in GC cell lines (MKN‐45, SGC‐7901, BGC‐823, NCI‐N87 and AGS) were determined using quantitative RT‐PCR (qRT‐PCR) and western blotting. C, Structure of pMSCV‐GFP (top) and PODXL expression by transfected cells (bottom). D, E, The effects of PODXL expression by SGC‐7901 cells were validated using qRT‐PCR and western blotting. F, G, PODXL levels were decreased in cells transfected with siRNA 13‐PODXL. H, Confocal laser scanning microscopy imaging indicated that PODXL was mainly located in the cytoplasm of SGC‐7901 cells. The nuclei and cytoskeleton were stained using DAPI and F‐actin, respectively. (*P < .05)
Human PODXL cDNA were inserted into pMSCV‐GFP vectors, and transfection efficiencies were determined using qRT‐PCR and western blotting (P < .05; Figure 3C‐E). The effects of stable PODXL knockdown in SGC‐7901 cells were validated using qRT‐PCR and western blotting, and confirmed that PODXL expression was significantly downregulated, particularly when cells were transfected with the siRNA designated 13‐PODXL (P < .05; Figure 3F‐G). CSLM images revealed that PODXL localized in the cytoplasm of SGC‐7901 cells, which was consistent with the analysis of GC tissues by IHC (Figure 3H).
3.5. Restoring podocalyxin‐like protein expression promoted the proliferation and colony formation and inhibited the apoptosis of gastric cancer cells
Podocalyxin‐like protein promoted the growth of SGC‐7901 cells at 72 and 96 hours compared with that of Con238 cells. In contrast, downregulation of PODXL was associated with growth inhibition at 72 and 96 hours compared with control‐transfected cells (P < .05; Figure 4A). Apoptosis‐related proteins Caspase‐3, Bax and Bcl‐2, and invasion‐promoting proteins MMP2 and MMP‐9 were detected using western blotting. PODXL overexpression in SGC‐7901 cells increased the levels of Bcl‐2, MMP‐2 and MMP‐9 and decreased the levels of Caspase‐3 and Bax, while PODXL knockdown had the opposite effects (P < .05; Figure 4B,C). Our data also demonstrated that restoring PODXL expression significantly promoted colony formation of GC cells, whereas inhibition of PODXL expression significantly decreased the number of colonies (P < .05; Figure 4D‐E). Two similar experiments (Annexin‐V and Hoechst33342 staining) showed that PODXL decreased the apoptotic rate of SGC‐7901 cells compared with that of the control group, whereas interfering PODXL expression altered the apoptotic rates of GC cells (P < .05; Figure 4F‐I). Similar results were also confirmed in another cell line MKN‐45 (P < .05; Figure S4A‐E).
Figure 4.
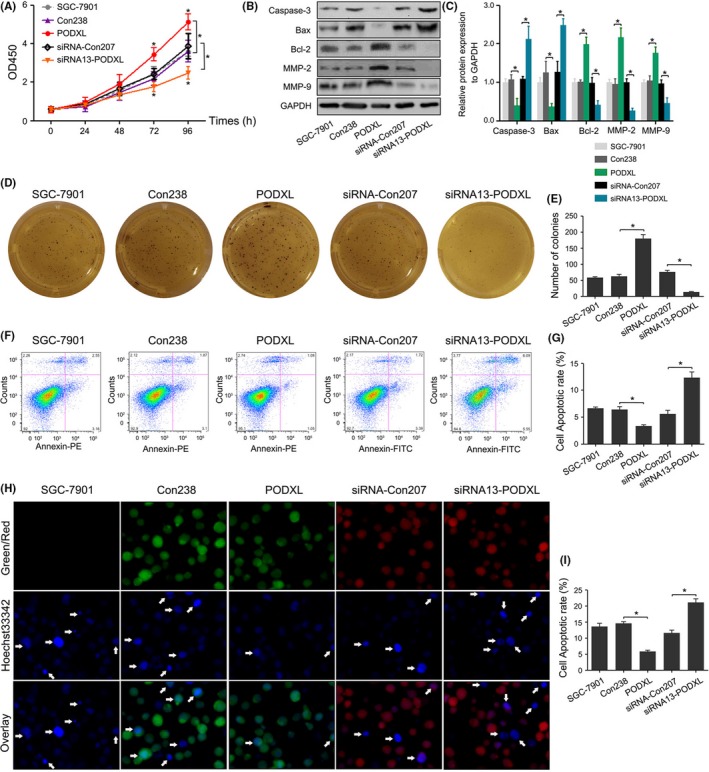
Restoring podocalyxin‐like protein (PODXL) expression promoted the proliferation and colony formation and suppressed apoptosis of gastric cancer (GC) cells in vitro. A, The proliferation of GC cells was monitored every 24 h using the CCK‐8 assay. B, C, Western blotting showed that PODXL overexpression in SGC‐7901 cells increased the expression of Bcl‐2, MMP‐2 and MMP‐9, and decreased the levels of caspase‐3 and Bax, while PODXL knockdown caused the opposite effect. D, E, Restoring PODXL expression significantly promoted colony formation of GC cells, and inhibiting PODXL expression significantly decreased the number of colonies. F‐I, Annexin‐V and Hoechst33342 staining confirmed the changes of apoptotic rates in GC cells (*P < .05)
3.6. Restoring podocalyxin‐like protein promoted the wound healing, migration and invasion of gastric cancer cells and associated with the activation of PI3K/AKT, NF‐κB and MAPK/ERK signaling pathways in vitro
Compared with the control cells, PODXL overexpression significantly promoted the abilities of wound healing, migration and invasion in SGC‐7901 cells. In contrast, silencing PODXL expression had the opposite effects on SGC‐7901 cells (all P < .05; Figure 5A‐F). PODXL overexpression did not significantly change the total levels of PI3K, AKT, MAPK, NF‐κB and ERK1 (all P > .05), while the levels of phosphorylated PI3K, AKT, MAPK, NF‐κB and ERK1 were significantly elevated compared with those of the Con238 group (P < .05). In contrast, phosphorylation of each protein was significantly reduced in cells transfected with the PODXL siRNA when compared with siRNA‐Con207 SGC‐7901 cells (P < .05; Figure 5G,H). We also observed similar changes in biological behaviors in MKN‐45 cells (P < .05; Figure S4F‐J).
Figure 5.
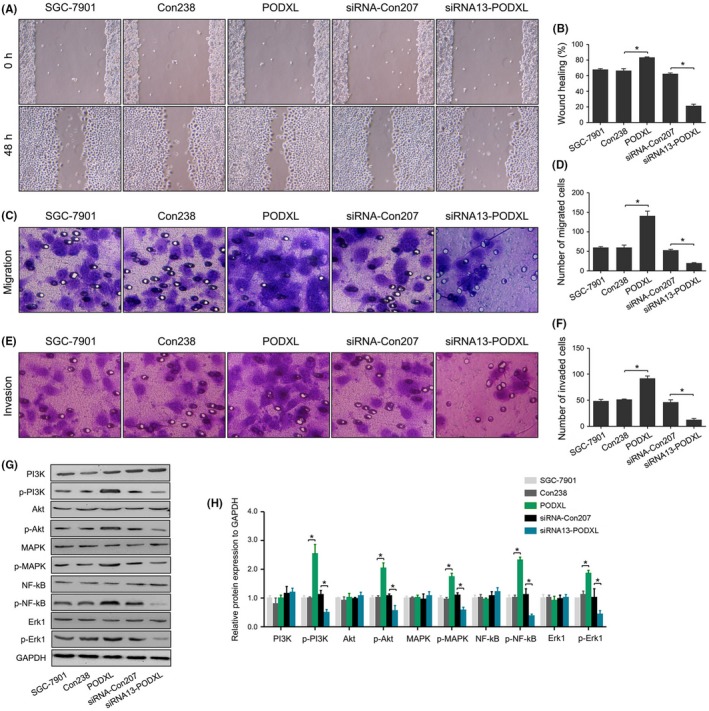
Restoring podocalyxin‐like protein (PODXL) expression promoted the wound healing, migration and invasion of gastric cancer (GC) cells, and activated the PI3K/AKT, NF‐κB and MAPK/ERK signaling pathways in vitro. A, Wound healing assay and statistical analysis. C‐F, Migration, invasion assay and statistical analysis. G and H, PODXL activated the PI3K/AKT, NF‐κB and MAPK/ERK signaling pathways in vitro via upregulation of the levels of phosphorylated PI3K, AKT, MAPK, NF‐κB and ERK1, whereas the total levels of PI3K, AKT, MAPK, NF‐κB and ERK1 were unchanged (*P < .05)
3.7. Restoring podocalyxin‐like protein promoted tumorigenesis in vivo
We further investigated whether PODXL promoted tumorigenesis in vivo by injecting tumor cells subcutaneously into the flanks of BALB/c‐nude mice. Rapid tumor growth was observed in the PODXL group, and the tumor‐inhibiting activity of siRNA13‐PODXL was detected after 35 days (P < .05; Figure 6A). Tumor formation of PODXL‐transfected cells was significantly increased from day 21, and these oncogenic SGC‐7901 cells grew rapidly. However, when inoculated with cells transfected with the PODXL siRNA, the dormant cells grew more slowly compared with the control cells (P < .05; Figure 6B).
Figure 6.
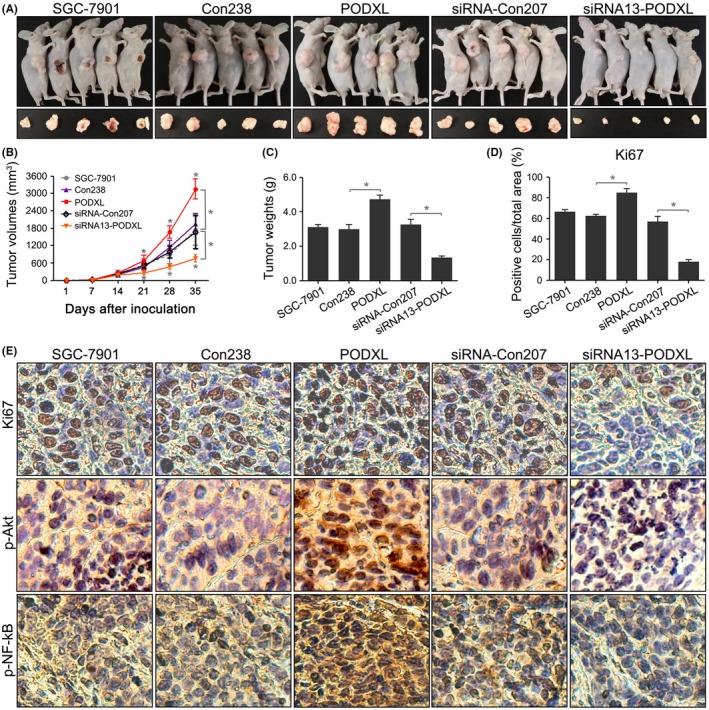
Restoring podocalyxin‐like protein (PODXL) expression promoted tumorigenesis in vivo. A, Re‐expressing PODXL in SGC‐7901 cells promoted tumorigenesis in nude mice, while silencing PODXL inhibited tumor growth. B, Tumor growth curves were generated for each week. C, Tumor weights were compared. D, E, Histological analysis revealed that re‐expressing PODXL in SGC‐7901 cells increased the frequency of Ki67 staining and the expression of p‐Akt and p‐NF‐κB (*P < .05)
Tumor weights and Ki67 expression confirmed the tumorigenic phenotype of PODXL‐transfected SGC‐7901 cells (P < .05; Figure 6C‐E). Furthermore, we detected p‐Akt and p‐NF‐κB expression in the treatment groups. As shown in Figure 6E, compared with untransfected cells, the stable PODXL‐transfected cells overexpressed p‐Akt and p‐NF‐κB, while PODXL knockdown significantly reduced the expression of p‐Akt and p‐NF‐κB in mice tissues. These results supported the conclusion that PODXL promoted tumor growth by upregulating the phosphorylation of certain signaling pathways in vivo.
3.8. Podocalyxin‐like protein interacted with RUN and FYVE domain containing 1 in gastric cancer cells in vitro
To further explore the mechanism of PODXL, we conducted MS analysis to identify MFF, GRP78, TGM3, RUFY1, FSH6Q2, CALL5, TBA1B and ACTB as proteins that potentially interacted with PODXL (Figure 7A,B). In fact, except for the 2 host genes (TBA1B and ACTB), the mRNA expressing changes of another 6 genes after PODXL overexpression, including MFF, GRP78, TGM3, RUFY1, UBC (FSH6Q2) and CALML5 (CALL5), were determined. As shown in Figure S5, RUFY1 might be one of the molecules most influenced molecules by PODXL (P < .05). Therefore, we chose RUFY1 for further study. We performed co‐IP assays to confirm the presence of PODXL/RUFY1 complexes in SGC‐7901 cells (Figure 7C). The data strongly suggested that PODXL closely interacted with RUFY1 in GC cells. However, the upstream or downstream relationships between PODXL and RUFY1 were unknown. Therefore, we performed western blotting to evaluate the levels of PODXL and RUFY1 in GC cells stably overexpressing PODXL that were transfected with a RUFY1‐specific siRNA. Figure 7D showed that overexpressed PODXL effectively upregulated RUFY1 levels in SGC‐7901 cells, while knockdown of RUFY1 significantly reversed RUFY1 expression in PODXL‐transfected cells. In contrast, knocking down RUFY1 expression did not change the levels of PODXL in siRNA‐RUFY1 nor PODXL‐siRNA‐RUFY1 cells compared with the corresponding control groups. These data indicated that PODXL might act as an important and unidirectional regulator of RUFY1 expression in GC cells.
Figure 7.
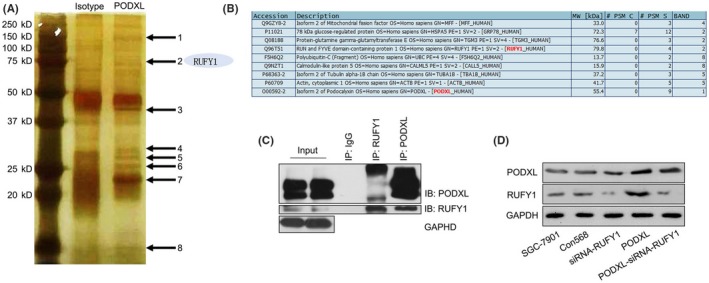
Podocalyxin‐like protein (PODXL) interacted with RUN and FYVE domain containing 1 (RUFY1) in gastric cancer (GC) cells in vitro. A, B, Mass spectrometry identified MFF, GRP78, TGM3, RUFY1, FSH6Q2, CALL5, TBA1B and ACTB as possible interacted partners of PODXL. C, Co‐immunoprecipitation assays detected PODXL/RUFY1 complexes in SGC‐7901 cells. D, Western blotting revealed that re‐expressing PODXL significantly increased the levels of RUFY1, while knocking down RUFY1 expression did not change the PODXL expression in siRNA‐RUFY1 or PODXL‐siRNA‐RUFY1 cells (*P < .05)
3.9. RUN and FYVE domain containing 1 knockdown attenuated podocalyxin‐like protein‐induced biological behaviors via inactivating the PI3K/AKT, NF‐κB and MAPK/ERK signaling pathways in vitro
To further study the regulatory effects of PODXL on RUFY1, multiple in vitro biological experiments were performed. The CCK‐8 assay showed that RUFY1 significantly inhibited the proliferation compared with the siRNA‐Con568 cells. Furthermore, RUFY1 knockdown attenuated the enhanced proliferative ability induced by PODXL overexpression (P < .05; Figure 8A). Figures 8B‐G and 9A‐F showed that siRNA‐RUFY1 inhibited the colony formation, wound healing and invasion, and increased apoptosis, which was associated with downregulation of Bcl‐2, MMP‐2 and MMP9, as well as upregulation of caspase‐3 and Bax.
Figure 8.
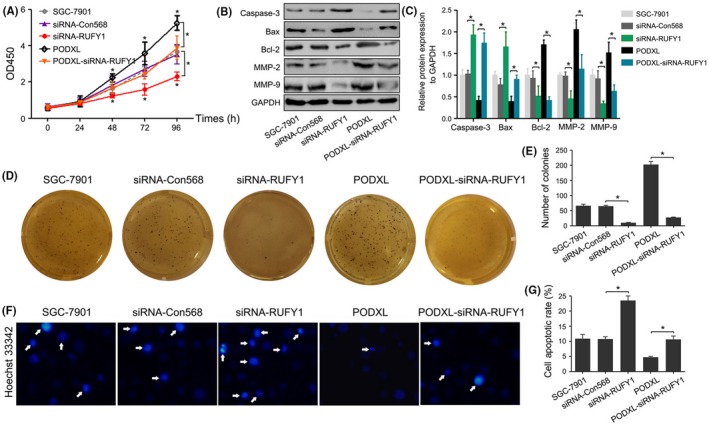
RUN and FYVE domain containing 1 (RUFY1) knockdown attenuated podocalyxin‐like protein (PODXL)‐induced biological behaviors in vitro. A, The CCK‐8 assay revealed that RUFY1 knockdown significantly inhibited the proliferation of gastric cancer (GC) cells at 48, 72 and 96 h and attenuated the proliferative effects of PODXL overexpression at 48, 72 and 96 h. B, Western blotting showed that RUFY1 knockdown altered the levels of caspase‐3, Bax, Bcl‐2, MMP‐2 and MMP9, and attenuated the PODXL‐induced changes of these protein expressions. C and D, RUFY1 knockdown inhibited the colony formation and attenuated PODXL‐induced colony formation. E, F, Hoechst33342 staining showed that RUFY1 knockdown increased apoptosis and attenuated the PODXL‐induced changes in apoptosis (*P < .05)
Figure 9.
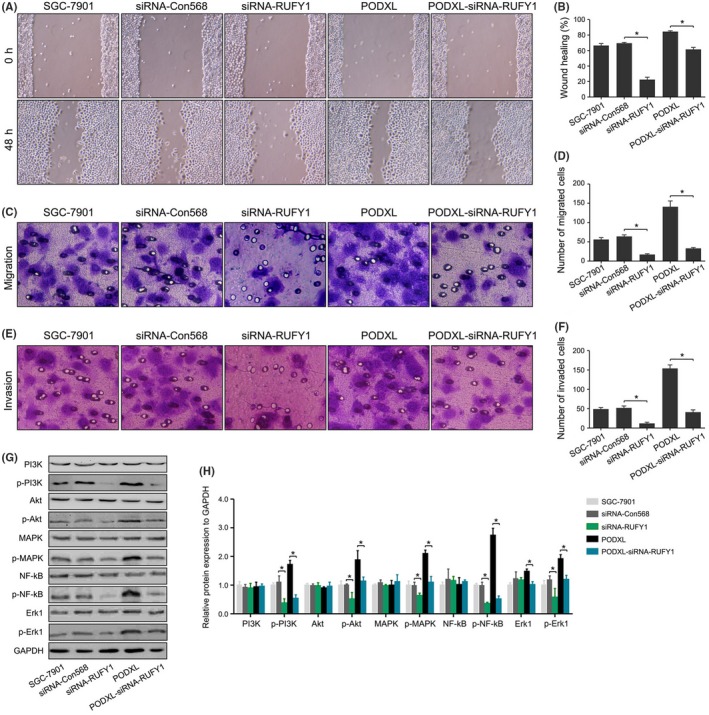
RUN and FYVE domain containing 1 (RUFY1) knockdown attenuated podocalyxin‐like protein (PODXL)‐induced biological behaviors and inactivated the PI3K/AKT, NF‐κB and MAPK/ERK signaling pathways in vitro. A, B, RUFY1 knockdown significantly inhibited the wound healing and attenuated the PODXL‐induced changes in wound healing. C‐F, RUFY1 knockdown significantly inhibited migration and invasion and attenuated the PODXL‐induced changes in migration and invasion. G, H, RUFY1 knockdown significantly inhibited the phosphorylation of PI3K, AKT, MAPK, NF‐κB and ERK1 without significantly changing the basal level of protein expression and attenuated the PODXL‐induced changes in the activation of signaling pathways (*P < .05)
Compared with the PODXL group, knocking down RUFY1 expression significantly reversed these biological activities and protein expressions induced by PODXL. We previously showed that restoring PODXL increased the phosphorylation levels of PI3K, AKT, MAPK, NF‐κB and ERK1. Similar effects were exerted on RUFY1 expression, and the RUFY1 siRNA significantly inhibited the levels of p‐PI3K, p‐AKT, p‐MAPK, p‐NF‐κB and p‐ERK1 without changes in the levels of the cognate unphosphorylated forms, which might partially explain the oncogenic roles of RUFY1 in GC.
When we re‐examined the levels of protein expressions between the PODXL and PODXL‐siRNA‐RUFY1 groups, we found that silencing RUFY1 could downregulate the levels of p‐PI3K, p‐AKT, p‐MAPK, p‐NF‐κB and p‐ERK1 (Figure 9G,H). These findings suggested that the PODXL promoted GC progression in vitro through interacting and upregulating RUFY1 expression in GC cells.
3.10. RUN and FYVE domain containing 1 knockdown attenuated podocalyxin‐like protein‐induced tumorigenesis in vivo
The regulatory effects of PODXL on RUFY1 were also investigated in vivo. Figure 10A,B shows that enhanced PODXL promoted tumor formation in vivo and silencing RUFY1 inhibited tumor growth. PODXL simultaneously expressed in siRNA‐RUFY1 cells reduced their growth rate from day 14 compared with PODXL‐expressing GC cells (P < .05). The tumor weights and Ki67 staining confirmed that RUFY1 knockdown attenuated PODXL‐induced tumorigenesis in vivo (P < .05, Figure 10C‐E).
Figure 10.
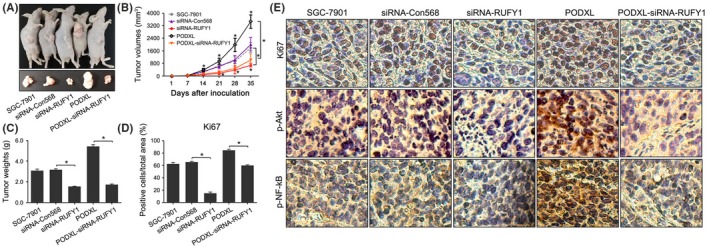
RUN and FYVE domain containing 1 (RUFY1) knockdown attenuated podocalyxin‐like protein (PODXL)‐induced tumorigenesis in vivo. A, RUFY1 knockdown significantly inhibited tumorigenesis in nude mice and attenuated the PODXL‐induced changes in tumor formation. B, Tumor growth curves were generated each week. C, Tumor weights were compared. D, E, Histological analysis revealed that RUFY1 knockdown significantly decreased the expression of Ki67 and the levels of p‐Akt and p‐NF‐κB expressions, and attenuated the PODXL‐induced changes of signaling proteins (*P < .05)
We determined the levels of p‐AKT and p‐NF‐kB in mice tissues. Our data showed that knocking down RUFY1 expression significantly downregulated the expression of p‐AKT and p‐NF‐kB compared with the siRNA‐Con568 group. Re‐expressing PODXL increased the levels of p‐AKT and p‐NF‐kB, while silencing RUFY1 expression in the PODXL‐siRNA‐RUFY1 group led to attenuated expression of p‐AKT and p‐NF‐kB compared with the PODXL group (Figure 10E). These data indicated that RUFY1 might serve as a downstream target of PODXL and a key mediator of PODXL‐related signaling pathways in vivo.
4. DISCUSSION
Podocalyxin‐like protein is a transmembrane glycoprotein with anti‐adhesive properties that was first identified in the kidney.7 In 2003, the role of PODXL in cancer was first described in testicular cancer.31 Since then, mounting evidence had demonstrated that PODXL is overexpressed in diverse cancers and is associated with a more aggressive tumor phenotype and poor outcomes.32 PODXL might participate in the epithelial‐mesenchymal transition (EMT) and interact with different mediators of metastasis. For example, sialofucosylated PODXL was a functional E‐selectin and L‐selectin ligand expressed by metastatic pancreatic cancer cells.13 PODXL overexpression induced the EMT of lung adenocarcinoma cells via the PI3K pathway and contributed to tumor progression.20 As a target gene of miRNA, PODXL functions as a critical factor in the formation of primary tumors and distant tumor metastasis, for example, in testicular cancer, acute myeloid leukemia and pancreatic cancer.33, 34, 35, 36
A study employing tissue microarrays and 2 antibodies (HPA2110 and HES9) to evaluate PODXL expression in GC tumors from 337 patients demonstrated the prognostic role of PODXL in GC.22 Similarly, a study of 174 patients with esophageal or gastric adenocarcinoma revealed that PODXL expression was an independent prognostic biomarker for reduced time to recurrence and poor OS.23 Here, we used the IHC method to detect PODXL expression in GC tissues and their corresponding NAT. A similar analysis performed by others also indicated that PODXL was a target gene of miR‐509‐3‐5p in GC patients and mediated tumor progression.24 Interestingly, our results also showed that PODXL was expressed more frequently in GC tissues compared with NAT. Clinicopathological analysis demonstrated that high PODXL expression was significantly associated with the tumor size, depth of cancer invasion, lymph node metastasis, distant metastasis and TNM stage. When we analyzed OS as a function of PODXL expression, we found that the 5‐year OS was significantly reduced for GC patients with high PODXL expression. Moreover, PODXL levels were significantly higher in the GC serum, particularly in patients with positive lymph node metastases, advanced disease stages and distant metastases. Survival analysis indicated that GC patients with high serum PODXL levels had a shorter OS compared with patients with low PODXL levels. The univariate and multivariate analyses using Cox's proportional hazards model all showed that high expression levels of tissue or serum PODXL were independent and significant prognostic factors for GC survival. We further evaluated the influence of PODXL on biological behaviors and related signaling pathways in vitro and in vivo. Our results demonstrated that restoring PODXL expression promoted tumorigenesis by increasing cell proliferation, colony formation, wound healing, migration and invasion, as well as suppressing apoptosis. These findings indicated that PODXL might act as a tumor‐promoting gene in GC.
Recent studies on the genomic landscape of gastric adenocarcinoma have identified several key signaling molecules, including epidermal growth factor receptor family (ErbB) members, vascular endothelial growth factor (VEGFR) receptor family members, and PI3K/Akt, NF‐κB and MAPK/ERK pathway components, that were implicated in the molecular pathogenesis of GC.37 For example, PI3Kp85α and p‐AKT were expressed in gastric adenocarcinoma tissues, and targeting blockade of the PI3K pathway might inhibit GC growth and metastasis through downregulation of Ki‐67 and MMP‐2 expression.38 Consistent with these findings, the PI3K/Akt inhibitor LY294002 effectively enhanced the chemosensitivity of human GC cells to vincristine.39 NF‐κB controlled the growth and malignant phenotype of GC cells.34 The NF‐κB p65 inhibitor SN50 inhibited the invasiveness of GC cells through downregulating the expression of MMP‐9, PCNA and VEGF, and upregulating the expression of TIMP‐1.40 Similarly, emerging evidence suggested that the alternative MAPK/ERK signaling pathway regulated several sporadic and inflammation‐associated gastrointestinal tract malignancies and exerted a distinct influence on the proliferation, apoptosis, migration and invasion of GC cells.41, 42 Here, we detected the expressions of signaling‐related proteins in GC cells. For example, the levels of p‐PI3K, p‐AKT, p‐MAPK, p‐NF‐κB and p‐ERK1 were significantly elevated by PODXL, which suggested that PODXL might activate the PI3K/AKT, NF‐κB and MAPK/ERK pathways in vitro. These findings enhanced our understanding of the promoting effects of PODXL on the phenotypes of GC cells. Our data in vivo supported the conclusion that PODXL promoted the growth of GC cells and upregulated signaling proteins such as p‐Akt and p‐NF‐κB. This was the first systemic and reliable evidence of PODXL in GC progression.
To further explore the molecular mechanisms of PODXL in GC, we conducted MS analysis and identified 8 proteins, including MFF, GRP78, TGM3, RUFY1, FSH6Q2, CALL5, TBA1B and ACTB as the PODXL potential targets. Among these interacted molecules, RUFY1 might be considered as one of the possible interacting partners of PODXL. Therefore, we chose RUFY1 for further study. Subsequently, we analyzed 130 GC samples and found that RUFY1 levels were higher in GC tissues or serum. RUFY1 protein expression in tissues was significantly associated with the tumor size, depth of cancer invasion, distant metastasis and TNM stage of GC patients. Elevated serum RUFY1 was significantly associated with positive lymph node metastases, advanced disease stage and distant metastases. Our survival analyses indicated that GC patients with high RUFY1 levels in tissues or serum had a poorer 5‐year OS compared with patients with low RUFY1. Similar to the role of PODXL, both tissue and serum RUFY1 proved to be independent prognostic factors for GC survival. These results indicated that RUFY1 promoted disease progression and might serve as a prognostic biomarker of GC.
To further prove our previous speculation that PODXL mediated GC progression via a RUFY1‐dependent mechanism, the co‐IP and western blot analyses confirmed the presence of PODXL/RUFY1 complexes in SGC‐7901 cells. This suggested that RUFY1 might serve as an important and unidirectional target of PODXL. To further confirm our hypothesis, we silenced RUFY1 expression in parental SGC‐7901 cells and PODXL stably expressing cells. Our experiments in vitro demonstrated that RUFY1 knockdown exerted a suppressing effect on GC cells and could attenuate PODXL‐induced biological behaviors such as cell proliferation, colony formation, apoptosis, wound healing, migration and invasion. Furthermore, silencing RUFY1 inactivated the PI3K/AKT, NF‐κB and MAPK/ERK signaling pathways. Our experiments in vivo provided compelling evidence that RUFY1 knockdown effectively attenuated PODXL‐induced tumorigenesis. This was new evidence that RUFY1 might serve as a downstream target of PODXL and mediate PODXL‐related signaling pathways in GC.
In conclusion, we presented evidence for a major role of PODXL and RUFY1 as tumor‐promoting genes during gastric carcinogenesis. The levels of PODXL and RUFY1 might serve as novel and potential prognostic biomarkers. More importantly, we confirmed the presence of PODXL/RUFY1 complexes in GC cells. PODXL promoted GC progression via a RUFY1‐dependent signaling mechanism. Our results suggested new therapeutic opportunities for GC that focuses on PODXL. Targeting the PODXL/RUFY1 complex might improve therapy.
ACKNOWLEDGMENTS
This study was supported by grants from the Special Subject of Diagnosis Treatment of Key Clinical Diseases of Suzhou City Sci‐tech Bureau (LCZX201401), the Project of Invigorating Health Care through Science, Technology and Education, Jiangsu Provincial Medical Youth Talent (QNRC2016723, QNRC2016733), the National Natural Science Foundation of China (81871952), and the Natural Science Research Foundation of Colleges and Universities in Jiangsu Province (18KJB320015).
CONFLICT OF INTEREST
The authors indicate no conflict of interest.
Supporting information
Zhi Q, Chen H, Liu F, et al. Podocalyxin‐like protein promotes gastric cancer progression through interacting with RUN and FYVE domain containing 1 protein. Cancer Sci. 2019;110:118–134. 10.1111/cas.13864
Contributor Information
Yuting Kuang, Email: sdyt_kuang@163.com.
Jin Zhou, Email: 15250278285@163.com.
REFERENCES
- 1. Richman DM, Tirumani SH, Hornick JL, et al. Beyond gastric adenocarcinoma: multimodality assessment of common and uncommon gastric neoplasms. Abdom Radiol. 2017;42:124‐140. [DOI] [PMC free article] [PubMed] [Google Scholar]
- 2. Ferlay J, Soerjomataram I, Dikshit R, et al. Cancer incidence and mortality worldwide: sources, methods and major patterns in GLOBOCAN 2012. Int J Cancer. 2015;136:9. [DOI] [PubMed] [Google Scholar]
- 3. Shimizu D, Kanda M, Kodera Y. Review of recent molecular landscape knowledge of gastric cancer. Histol Histopathol. 2017;27:11‐898. [DOI] [PubMed] [Google Scholar]
- 4. Liu X, Meltzer SJ. Gastric cancer in the era of precision medicine. Cell Mol Gastroenterol Hepatol. 2017;3:348‐358. [DOI] [PMC free article] [PubMed] [Google Scholar]
- 5. Sassetti C, Tangemann K, Singer MS, Kershaw DB, Rosen SD. Identification of podocalyxin‐like protein as a high endothelial venule ligand for L‐selectin: parallels to CD34. J Exp Med. 1998;187:1965‐1975. [DOI] [PMC free article] [PubMed] [Google Scholar]
- 6. Kerjaschki D, Sharkey DJ, Farquhar MG. Identification and characterization of podocalyxin–the major sialoprotein of the renal glomerular epithelial cell. J Cell Biol. 1984;98:1591‐1596. [DOI] [PMC free article] [PubMed] [Google Scholar]
- 7. Chan JY, Watt SM. Adhesion receptors on haematopoietic progenitor cells. Br J Haematol. 2001;112:541‐557. [DOI] [PubMed] [Google Scholar]
- 8. Horvat R, Hovorka A, Dekan G, Poczewski H, Kerjaschki D. Endothelial cell membranes contain podocalyxin–the major sialoprotein of visceral glomerular epithelial cells. J Cell Biol. 1986;102:484‐491. [DOI] [PMC free article] [PubMed] [Google Scholar]
- 9. Vitureira N, Andres R, Perez‐Martinez E, et al. Podocalyxin is a novel polysialylated neural adhesion protein with multiple roles in neural development and synapse formation. PLoS ONE. 2010;5:0012003. [DOI] [PMC free article] [PubMed] [Google Scholar]
- 10. Nielsen JS, McNagny KM. The role of podocalyxin in health and disease. J Am Soc Nephrol. 2009;20:1669‐1676. [DOI] [PubMed] [Google Scholar]
- 11. Takeda T, Go WY, Orlando RA, Farquhar MG. Expression of podocalyxin inhibits cell‐cell adhesion and modifies junctional properties in Madin‐Darby canine kidney cells. Mol Biol Cell. 2000;11:3219‐3232. [DOI] [PMC free article] [PubMed] [Google Scholar]
- 12. Takeda T, McQuistan T, Orlando RA, Farquhar MG. Loss of glomerular foot processes is associated with uncoupling of podocalyxin from the actin cytoskeleton. J Clin Invest. 2001;108:289‐301. [DOI] [PMC free article] [PubMed] [Google Scholar]
- 13. Sizemore S, Cicek M, Sizemore N, Ng KP, Casey G. Podocalyxin increases the aggressive phenotype of breast and prostate cancer cells in vitro through its interaction with ezrin. Can Res. 2007;67:6183‐6191. [DOI] [PubMed] [Google Scholar]
- 14. Hsu YH, Lin WL, Hou YT, et al. Podocalyxin EBP50 ezrin molecular complex enhances the metastatic potential of renal cell carcinoma through recruiting Rac1 guanine nucleotide exchange factor ARHGEF7. Am J Pathol. 2010;176:3050‐3061. [DOI] [PMC free article] [PubMed] [Google Scholar]
- 15. Casey G, Neville PJ, Liu X, et al. Podocalyxin variants and risk of prostate cancer and tumor aggressiveness. Hum Mol Genet. 2006;15:735‐741. [DOI] [PubMed] [Google Scholar]
- 16. Boman K, Larsson AH, Segersten U, et al. Membranous expression of podocalyxin‐like protein is an independent factor of poor prognosis in urothelial bladder cancer. Br J Cancer. 2013;108:2321‐2328. [DOI] [PMC free article] [PubMed] [Google Scholar]
- 17. Larsson A, Fridberg M, Gaber A, et al. Validation of podocalyxin‐like protein as a biomarker of poor prognosis in colorectal cancer. BMC Cancer. 2012;12:1471‐2407. [DOI] [PMC free article] [PubMed] [Google Scholar]
- 18. Binder ZA, Siu IM, Eberhart CG, et al. Podocalyxin‐like protein is expressed in glioblastoma multiforme stem‐like cells and is associated with poor outcome. PLoS ONE. 2013;8:e75945 [DOI] [PMC free article] [PubMed] [Google Scholar]
- 19. Taniuchi K, Furihata M, Naganuma S, Dabanaka K, Hanazaki K, Saibara T. Podocalyxin‐like protein, linked to poor prognosis of pancreatic cancers, promotes cell invasion by binding to gelsolin. Cancer Sci. 2016;107:1430‐1442. [DOI] [PMC free article] [PubMed] [Google Scholar]
- 20. Kusumoto H, Shintani Y, Kanzaki R, et al. Podocalyxin influences malignant potential by controlling epithelial‐mesenchymal transition in lung adenocarcinoma. Cancer Sci. 2017;108:528‐535. [DOI] [PMC free article] [PubMed] [Google Scholar]
- 21. Forse CL, Yilmaz YE, Pinnaduwage D, et al. Elevated expression of podocalyxin is associated with lymphatic invasion, basal‐like phenotype, and clinical outcome in axillary lymph node‐negative breast cancer. Breast Cancer Res Treat. 2013;137:709‐719. [DOI] [PubMed] [Google Scholar]
- 22. Laitinen A, Bockelman C, Hagstrom J, et al. Podocalyxin as a prognostic marker in gastric cancer. PLoS ONE. 2015;10:e0145079. [DOI] [PMC free article] [PubMed] [Google Scholar]
- 23. Borg D, Hedner C, Nodin B, et al. Expression of podocalyxin‐like protein is an independent prognostic biomarker in resected esophageal and gastric adenocarcinoma. BMC Clin Pathol. 2016;16:13. [DOI] [PMC free article] [PubMed] [Google Scholar]
- 24. Zhang J, Zhu Z, Sheng J, et al. miR‐509‐3‐5P inhibits the invasion and lymphatic metastasis by targeting PODXL and serves as a novel prognostic indicator for gastric cancer. Oncotarget. 2017;3:16802. [DOI] [PMC free article] [PubMed] [Google Scholar]
- 25. Cormont M, Mari M, Galmiche A, Hofman P, Le Marchand‐Brustel Y. A FYVE‐finger‐containing protein, Rabip4, is a Rab4 effector involved in early endosomal traffic. Proc Natl Acad Sci USA. 2001;98:1637‐1642. [DOI] [PMC free article] [PubMed] [Google Scholar]
- 26. Mari M, Macia E, Le Marchand‐Brustel Y, Cormont M. Role of the FYVE finger and the RUN domain for the subcellular localization of Rabip4. J Biol Chem. 2001;276:42501‐42508. [DOI] [PubMed] [Google Scholar]
- 27. Yang J, Kim O, Wu J, Qiu Y. Interaction between tyrosine kinase Etk and a RUN domain‐ and FYVE domain‐containing protein RUFY1. A possible role of ETK in regulation of vesicle trafficking. J Biol Chem. 2002;277:30219‐30226. [DOI] [PubMed] [Google Scholar]
- 28. Vukmirica J, Monzo P, Le Marchand‐Brustel Y, Cormont M. The Rab4A effector protein Rabip4 is involved in migration of NIH 3T3 fibroblasts. J Biol Chem. 2006;281:36360‐36368. [DOI] [PubMed] [Google Scholar]
- 29. Yamamoto H, Koga H, Katoh Y, Takahashi S, Nakayama K, Shin HW. Functional cross‐talk between Rab14 and Rab4 through a dual effector, RUFY1/Rabip4. Mol Biol Cell. 2010;21:2746‐2755. [DOI] [PMC free article] [PubMed] [Google Scholar]
- 30. Ivan V, Martinez‐Sanchez E, Sima LE, et al. AP‐3 and Rabip4' coordinately regulate spatial distribution of lysosomes. PLoS ONE. 2012;7:29. [DOI] [PMC free article] [PubMed] [Google Scholar]
- 31. Schopperle WM, Kershaw DB, DeWolf WC. Human embryonal carcinoma tumor antigen, Gp200/GCTM‐2, is podocalyxin. Biochem Biophys Res Comm. 2003;300:285‐290. [DOI] [PubMed] [Google Scholar]
- 32. Wang J, Zhao Y, Qi R, et al. Prognostic role of podocalyxin‐like protein expression in various cancers: a systematic review and meta‐analysis. Oncotarget. 2016;25:14199. [DOI] [PMC free article] [PubMed] [Google Scholar]
- 33. Cheung HH, Davis AJ, Lee TL, et al. Methylation of an intronic region regulates miR‐199a in testicular tumor malignancy. Oncogene. 2011;30:3404‐3415. [DOI] [PMC free article] [PubMed] [Google Scholar]
- 34. Favreau AJ, McGlauflin RE, Duarte CW, Sathyanarayana P. miR‐199b, a novel tumor suppressor miRNA in acute myeloid leukemia with prognostic implications. Exp Hematol Oncol. 2016;5:016‐0033. [DOI] [PMC free article] [PubMed] [Google Scholar]
- 35. Huang TC, Renuse S, Pinto S, et al. Identification of miR‐145 targets through an integrated omics analysis. Mol BioSyst. 2015;11:197‐207. [DOI] [PMC free article] [PubMed] [Google Scholar]
- 36. Chijiiwa Y, Moriyama T, Ohuchida K, et al. Overexpression of microRNA‐5100 decreases the aggressive phenotype of pancreatic cancer cells by targeting PODXL. Int J Oncol. 2016;48:1688‐1700. [DOI] [PubMed] [Google Scholar]
- 37. Khanna P, Chua PJ, Bay BH, Baeg GH. The JAK/STAT signaling cascade in gastric carcinoma (Review). Int J Oncol. 2015;47:1617‐1626. [DOI] [PubMed] [Google Scholar]
- 38. Ye B, Jiang LL, Xu HT, Zhou DW, Li ZS. Expression of PI3K/AKT pathway in gastric cancer and its blockade suppresses tumor growth and metastasis. Int J Immunopathol Pharmacol. 2012;25:627‐636. [DOI] [PubMed] [Google Scholar]
- 39. Xie X, Tang B, Zhou J, Gao Q, Zhang P. Inhibition of the PI3K/Akt pathway increases the chemosensitivity of gastric cancer to vincristine. Oncol Rep. 2013;30:773‐782. [DOI] [PubMed] [Google Scholar]
- 40. Li ZM, Pu YW, Zhu BS. Blockade of NF‐kappaB nuclear translocation results in the inhibition of the invasiveness of human gastric cancer cells. Oncol Lett. 2013;6:432‐436. [DOI] [PMC free article] [PubMed] [Google Scholar]
- 41. Jia S, Lu J, Qu T, et al. MAGI1 inhibits migration and invasion via blocking MAPK/ERK signaling pathway in gastric cancer. Chin J Cancer Res. 2017;29:25‐35. [DOI] [PMC free article] [PubMed] [Google Scholar]
- 42. Wu Y, Chen Y, Qu R, Lan T, Sang J. Type II cGMP‐dependent protein kinase inhibits EGF‐triggered signal transduction of the MAPK/ERK‐mediated pathway in gastric cancer cells. Oncol Rep. 2012;27:553‐558. [DOI] [PubMed] [Google Scholar]
Associated Data
This section collects any data citations, data availability statements, or supplementary materials included in this article.
Supplementary Materials


