Abstract
Colorectal cancer (CRC) is the third most common malignancy in the world, and long noncoding RNA (lncRNA) plays a critical role in carcinogenesis. Here, we report a novel lncRNA, MAPKAPK5‐AS1, that acts as a critical oncogene in CRC. In addition, we attempted to explore the functions of MAPKAPK5‐AS1 on tumor progression in vitro and in vivo. Quantitative RT‐PCR was used to examine the expression of MAPKAPK5‐AS1 in CRC tissues and cells. Expression of MAPKAPK5‐AS1 was significantly upregulated in 50 CRC tissues, and increased expression of MAPKAPK5‐AS1 was found to be associated with greater tumor size and advanced pathological stage in CRC patients. Knockdown of MAPKAPK5‐AS1 significantly inhibited proliferation and caused apoptosis in CRC cells. We also found that p21 is a target of MAPKAPK5‐AS1. In addition, we are the first to report that MAPKAPK5‐AS1 plays a carcinogenic role in CRC. MAPKAPK5‐AS1 is a novel prognostic biomarker and a potential therapeutic candidate for CRC cancer.
Keywords: apoptosis, colorectal cancer, lncRNA, MAPKAPK5‐AS1, proliferation
1. INTRODUCTION
Colorectal cancer (CRC) is one of the most common malignancies; approximately 1.4 million patients are diagnosed with CRC each year worldwide.1 According to the latest cancer statistics, in the USA and Europe, new cases of CRC and death both ranked third.2 The incidence of CRC in China is second only to esophageal cancer and gastric cancer, and the incidence and mortality are increasing year by year.3, 4 Apart from familial genetic factors, the occurrence of CRC is also related to bad eating habits, obesity, smoking, and other factors, but the exact pathogenesis is still unclear.5 Therefore, further study of the molecular mechanisms of CRC is essential to ease the burden of the disease.
Only approximately 1.5% of genes in the human genome can encode proteins, and most genes are transcribed into noncoding RNAs (ncRNA).6 Noncoding RNAs can be divided into short ncRNAs and long ncRNAs (lncRNA) according to their length (less than or greater than 200 nt). Long ncRNA is the most common and most versatile class.7 Long ncRNA lacks a significant ORF and is widely present in the nucleus and cytoplasm.8, 9 It does not participate in protein coding.10 Recent studies have shown that lncRNA plays a critical role in carcinogenesis. For example, upregulation of SNHG6 regulates ZEB1 expression by competitively binding microRNA‐101‐3p and interacting with UPF1 in hepatocellular carcinoma.11 Our previous studies also reported that lncRNA SPRY4‐IT1 increases the proliferation of human breast cancer cells by upregulating ZNF703 expression.12 However, the function of lncRNAs in human CRC remains largely unknown. In this study, we identified MAPKAPK5‐AS1, a novel lncRNA previously mentioned in published reports,13, 14 as being upregulated in CRC tissue and associated with tumorigenesis, larger tumor size, proliferation, and poor prognosis. In‐depth study of lncRNA MAPKAPK5‐AS1 not only enables us to further understand the pathogenesis of CRC, but also establish it as a new diagnostic marker and therapeutic target of CRC. To explore the role of lncRNA in the progression of CRC, we have previously analyzed the differential expression of lncRNAs in The Cancer Genome Atlas Home—The Cancer Genome Atlas—Cancer Genome—TCGA https://cancergenome.nih.gov/ and the Gene Expression Omnibus database MAPKAPK5‐AS1—GEO Profiles—NCBI https://www.ncbi.nlm.nih.gov/geoprofiles/?term=MAPKAPK5-AS1 (GSE24514). It was found that the expression of MAPKAPK5‐AS1 was obviously upregulated, and MAPKAPK5‐AS1 has not been reported in the literature yet. MAPKAPK5‐AS1 is located at human chromosome 12, and the transcript length is 935 bp.14 Further verification by quantitative RT‐PCR (qRT‐PCR) in 50 clinical samples showed that MAPKAPK5‐AS1 in CRC tissues was significantly upregulated. This indicates that MAPKAPK5‐AS1 might be involved in the process of colorectal carcinogenesis. With the recent development of epigenetics research, many lncRNAs have been found to regulate the expression of downstream target genes by binding RNA‐binding proteins. Enhancer of zeste homolog 2 (EZH2) is an apparent inhibitory histone that plays an important regulatory role. It inhibits the transcription of target genes by changing the level of automethylation. A large number of studies have shown that EZH2 is closely related to tumorigenesis and development. For example, lncRNA CRNDE inhibits the expression of downstream target gene DUSP5/CDKN1A by binding EZH2 and promotes the proliferation of CRC cells.15 In addition, Linc00460 regulates proliferation of CRC cells by recruiting EZH2 and AGO2 to regulate the downstream target gene KLF2/CUL4A.16 Therefore, it is necessary to further explore the causes of abnormal expression, to provide a theoretical basis and research direction for the early diagnosis and early treatment of CRC.
2. MATERIALS AND METHODS
2.1. Clinical specimens
From January 2015 to December 2018, 50 pairs of matched tumor tissues and corresponding normal tissues were collected from CRC patients undergoing surgical treatment in the Second Affiliated Hospital of Nanjing Medical University (Nanjing, China). None of the patients received any local or systemic treatment before surgery. The pathological stage, grade, and nodal status were appraised by an experienced pathologist. All experiments were approved by the research ethics committee of Nanjing Medical University. Written informed consent was obtained from all patients.
2.2. Cell culture
The CRC cell lines HCT116, SW480, HT‐29, and DLD‐1, and the normal epithelium of the intestinal mucosa HCoEpiC were purchased from the Cell Culture Bank of the Chinese Academy of Sciences (shanghai, China). Colorectal cancer cells HCT116, HT‐29, SW480, and DLD‐1 were culture in DMEM containing 10% FBS; normal CRC epithelial cells HCoEpic were cultured in RPMI‐1640 medium containing 10% FBS in an incubator at 37°C, with 5% CO2 and relative humidity of 90%. Medium was replaced every 2‐3 days.
2.3. RNA isolation and qPCR assays
Total RNA was extracted from tissues or cultured cells using TRIzol reagent (Invitrogen, Carlsbad, CA, USA) according to the manufacturer's protocol. RNA quantity and quality were determined by NanoDrop2000c (Thermo Fisher Scientific, Waltham, MA, USA). For qRT‐PCR, 1 μg RNA was reverse transcribed into cDNA using a reverse transcription kit (Takara, Dalian, China). Quantitative PCR assays were carried out on an ABI 7500 (Carlsbad, CA, USA). Data were normalized to GAPDH. The primer sequences were: MAPKAPK5‐AS1, forward AAGCCCGAGTCTGATGCTAA, and reverse CTGCACACCTCTTCTGGTCA; p21, forward GAGACTCTCAGGGTCGAAAACG, and reverse GGATTAGGGCTTCCTCTTGGA; GAPDH, forward AGCCACATCGCTCAGACAC, and reverse GCCCAATACGACCAAATCC; and U6 forward ATTGGAACGATACAGAGAAGATT, and reverse GGAACGCTTCACGAATTTG. The ChIP‐qPCR primers for p21 were: forward, CTGCCTCTGCTCAATAATGTTCT; and reverse, GGAATTCACCTTCACACAGGC. Each sample was analyzed in triplicate.
2.4. Cell transfection
Two individual MAPKAPK5‐AS1 (MAPKAPK5‐AS1 2# and 3#), si‐EZH2, and scrambled negative control (NC) siRNAs were purchased from Invitrogen and transfected into cells using Lipofectamine 2000 (Invitrogen). Plasmid vectors (sh‐MAPKAPK5‐AS1 and empty vector) for transfection were extracted by a DNA Midiprep kit (Qiagen, Hilden, Germany) and transfected into cells using FuGENE (Roche, Basel, Switzerland). The full‐length cDNA of MAPKAPK5‐AS1 was synthesized by Realgene (Nanjing, China) and subcloned into the pcDNA3.1 (+) vector (Invitrogen) according to the manufacturer's instructions. Cells were harvested after 48 hours for qRT‐PCR and western blot analyses. The sequences of the siRNAs/shRNAs were: si‐MAPKAPK5‐AS1 2#, GGUGACUUGGGACUUGGAUGCUUAA; si‐MAPKAPK5‐AS1 3#, GCGGAGAUCCACUCUUUCAUAUUUA; sh‐MAPKAPK5‐AS1 2#, GTCTTCGGTGACTTGGGACTTGGATGCTTAATTCAAGAGATTAAGCATCCAAGTCCCAAGTCACC TTTTTTGGATCC; sh‐MAPKAPK5‐AS1 3#, GTCTTCGCGGAGATCCACTCTTTCATATTTATTCAAGAGATAAATATGAAAGAGTGGATCTCCGC TTTTTTGGATCC; si‐EZH2, GAGGUUCAGACGAGCUGAUUU; si‐p21, ACAAGGGUACAAGACAGUGAC; and sh‐p21, GGATCCACAAGGGUACAAGACAGUGACCAAGAGAGACGCTCCATCGTGGATGTGCTGTTTTTTGAAGCTT.
2.5. Cell proliferation assays
A cell proliferation assay was carried out with a CCK‐8 assay kit (Promega, Madison, WI, USA). Twenty‐four hours after transfection with si‐MAPKAPK5‐AS1, the SW480 and DLD‐1 cells (3000 cells/well) were grown in 96‐well plates and cultured at 37°C and 5% CO2 atmosphere. The CCK‐8 assay was used to detect the relative cell growth every 24 hours according to the instructions of the manufacturer. Simply, 20 μL CCK‐8 solution was added to each well, and each well was measured spectrophotometrically at 450 nm after 2 hours of incubation. Each sample was analyzed in triplicate.
2.6. Flow cytometric analysis
Double staining of FITC‐annexin V and propidium iodide was carried out using the FITC Annexin V Apoptosis Detection Kit (BD Biosciences, Franklin Lakes, NJ, USA) according to the manufacturer's recommendations. Cells were analyzed using a flow cytometer (FACScan; BD Biosciences) equipped with CellQuest software (BD Biosciences). Cells were divided into viable cells, dead cells, early apoptotic cells, and apoptotic cells, and the relative proportions of early apoptosis were compared to control transfections from each experiment. Cells for cell cycle analysis were stained with proponium chloride using the Cycletest Plus DNA kit (BD Biosciences) and analyzed by FACScan. The percentage of G0‐G1, S and G2‐M phase cells was calculated and compared. Each sample was analyzed in triplicate.
2.7. 5‐Ethynyl‐2′‐deoxyuridine (EdU) analysis
Proliferating cells were evaluated using an EdU labelling/detection kit (Ribobio, Guangzhou, China) according to the manufacturer's protocol. Briefly, SW480 and DLD‐I cells were cultured in 96‐well plates at 5 × 10³ cells per well and transfected with plasmid DNA or siRNA for 48 hours. Then 50 μmol/L EdU‐labeled medium was added to the cell culture and incubated at 37°C, 5% CO2, for 2 hours. The cultured cells were fixed with 4% paraformaldehyde (pH 7.4) for 30 minutes and treated with 0.5% Triton X‐100 for 20 minutes at room temperature. After washing with PBS, samples were stained with anti‐EdU working solution for 30 minutes at room temperature. Subsequently, the cells were incubated with 100 μL Hoechst 33342 (5 μg/mL) for 30 minutes at room temperature and then observed under a fluorescence microscope. Each sample was analyzed in triplicate.
2.8. Cell apoptosis assay
Terminal deoxynucleotidyl transferase‐mediated dUTP nick‐end labeling was carried out with an apoptosis detection kit (Ribobio) according to the manufacturer's instructions. A randomly selected field without significant necrosis in 10 high‐power fields was assessed for TUNEL‐positive cells. The index of TUNEL was calculated based on the number of total nuclei and cells with green nuclei. Each sample was analyzed in triplicate.
2.9. Subcellular fractionation location
The separation of nuclear and cytosolic fractions was undertaken using the PARIS Kit (Life Technologies, Carlsbad, CA, USA) according to the manufacturer's instructions. Each sample was analyzed in triplicate.
2.10. Fluorescence in situ hybridization
SW480 cells were seeded in 24‐well plates, fixed in 4% formaldehyde for 10 minutes, treated with PBS containing 0.5% Triton X‐100, then washed 3 times with PBS. The prehybrid solution was added, then the probe‐containing hybridization solution was added overnight. After washing with 4×, 2×, and 1× SSC, cells were stained with DAPI. The RNA FISH probe was designed and synthesized by Ribobio.
2.11. RNA immunoprecipitation (RIP)
We followed the manufacturer's protocol using the EZMagna RIP kit (Millipore, Billerica, MA, USA). SW480 and DLD‐1 cells were lysed in complete RIP lysis buffer, and the extracts were incubated with magnetic beads conjugated with Abs recognizing EZH2 or control IgG (microwells) for 6 hours at 4°C. The beads are then washed and incubated with proteinase K to remove proteins. Finally, qPCR analysis of the purified RNA was carried out using specific primers to indicate binding of MAPKAPK5‐AS1 and EZH2. Antibody for RIP assays of EZH2, AGO2, or control IgG was from Millipore. Each sample was analyzed in triplicate.
2.12. Chromatin immunoprecipitation
SW480 cells were treated with formaldehyde and incubated for 10 minutes to generate DNA‐protein cross‐links. Cell lysates were then sonicated to generate chromatin fragments of 200‐300 bp and immunoprecipitated with H3K27me3, EZH2 and IgG as control. Precipitated chromatin DNA was recovered. Antibody for ChIP assays of EZH2, H3K27me3, or control IgG was from Abcam (Hong Kong, China). The experiment was repeated three times by qPCR.
2.13. Western blot assay
SW480 cells were harvested, and proteins were extracted from the transfected cells and quantified using a 12% polyacrylamide gradient SDS gel as previously described. Quantification was undertaken using a density assay (Quantity One software; Bio‐Rad, Hercules, CA, USA) using ECL chromogenic substrate. A GAPDH Ab (#2118; Cell Signaling Technology, Boston, MA, USA) was used as a control. Anti‐p21 was purchased from Abcam.
2.14. Nude mouse tumor formation experiment
To determine whether the level of MAPKAPK5‐AS1 expression could affect CRC tumorigenesis in vivo, sh‐MAPKAPK5‐AS1 2#, or negative control‐transfected DLD‐1 cells were s.c. injected into male nude mice. Subcutaneous tumors are observed every 3 days. After the appearance of tumors, the tumor size of the mice in different groups was measured and recorded once every 2 days. After 16 days of tumor formation, the mice were killed. The tumors were removed, photographed, weighed, and measured. All the animal experiments in this study were undertaken in strict accordance with the guidelines and regulations for the Care and Use of Laboratory Animals, Nanjing Medical University.
2.15. Immunohistochemistry (IHC)
Xenograft tumor tissue samples were immunostained with H&E and Ki67. Anti‐Ki67 was from Santa Cruz Biotechnology (Dallas, TX, USA). The IHC staining results were independently scored by the author and a pathologist to minimize subjectivity and then compared, and the final comprehensive results were obtained.
2.16. Statistical analysis
Statistical analysis was carried out using SPSS software (SPSS, Chicago, IL, USA). The χ2 precision tests were used to analyze clinical pathology data. To compare MAPKAPK5‐AS1 expression in CRC tissue and matched normal tissue, a paired t test was used. To compare 2 samples, an unpaired two‐tailed t test was used. A P value <0.05 was considered statistically significant. The results are expressed as mean ± SD. Statistical significance was assigned at *P < .05 or **P < .01. All experiments were carried out at least 3 times, in triplicate samples.
3. RESULTS
3.1. MAPKAPK5‐AS1 is upregulated in human CRC tissues and is positively correlated with larger tumor size, advanced TNM stage, and lymph node metastasis
In order to determine whether lncRNAs play an important role in CRC, we compared case‐control microarray data of paired CRCs in The Cancer Genome Atlas CRC database and the Gene Expression Omnibus database (GSE24514). We carried out a differential expression analysis and found that MAPKAPK5‐AS1, an lncRNA with a high differential expression, had not been reported. To further verify the results of the data analysis, we detected the expression of MAPKAPK5‐AS1 in 50 cases of tumor tissue and adjacent tissues by qRT‐PCR (Figure 1A). The results showed that the expression of MAPKAPK5‐AS1 in tumor tissues was significantly higher than adjacent tissues. Further analysis of clinical data revealed a correlation between the expression level of MAPKAPK5‐AS1 and the clinicopathological features of patients with colorectal cancer. High expression of MAPKAPK5‐AS1 in CRC tissues was closely related to higher pathological stage (P = .007; Figure 1B), larger tumor (P = .004; Figure 1C), and positive lymph node status (P = .001; Figure 1D). Kaplan‐Meier survival analysis and log‐rank tests show survival time for cases with high MAPKAPK5‐AS1 expression was below those with low MAPKAPK5‐AS1 expression (Figure 1E). However, several other clinical parameters were found not to be significantly associated with MAPKAPK5‐AS1 expression (Table 1). Therefore, we speculate that the expression of MAPKAPK5‐AS1 could be related to CRC.
Figure 1.
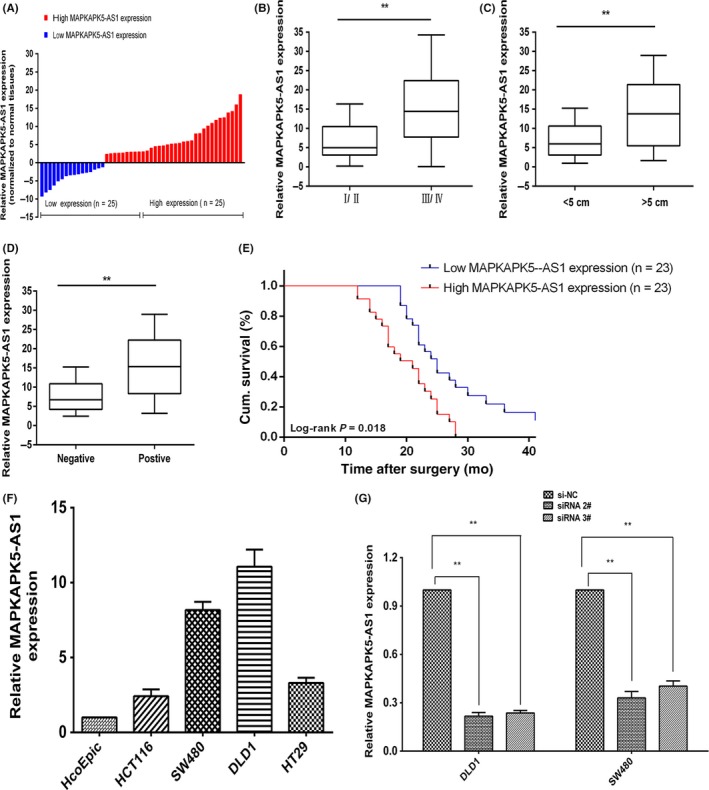
MAPKAPK5‐AS1 is upregulated in human colorectal cancer (CRC) tissues and is significantly correlated with larger tumor size, advanced TNM stage, lymph node metastasis, and poor prognosis. A, Relative expression of MAPKAPK5‐AS1 in CRC tissues (n = 50) compared with the corresponding non‐tumor tissues (n = 50); the patients were classified into two groups according to the median level of MAPKAPK5‐AS1. MAPKAPK5‐AS1 expression was examined by quantitative RT‐PCR (qRT‐PCR) and normalized to GAPDH expression. B‐D, MAPKAPK5‐AS1 expression was significantly higher in patients with larger tumor size, higher pathological stage, and lymph node metastasis. E, Kaplan‐Meier overall survival curves according to MAPKAPK5‐AS1 expression level. Cum., cumulative. F, MAPKAPK5‐AS1 expression was assessed by qRT‐PCR analysis in CRC cells (DLD‐1, HCT116, HT29, and SW480) and the normal human colonic epithelial cell line (HCoEpiC). G, Quantitative PCR analysis of MAPKAPK5‐AS1 expression levels following transfection of DLD‐1 and SW480 cells with siRNAs against MAPKAPK5‐AS1. Representative images and data based on 3 independent experiments. Bars: ± SD. **P < .01. siNC, negative control
Table 1.
Relationships between MAPKAPK5‐AS1 expression and clinicopathological characteristics of colorectal cancer patients
| Characteristics | MAPKAPK5‐AS1 | chi‐squared test P ‐value | |
|---|---|---|---|
| Low expression (n = 25) | High expression (n = 25) | ||
| Age (y) | |||
| ≤60 | 12 | 10 | .56700 |
| >60 | 13 | 15 | |
| Gender | |||
| Male | 11 | 15 | .25800 |
| Female | 14 | 10 | |
| Tumor size | |||
| ≤5 cm | 17 | 4 | .00020b |
| >5 cm | 8 | 21 | |
| Histological differentiation | |||
| Middle or high | 19 | 7 | .00068b |
| low or undiffer | 6 | 18 | |
| TNM stage | |||
| I, II | 17 | 7 | .00460b |
| III, IV | 8 | 18 | |
| Lymph node metastasis | |||
| Positive | 9 | 15 | .02450a |
| Negative | 16 | 8 | |
P < .05.
P < .01.
3.2. MAPKAPK5‐AS1 promotes CRC cell proliferation in vitro and downregulation of MAPKAPK5‐AS1 promotes G0/G1 arrest
To investigate the biological function of MAPKAPK5‐AS1 in colorectal cancer, we first detected the expression level of MAPKAPK5‐AS1 in 4 CRC cell lines and normal colon epithelium cell line (HCoEpiC). Quantitative RT‐PCR results showed that MAPKAPK5‐AS1 was significantly upregulated in SW480 (P < .01) and DLD‐1 (P < .01) cells compared to normal colon epithelium cells (Figure 1F). Next, the siRNAs of MAPKAPK5‐AS1 and its blank control si‐NC were transfected into CRC cells. The results showed that the expression of 2# and 3# siRNAs of MAPKAPK5‐AS1 was significantly reduced, but the 1# interference sequence showed poor transfection efficiency (Figure 1G). Subsequent experiments knocked down MAPKAPK5‐AS1 with 2# and 3# interference sequences. The CCK‐8 and colony formation assay results showed knockdown of MAPKAPK5‐AS1 can significantly inhibit CRC cell proliferation (Figure 2A,B). To investigate whether MAPKAPK5‐AS1 promotes proliferation partly by inhibiting apoptosis, we used flow cytometry to detect apoptosis. The results showed that, compared with the control group, the apoptosis rate was significantly increased after knocking down MAPKAPK5‐AS1 (Figure 2C). To assess whether MAPKAPK5‐AS1 affects CRC cell proliferation through MAPKAPK5‐AS1‐mediated cell cycle changes, we examined cell cycle progression in CRC cells by flow cytometry. Results showed that MAPKAPK5‐AS1 knockdown increased the percentage of cells in G0/G1 phase and decreased the percentage of cells in S and G2/M phase compared with control cells (Figure 3A). These studies indicate that MAPKAPK5‐AS1 has an important effect on CRC cells by affecting the cell cycle. Cell proliferation ability, tested with EdU, also showed similar results. The results suggest that abnormally high expression of MAPKAPK5‐AS1 in CRC cells can promote cell proliferation (Figure 3B). The TUNEL assay for detecting apoptosis was also consistent with the above results (Figure 3C). These findings suggest that MAPKAPK5‐AS1 might be closely related to the proliferation of CRC cells.
Figure 2.
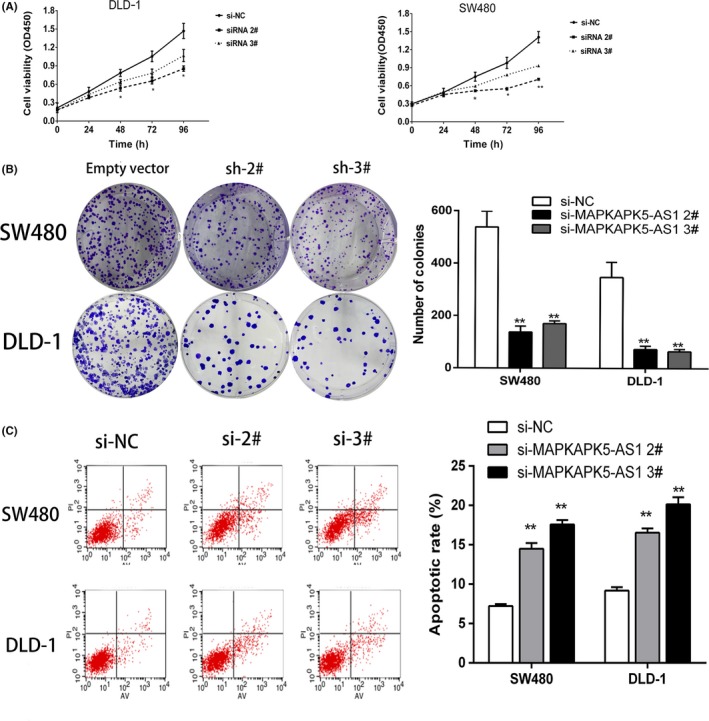
MAPKAPK5‐AS1 promotes colorectal cancer cell proliferation in vitro. A, CCK‐8 assays were used to determine the proliferation of DLD‐1 and SW480 cells following treatment with si‐MAPKAPK5‐AS1 2#, 3#, and the negative control (si‐NC). B, Results of the colony formation of DLD‐1 and SW480 cells transfected with MAPKAPK5‐AS1 siRNA. C, Flow cytometry assays were used to analyze cell apoptosis in siRNA‐transfected DLD‐1 and SW480 cells. Representative images and data based on 3 independent experiments. Bars: ± SD. *P < .05, **P < .01
Figure 3.
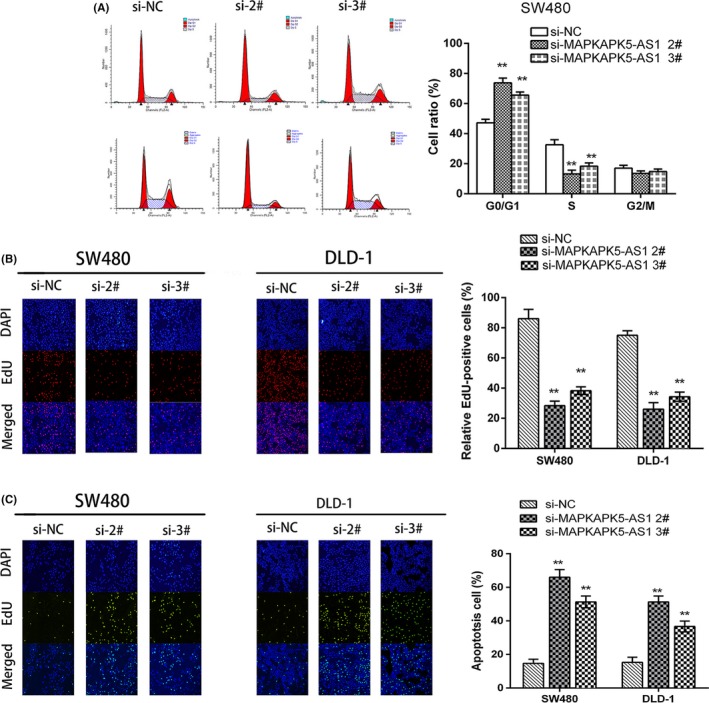
MAPKAPK5‐AS1 downregulation promotes cell cycle arrest and apoptosis in colorectal cancer cells in vitro. A, Bar chart represents the percentage of cells in G0/G1, S, or G2/M phase, as indicated. B, Proliferating DLD‐1 and SW480 cells were labelled with 5‐ethynyl‐2′‐deoxyuridine (EdU). The Clickit reaction revealed EdU staining (red). Cell nuclei were stained with DAPI (blue). C, Apoptosis assay verifies apoptosis. Representative images and data based on 3 independent experiments. Bars: ± SD. **P < .01. siNC, negative control
3.3. Knockdown of MAPKAPK5‐AS1 inhibits CRC tumorigenesis in vivo
The statistical results of tumor volume changes showed that the tumor formation ability of the mice in the MAPKAPK5‐AS1 knockdown group was significantly reduced and the growth rate was significantly slower compared to the control group (Figure 4A). As shown, qPCR confirmed that the MAPKAPK5‐AS1 expression was lower in tumor tissues derived from sh‐MAPKAPK5‐AS1‐transfected cells (Figure 4B), accurate measurement calculations prove that the knockdown of MAPKAPK5‐AS1 tumor volume is clearly smaller (Figure 4C) and the average weight of tumors in the MAPKAPK5‐AS1 knockdown group was lower than the control group (Figure 4D). Moreover, IHC analysis confirmed that the tumors formed from DLD‐1/sh‐MAPKAPK5‐AS1 cells displayed weaker Ki‐67 staining than those formed from control cells (Figure 4E). Our results indicate that silencing MAPKAPK5‐AS1 expression can inhibit tumor growth in CRC cells in vivo.
Figure 4.
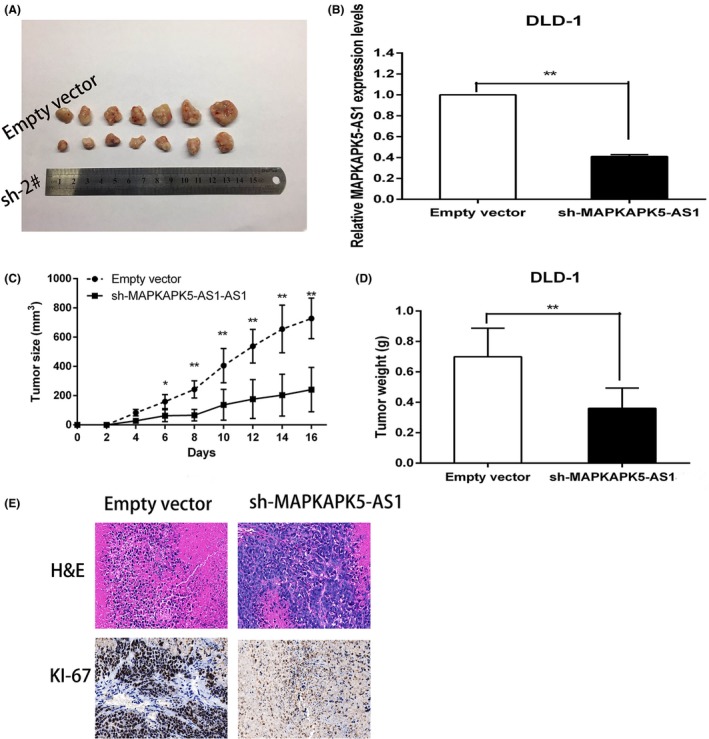
Silencing of MAPKAPK5‐AS1 inhibits colorectal cancer growth in vivo. A, Stable MAPKAPK5‐AS1 knockdown DLD‐1 cells were used for the in vivo study. Nude mice carrying tumors from respective groups are shown. B, Tumor volumes were calculated after injection every 2 days. C, qRT‐PCR experiments were performed to detect the average expression of MAPKAPK5‐AS1 in xenograft tumors. D, Tumor weights from 2 treatment groups are represented. E, Images of H&E staining and immunohistochemistry of the xenograft tumors. Representative Ki‐67 protein levels in xenograft tumors as evaluated by immunohistochemistry. Representative images and data based on 3 independent experiments. Bars: ± SD, *P < .05, **P < .01
3.4. MAPKAPK5‐AS1 overexpression induces promotion of CRC cell proliferation
To further explore the function of MAPKAPK5‐AS1, we carried out an overexpression experiment in HCT116 cells. Both CCK‐8 and EdU assays revealed that the viability of HCT116 cells transfected with pcDNA‐MAPKAPK5‐AS1 was significantly impaired compared with empty vector‐treated cells (Figure 5A‐C). The colony formation assays results showed that overexpression of MAPKAPK5‐AS1 in HCT116 cells significantly promoted cell colony formation (Figure 5D). These findings indicated that MAPKAPK5‐AS1 promoted CRC cell proliferation.
Figure 5.
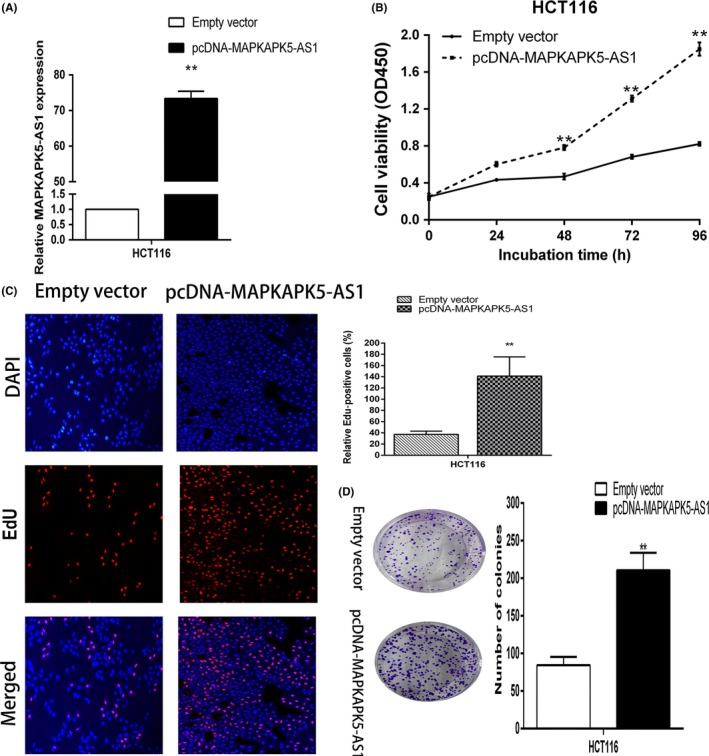
MAPKAPK5‐AS1 overexpression induces promotion of colorectal cancer cell proliferation. A, Level of MAPKAPK5‐AS1 in HCT116 cells transfected with pcDNA‐MAPKAPK5‐AS1 detected by quantitative PCR analysis. B‐D, MTT, 5‐ethynyl‐2′‐deoxyuridine (EdU) staining, and colon formation assays were used to determine cell viability. Representative images and data based on 3 independent experiments. Bars: ± SD, *P < .05, **P < .01
3.5. MAPKAPK5‐AS1 promotes CRC cell proliferation by partially binding histone EZH2 and subsequently inhibiting expression of target gene p21
To investigate the mechanism of MAPKAPK5‐AS1 in CRC, we first analyzed its distribution in CRC cells and found that MAPKAPK5‐AS1 is mainly located in the nucleus (Figure 6A,B), which means that MAPKAPK5‐AS1 might be involved in transcriptional regulation. We used qRT‐PCR to detect the 8 classical mRNA levels of proliferation‐related genes after knocking down MAPKAPK5‐AS1 (p15, p21, p27, p57, Bcl‐2, Bax, KLF‐2, and Trail; Figure 6C). The results showed that, compared with the control group, p21 mRNA levels were changed to varying degrees after knockdown of MAPKAPK5‐AS1 in SW480 and DLD‐1 cells (Figure 6D). p21, which was reported to be closely related to proliferation, was selected as a downstream target for further studies. We then predicted the possible binding proteins of MAPKAPK5‐AS1 and found that it could bind to histone modification enzymes. Given that approximately 20% of lncRNAs have been reported to exercise regulatory functions in the form of binding to polycomb repressive complex2 (PRC2) and it has been reported that lncRNA often forms a complex with AGO2 protein to silence the target. Based on this, we reasonably suspect that MAPKAPK5‐AS1 could associate with the PRC2 core subunit EZH2 and RNA‐induced silencing complex (RISC) core subunit AGO2 to regulate downstream target gene p21. The above prediction results were further verified by RIP experiments. The results showed that MAPKAPK5‐AS1 can bind to histone EZH2 rather than RISC AGO2 in SW480 and DLD‐1 cell lines. lncRNA DUXAP10 has been reported as not bound to EZH2,17 we chose it as a negative control (Figure 6E,F). Subsequently, in order to investigate whether MAPKAPK5‐AS1 is involved in histone EZH2 enrichment in p21 promoter region. The p21 promoter‐specific primers were designed for ChIP‐qPCR in SW480, DLD‐1, and HCT116 cells. The results showed that, compared with the control group, knockdown of MAPKAPK5‐AS1 significantly reduced the enrichment of EZH2 and H3K27me3 in the p21 promoter region; overexpression works just the opposite, suggesting that MAPKAPK5‐AS1 and EZH2 can be enriched in the p21 promoter region and inhibit transcription (Figure 6G,H). We then decreased EZH2 expression in DLD‐1 cells by transfection with si‐EZH2. The qRT‐PCR results suggested that the expression level of p21 increased following si‐EZH2 transfection (Figure 6I). Taken together, the experimental results indicate that MAPKAPK5‐AS1 promotes CRC cell proliferation by partly binding histone EZH2 and subsequently inhibiting the expression of the downstream target gene p21.
Figure 6.
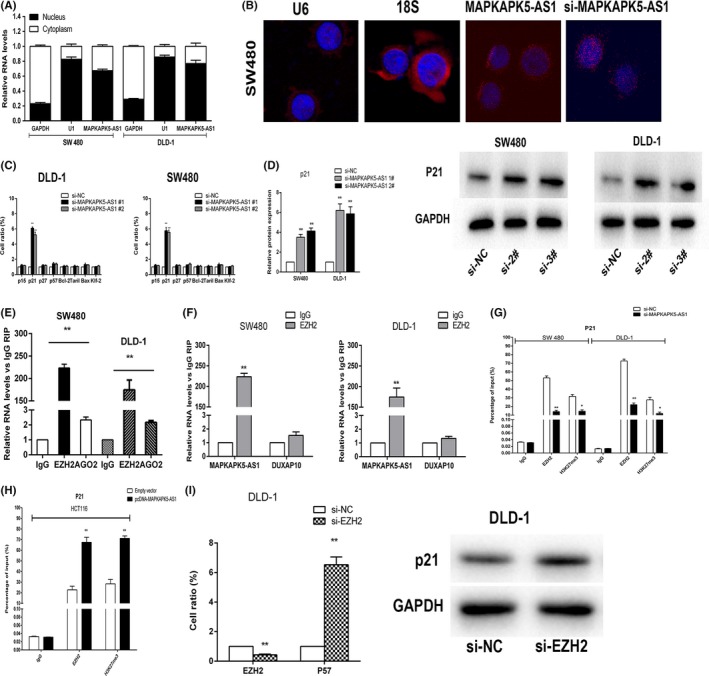
MAPKAPK5‐AS1 partly silences p21 transcription by binding to enhancer of zeste homolog 2 (EZH2). A, Expression levels of MAPKAPK5‐AS1 in cell nucleus and cytoplasm in DLD‐1 and SW480 cells investigated by quantitative RT‐PCR (qRT‐PCR). U6 was used as a nuclear marker, and GAPDH was used as a cytosol marker. B, FISH analysis of the location of MAPKAPK5‐AS1 (red) in the cytoplasm and nuclear fractions (blue) of SW480 cells. C, Eight classical mRNA expression levels D, Expression of p21 was determined after knockdown of MAPKAPK5‐AS1 by qRT‐PCR and western blot assays after transfection. E, RNA immunoprecipitation assays were carried out in DLD‐1 and SW480 cells, and the coprecipitated RNA was subjected to qRT‐PCR for MAPKAPK5‐AS1. F, DUXAP10 was used as negative control. G, ChIP‐qRT‐PCR of EZH2 occupancy and H3K27me3 binding in the p21 promoter in DLD‐1 and SW480 cells treated with si‐MAPKAPK5‐AS1 (48 hours) or the negative control (si‐NC); IgG as negative control. H, ChIP‐qRT‐PCR of EZH2 occupancy and H3K27me3 binding in the p21 promoter in HCT116 cells treated with pcDNA‐MAPKAPK5‐AS1; IgG as negative control. I, qRT‐PCR assays were used to determine the expression of EZH2 in DLD‐1 cells after EZH2 knockdown. p21 expression was investigated in DLD‐1 cells after knockdown of EZH2 through qRT‐PCR and western blot assays. Representative images and data based on 3 independent experiments. Bars: ± SD, *P < .05, **P < .01
3.6. p21 is potentially involved in the oncogenic function of MAPKAPK5‐AS1
To verify the effect of p21 in CRC cells, p21 was knocked down in DLD‐1 cells (Figure 7A,B). The CCK‐8 and colony formation assays showed a significant change of CRC cell viability after p21 changed (Figure 7C). Edu shows that si‐p21 transfects DLD‐1 cells (Figure 7D). These data indicate that inhibition of p21 promotes CRC cell proliferation. We also undertook colony formation assays to determine whether p21 is involved in MAPKAPK5‐AS1‐mediated CRC cell proliferation. DLD‐1 cells were cotransfected with MAPKAPK5‐AS1 and p21 shRNA. Colony formation assays showed that proliferation of DLD‐1 cells cotransfected with sh‐MAPKAPK5‐AS1 and sh‐p21 was increased compared to that in HUCCT1 cells treated with sh‐MAPKAPK5‐AS1 alone (Figure 7E). Collectively, these data indicate that MAPKAPK5‐AS1 partially promotes proliferation of CRC cells by p21 downregulation.
Figure 7.
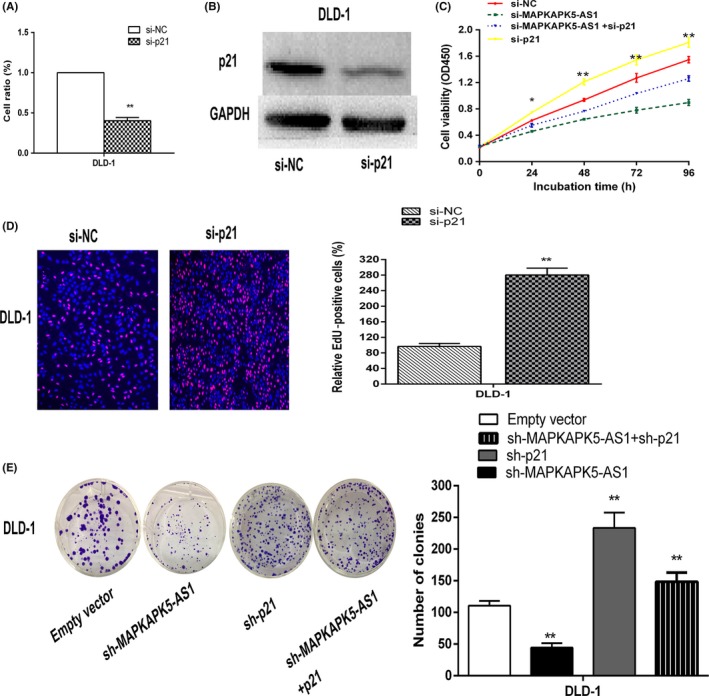
Knockdown of p21 promotes colorectal cancer cell proliferation. A,B, DLD‐1 cells were transfected with si‐p21, and p21 expression was analyzed by western blotting. C,D, CCK‐8 and 5‐ethynyl‐2′‐deoxyuridine (EdU) assays were used to determine the viability of si‐p21‐transfected DLD‐1 cells. E, Colony formation assays were used to determine the cell viability of sh‐MAPKAPK5‐AS1 and sh‐p21 cotransfected DLD‐1 cells. Bars: ± SD, *P < .05, **P < .01
4. DISCUSSION
In recent years, more and more tumor‐associated lncRNAs have been discovered.18 A large number of published works have reported that these lncRNAs play an important role in multiple tumors.19, 20, 21, 22, 23 Our previous research shows that lncRNA SNHG17 can promote the proliferation of CRC cells by inhibiting the expression of p57.24 The high expression of lncRNA LL22NC03‐N64E9.1 could predict poor prognosis in patients with colon cancer.25 Long ncRNA SH3PXD2A‐AS1 inhibits p21 expression by binding EZH2 to promote CRC cell proliferation.26 Therefore, the discovery of new CRC‐related lncRNAs is of great significance for further understanding the molecular mechanisms of CRC progression and providing clinical therapeutic targets. In this study, we analyzed 2 sources of high‐throughput microarray data of CRC and found lncRNA MAPKAPK5‐AS1. The expression of lncRNA MAPKAPK5‐AS1 in two CRC tissue microarrays was significantly upregulated and has not been previously reported. The above analysis results were further validated in 50 CRC tissues. Statistical analysis of clinical pathological data found that high expression of MAPKAPK5‐AS1 predicts poor prognosis in CRC patients.
Subsequently, we knocked down MAPKAPK5‐AS1 in 2 high‐expression CRC cell lines and overexpressed it in the low‐expression cells, through a series of in vitro and in vivo functional assays. MAPKAPK5‐AS1 was found to promote the proliferation of CRC cells and inhibit its apoptosis. In summary, MAPKAPK5‐AS1 plays an important role in the malignant phenotype of CRC.
Many lncRNAs can regulate the expression of downstream target genes by forming complexes with RNA‐binding proteins,27, 28, 29, 30 then acts as an oncogene or a suppressor oncogene.31, 32, 33, 34, 35 In this study, we found that knockdown of MAPKAPK5‐AS1 in CRC cells could lead to changes in related downstream genes, including p15, p21, p27, p57, KLF2, and Trail. Among them, p21 has high basal expression abundance in CRC cells, which aroused our interest. We examine published reports and find that some lncRNAs can play an oncogene function by inhibiting p21 at the transcriptional level, such as lncRNA LUCAT136, 37 and lncRNA TUG1.38, 39, 40, 41 In this study, we used bioinformatics analysis to predict possible binding proteins of MAPKAPK5‐AS1 and further confirmed by RIP experiments that MAPKAPK5‐AS1 binds to EZH2. Subsequently, qRT‐PCR results showed that knockdown of MAPKAPK5‐AS1 significantly upregulated the expression of p21. The ChIP‐qPCR experiments confirmed that MAPKAPK5‐AS1 can bind to EZH2 to inhibit the expression of p21 at the transcriptional level. In summary, we discovered for the first time that MAPKAPK5‐AS1 regulates the biological function of CRC by binding to EZH2 to silence the downstream target gene p21 at the transcriptional level.
We found that high expression of MAPKAPK5‐AS1 in CRC tissue predicts poor prognosis in patients, and the activation of the MAPKAPK5‐AS1/EZH2/p21 regulatory axis plays an important role in the progression of CRC. However, this conclusion still needs to be expanded to verify clinical samples. MAPKAPK5‐AS1 could play another role in CRC and further research is needed.
CONFLICT OF INTEREST
The authors declare that they have no conflict of interest.
5. ETHICAL STANDARDS
All institutional and national guidelines for the care and use of laboratory animals were followed.
ACKNOWLEDGMENTS
This work was supported by Jiangsu Provincial University Natural Science Research Fund (15KJB320006), Nanjing Medical University Youth Fund (2015njmuzd038), and the National Natural Science Foundation of China (81772603).
Ji H, Hui B, Wang J, et al. Long noncoding RNA MAPKAPK5‐AS1 promotes colorectal cancer proliferation by partly silencing p21 expression. Cancer Sci. 2019;110:72–85. 10.1111/cas.13838
Hao Ji, Bingqing Hui, and Jirong Wang contributed equally to this work.
Contributor Information
Juan Li, Email: ljsmz1229@163.com.
Keming Wang, Email: kemingwang@njmu.edu.cn.
REFERENCES
- 1. Siegel RL, Miller KD, Jemal A. Cancer statistics, 2018. CA Cancer J Clin. 2018;68(1):7‐30. [DOI] [PubMed] [Google Scholar]
- 2. Gadalla SM, Widemann BC. Editorial: US cancer statistics of survival: achievements, challenges, and future directions. J Natl Cancer Inst. 2017;109(9): 10.1093/jnci/djx070. [DOI] [PMC free article] [PubMed] [Google Scholar]
- 3. Cronin KA, Lake AJ, Scott S, et al. Annual report to the nation on the status of cancer, part I: national cancer statistics. Cancer. 2018;124(13):2785‐2800. [DOI] [PMC free article] [PubMed] [Google Scholar]
- 4. Favoriti P, Carbone G, Greco M, Pirozzi F, Pirozzi RE, Corcione F. Worldwide burden of colorectal cancer: a review. Updates Surg. 2016;68(1):7‐11. [DOI] [PubMed] [Google Scholar]
- 5. Myint ZW, Goel G. Role of modern immunotherapy in gastrointestinal malignancies: a review of current clinical progress. J Hematol Oncol. 2017;10(1):86. [DOI] [PMC free article] [PubMed] [Google Scholar]
- 6. Help in accessing human genome information. The international human genome sequencing consortium. Science. 2000;289(5484):1471. [DOI] [PubMed] [Google Scholar]
- 7. Grander D, Johnsson P. Pseudogene‐expressed RNAs: emerging roles in gene regulation and disease. Curr Top Microbiol Immunol. 2016;394:111‐126. [DOI] [PubMed] [Google Scholar]
- 8. Washietl S, Kellis M, Garber M. Evolutionary dynamics and tissue specificity of human long noncoding RNAs in six mammals. Genome Res. 2014;24(4):616‐628. [DOI] [PMC free article] [PubMed] [Google Scholar]
- 9. Novikova IV, Hennelly SP, Sanbonmatsu KY. Tackling structures of long noncoding RNAs. Int J Mol Sci. 2013;14(12):23672‐23684. [DOI] [PMC free article] [PubMed] [Google Scholar]
- 10. Wang M, Yuan D, Tu L, et al. Long noncoding RNAs and their proposed functions in fibre development of cotton (Gossypium spp.). New Phytol. 2015;207(4):1181‐1197. [DOI] [PubMed] [Google Scholar]
- 11. Chang L, Yuan Y, Li C, et al. Upregulation of SNHG6 regulates ZEB1 expression by competitively binding miR‐101‐3p and interacting with UPF1 in hepatocellular carcinoma. Cancer Lett. 2016;383(2):183‐194. [DOI] [PubMed] [Google Scholar]
- 12. Shi Y, Li J, Liu Y, et al. The long noncoding RNA SPRY4‐IT1 increases the proliferation of human breast cancer cells by upregulating ZNF703 expression. Mol Cancer. 2015;14:51. [DOI] [PMC free article] [PubMed] [Google Scholar]
- 13. Zhang J, Fan D, Jian Z, Chen GG, Lai PB. Cancer specific long noncoding RNAs show differential expression patterns and competing endogenous RNA potential in hepatocellular carcinoma. PLoS ONE. 2015;10(10):e0141042. [DOI] [PMC free article] [PubMed] [Google Scholar]
- 14. Wang W, Zhao Z, Yang F, et al. An immune‐related lncRNA signature for patients with anaplastic gliomas. J Neurooncol. 2018;136(2):263‐271. [DOI] [PubMed] [Google Scholar]
- 15. Ding J, Li J, Wang H, et al. Long noncoding RNA CRNDE promotes colorectal cancer cell proliferation via epigenetically silencing DUSP5/CDKN1A expression. Cell Death Dis. 2017;8(8):e2997. [DOI] [PMC free article] [PubMed] [Google Scholar]
- 16. Lian Y, Yan C, Xu H, et al. A novel lncRNA, LINC00460, affects cell proliferation and apoptosis by regulating KLF2 and CUL4A expression in colorectal cancer. Mol Ther Nucleic Acids. 2018;12:684‐697. [DOI] [PMC free article] [PubMed] [Google Scholar]
- 17. Lian Y, Xu Y, Xiao C, et al. The pseudogene derived from long non‐coding RNA DUXAP10 promotes colorectal cancer cell growth through epigenetically silencing of p21 and PTEN. Sci Rep. 2017;7(1):7312. [DOI] [PMC free article] [PubMed] [Google Scholar]
- 18. Bayes M, Heath S, Gut IG. Applications of second generation sequencing technologies in complex disorders. Curr Top Behav Neurosci. 2012;12:321‐343. [DOI] [PubMed] [Google Scholar]
- 19. Jiang YY, Zhu H, Zhang H. Analysis of orthologous lncRNAs in humans and mice and their species‐specific epigenetic target genes. Nan Fang Yi Ke Da Xue Xue Bao. 2018;38(6):731‐735. [DOI] [PMC free article] [PubMed] [Google Scholar]
- 20. Xie L, Yao Z, Zhang Y, et al. Deep RNA sequencing reveals the dynamic regulation of miRNA, lncRNAs, and mRNAs in osteosarcoma tumorigenesis and pulmonary metastasis. Cell Death Dis. 2018;9(7):772. [DOI] [PMC free article] [PubMed] [Google Scholar]
- 21. Zhao CN, Mao YM, Liu LN, Li XM, Wang DG, Pan HF. Emerging role of lncRNAs in systemic lupus erythematosus. Biomed Pharmacother. 2018;106:584‐592. [DOI] [PubMed] [Google Scholar]
- 22. Liu W, Cheng C, Lin Y, XuHan X, Lai Z. Genome‐wide identification and characterization of mRNAs and lncRNAs involved in cold stress in the wild banana (Musa itinerans). PLoS ONE. 2018;13(7):e0200002. [DOI] [PMC free article] [PubMed] [Google Scholar]
- 23. Mo X, Li T, Xie Y, et al. Identification and functional annotation of metabolism‐associated lncRNAs and their related protein‐coding genes in gastric cancer. Mol Genet Genomic Med. 2018;6:728‐738. [DOI] [PMC free article] [PubMed] [Google Scholar]
- 24. Ma Z, Gu S, Song M, et al. Long non‐coding RNA SNHG17 is an unfavourable prognostic factor and promotes cell proliferation by epigenetically silencing P57 in colorectal cancer. Mol BioSyst. 2017;13(11):2350‐2361. [DOI] [PubMed] [Google Scholar]
- 25. Lian Y, Yan C, Ding J, et al. A novel lncRNA, LL22NC03‐N64E9.1, represses KLF2 transcription through binding with EZH2 in colorectal cancer. Oncotarget. 2017;8(35):59435‐59445. [DOI] [PMC free article] [PubMed] [Google Scholar]
- 26. Ma Z, Peng P, Zhou J, et al. Long non‐coding RNA SH3PXD2A‐AS1 promotes cell progression partly through epigenetic silencing P57 and KLF2 in colorectal cancer. Cell Physiol Biochem. 2018;46(6):2197‐2214. [DOI] [PubMed] [Google Scholar]
- 27. Wang J, Choi JM, Holehouse AS, et al. A molecular grammar governing the driving forces for phase separation of prion‐like RNA binding proteins. Cell. 2018;174:688‐699. [DOI] [PMC free article] [PubMed] [Google Scholar]
- 28. Li J, Deng SP, Vieira J, et al. RBPMetaDB: a comprehensive annotation of mouse RNA‐Seq datasets with perturbations of RNA‐binding proteins. Database (Oxford). 2018;2018: 10.1093/database/bay054. [DOI] [PMC free article] [PubMed] [Google Scholar]
- 29. Dong Q, Wei L, Zhang MQ, Wang X. Regulatory RNA binding proteins contribute to the transcriptome‐wide splicing alterations in human cellular senescence. Aging (Albany NY). 2018;10(6):1489‐1505. [DOI] [PMC free article] [PubMed] [Google Scholar]
- 30. Holmqvist E, Vogel J. RNA‐binding proteins in bacteria. Nat Rev Microbiol. 2018;16:601‐615. [DOI] [PubMed] [Google Scholar]
- 31. de Rooij L, Chan DCH, Keyvani Chahi A, Hope KJ. Post‐transcriptional regulation in hematopoiesis: RNA binding proteins take control. Biochem Cell Biol. 2018;1‐11. 10.1139/bcb-2017-0310 [DOI] [PubMed] [Google Scholar]
- 32. Mino T, Takeuchi O. Post‐transcriptional regulation of immune responses by RNA binding proteins. Proc Jpn Acad Ser B Phys Biol Sci. 2018;94(6):248‐258. [DOI] [PMC free article] [PubMed] [Google Scholar]
- 33. Dominguez D, Freese P, Alexis MS, et al. Sequence, structure, and context preferences of human RNA binding proteins. Mol Cell. 2018;70(5):854‐867.e9. [DOI] [PMC free article] [PubMed] [Google Scholar]
- 34. Munteanu A, Mukherjee N, Ohler U. SSMART: sequence‐structure motif identification for RNA‐binding proteins. Bioinformatics. 2018; 10.1093/bioinformatics/bty404. [DOI] [PMC free article] [PubMed] [Google Scholar]
- 35. Kramer MC, Anderson SJ, Gregory BD. The nucleotides they are a‐changin’: function of RNA binding proteins in post‐transcriptional messenger RNA editing and modification in Arabidopsis. Curr Opin Plant Biol. 2018;45(Pt A):88‐95. [DOI] [PubMed] [Google Scholar]
- 36. Xiao H, Bao L, Xiao W, et al. Long non‐coding RNA Lucat1 is a poor prognostic factor and demonstrates malignant biological behavior in clear cell renal cell carcinoma. Oncotarget. 2017;8(69):113622‐113634. [DOI] [PMC free article] [PubMed] [Google Scholar]
- 37. Yoon JH, You BH, Park CH, Kim YJ, Nam JW, Lee SK. The long noncoding RNA LUCAT1 promotes tumorigenesis by controlling ubiquitination and stability of DNA methyltransferase 1 in esophageal squamous cell carcinoma. Cancer Lett. 2018;417:47‐57. [DOI] [PubMed] [Google Scholar]
- 38. He Q, Yang S, Gu X, Li M, Wang C, Wei F. Correction to: Long noncoding RNA TUG1 facilitates osteogenic differentiation of periodontal ligament stem cells via interacting with Lin28A. Cell Death Dis. 2018;9(7):710. [DOI] [PMC free article] [PubMed] [Google Scholar]
- 39. Han X, Yang Y, Sun Y, Qin L, Yang Y. LncRNA TUG1 affects cell viability by regulating glycolysis in osteosarcoma cells. Gene. 2018;674:87‐92. [DOI] [PubMed] [Google Scholar]
- 40. Yang F, Li X, Zhang L, Cheng L, Li X. LncRNA TUG1 promoted viability and associated with gemcitabine resistant in pancreatic ductal adenocarcinoma. J Pharmacol Sci. 2018;137:116‐121. [DOI] [PubMed] [Google Scholar]
- 41. Yang B, Tang X, Wang Z, Sun D, Wei X, Ding Y. TUG1 promotes prostate cancer progression by acting as a ceRNA of miR‐26a. Biosci Rep. 2018;38(5). pii: BSR20180677. 10.1042/BSR20180677 [DOI] [PMC free article] [PubMed] [Google Scholar]


