

Abstract
Bladder cancer is the 9th leading cause of cancer death worldwide. The major problem in bladder cancer is primarily the high recurrence rate after drug treatment and resection. Although conventional screening methods, such as cystoscopy, urinary cytology and ultrasound sonography, have become widely used in clinical settings, the diagnostic performance of these modalities is unsatisfactory due to low accuracy or high invasiveness. Because circulating micro RNA (miRNA) profiles have recently been reported as an attractive tool for liquid biopsy in cancer screening, here, we performed global miRNA profiling of 392 serum samples of bladder cancer patients with 100 non‐cancer samples and 480 samples of other types of cancer as controls. We randomly classified the bladder cancer and control samples into 2 cohorts, a training set (N = 486) and a validation set (N = 486). By comparing both controls, we identified specific miRNA, such as miR‐6087, for diagnosing bladder cancer in the training and validation sets. Furthermore, we found that a combination of 7 miRNA (7‐miRNA panel: miR‐6087, miR‐6724‐5p, miR‐3960, miR‐1343‐5p, miR‐1185‐1‐3p, miR‐6831‐5p and miR‐4695‐5p) could discriminate bladder cancer from non‐cancer and other types of tumors with the highest accuracy (AUC: .97; sensitivity: 95%; specificity: 87%). The diagnostic accuracy was high, regardless of the stage and grade of bladder cancer. Our data demonstrated that the 7‐miRNA panel could be a biomarker for the specific and early detection of bladder cancer.
Keywords: bladder cancer, circulating microRNA, diagnosis, early detection, liquid biopsy
1. INTRODUCTION
Bladder cancer is the 9th most common cause of tumor‐related death worldwide1 and affects approximately 3.4 million people; it resulted in 188 000 deaths in 2015.2 Among men, bladder cancer was the 5th most common cancer in 2017, and the incidence in men is 4 times higher than that in women. Although the 5‐year survival rate of bladder cancer is 77%, it decreases depending on the type and stage of bladder cancer. When the tumor is invasive but has not diffused outside the bladder, the 5‐year survival rate is still 70%. However, if the tumor cells migrate into the surrounding tissues, such as sentinel lymph nodes and organs, and spread to distant organs, the 5‐year survival rate decreases to 35% and <10%, respectively.3 Therefore, the early detection of bladder cancer without proximal and distal metastasis is critical to improve the survival of patients with bladder cancer. An important problem associated with bladder cancer screening is that standard methods, such as urinary cytology, ultrasound (sonography) and cystoscopy, remain unsatisfactory due to low accuracy or high invasiveness. For example, urinary cytology is minimally invasive but not so precise (sensitivity: 40%‐60% and specificity: 90%‐100%), and cystoscopy is the reverse. Indeed, even for flexible cystoscopy, the risk of developing a urinary tract infection is approximately 10%.4 Thus, more effective and less invasive diagnostic tools for bladder cancer are urgently needed.
MicroRNA (miRNA) are small non‐coding RNA made up of 18‐24 base pairs with single chain molecules.5, 6 MiRNA modulate gene expression by decreasing target mRNA stability or repressing translational efficiency. They can stably exist in severe conditions, including urine, because some of the miRNA are at least partly packaged into extracellular vesicles or included by an RNA‐induced simple complex (RISC) with the Agonature2 protein to protect against the elimination of RNase.7, 8, 9 Therefore, circulating miRNA, so‐called extracellular miRNA, has garnered a great deal of attention as a novel target of liquid biopsy. Recently, we demonstrated the diagnostic potential of circulating miRNA in body fluids, such as breast cancer, ovarian cancer and bladder cancer.10, 11, 12 Several other research groups have performed large‐scale randomized controlled trials and confirmed the diagnostic value in independent research cohorts of bladder cancer.13, 14
Here, we analyzed 972 serum samples, including 392 bladder cancer samples, 100 non‐cancer control samples and 480 samples of other types of tumors, by performing a comprehensive miRNA microarray. In the training set, we identified 7 miRNA candidates for bladder cancer screening. In particular, a single miRNA, miR‐6087, showed high diagnostic performance for bladder cancer screening. Furthermore, the combination of 7 miRNA (7‐miRNA panel) clearly discriminated bladder cancer from non‐cancer controls and other types of cancer, regardless of cancer stage and grade, enabling the specific and early detection of bladder cancer with high accuracy.
2. MATERIAL AND METHODS
2.1. Patients and sample preparation
Serum samples were obtained from bladder cancer patients (392 samples) who were admitted or referred to the National Cancer Center Hospital (NCCH) between 2008 and 2016 and stored at −20°C. A total of 100 serum samples from non‐cancer individuals were collected from 2 independent cohorts. The first cohort included individuals whose serum samples were collected and stored by the National Center for Geriatrics and Gerontology (NCGG) Biobank between 2010 and 2012 and stored at −80°C. The second cohort included volunteers aged over 35 years who were recruited from the Yokohama Minoru Clinic in 2015 and stored at −80°C. Serum samples from patients with other types of cancers were included. A total of 480 patients with 12 other types of cancers (each: 40 samples) were admitted or referred to the NCCH between 2008 and 2016 and stored at −20°C. Details are described in Appendix S1.
2.2. Micro RNA expression analysis using microarray
Total RNA was extracted from a 300‐μL serum sample using 3D‐Gene RNA extraction reagent from a liquid sample kit (Toray Industries, Kanagawa, Japan) and purified with the RNeasy 96 QIAcube HT Kit (Qiagen, Hilden, Germany). Comprehensive miRNA expression analysis was performed using a 3D‐Gene miRNA labeling kit and a 3D‐Gene Human miRNA Oligo Chip (Toray Industries), which was designed to detect 2565 miRNA sequences registered in miRBase release 21.15 To normalize the signals among the microarrays tested, we pre‐selected 3 internal control miRNA (miR‐149‐3p, miR‐2861 and miR‐4463)10 The usability of these internal control miRNA were confirmed in the present dataset (Table S1). All microarray data of this study are publicly available through the GEO database (GSE113486). Details are described in Appendix S1.
2.3. Quantitative RT‐PCR
The miRNA expression levels were investigated using miScript Primer Assays (Qiagen) with the miScript II RT Kit, the miScript PreAMP PCR Kit and the miScript SYBR Green PCR Kit. Details are described in Appendix S1.
2.4. Statistical analysis
The samples of each clinical condition were independently divided into the training cohort and the validation cohort. With the training cohort, a χ2 test for categorical variables or an unpaired t test for continuous variables was used to compare the characteristics between the 2 clinical groups. Fisher's linear discriminant analysis was performed in the training cohort, and the diagnostic sensitivity, specificity and accuracy were calculated for each miRNA marker or a combination of miRNA markers in the training/validation cohort. When expressions of multiple miRNA were used in the algorithm development, the discriminant functions were created using Fisher's linear discriminant analysis. The resulting values of the discriminant functions were used to prepare the diagnostic index. In clinical samples, an index score of 0 or more was considered to indicate bladder cancer, and an index score of <0 was considered to indicate non‐bladder cancer or other clinical conditions. Details are described in Appendix S1.
2.5. Ethical statement
The present study involving human subjects was approved by: the NCCH Institutional Review Board (21‐074, 2013‐111); the Ethics and Conflict of Interest Committee of the NCGG (754); the Human Tissue Samples Ethics Committee for R&D, Toray Industries (HC2014‐41, 44, HC2015‐2, and 30); and the Research Ethics Committee of Medical Corporation Shintokai Yokohama Minoru Clinic (6019‐18‐3772). Written informed consent was obtained from each subject.
3. RESULTS
3.1. Study design
A total of 972 serum samples, including 392 bladder cancer cases, 100 non‐cancer controls and 480 other types of cancer, were analyzed by miRNA microarray, generating global miRNA expression profiles. We randomly classified the bladder cancer cases, non‐cancer controls and other types of cancer samples into 2 cohorts: a training set and a validation set. In each set, 192 bladder cancer patients, 50 non‐cancer controls and 240 other types of cancer samples were included (Figure 1A). Participants’ characteristics are described in Table 1. There was no statistically significant difference in the clinicopathological characteristics, including gender, pathological T stage and pathological grade (Table 1), between the 2 different cohorts. In the miRNA microarray, expression levels of 2565 miRNA were comprehensively examined. To identify miRNA biomarker candidates, we focused on highly detected miRNA (≥26 of normalized levels in signal intensity at least in the analyses of more than half in each clinical group). The 386 miRNA that were considered to represent high detection were applied for Fisher's linear discriminant analysis in the training set (Figure 1B).
Figure 1.
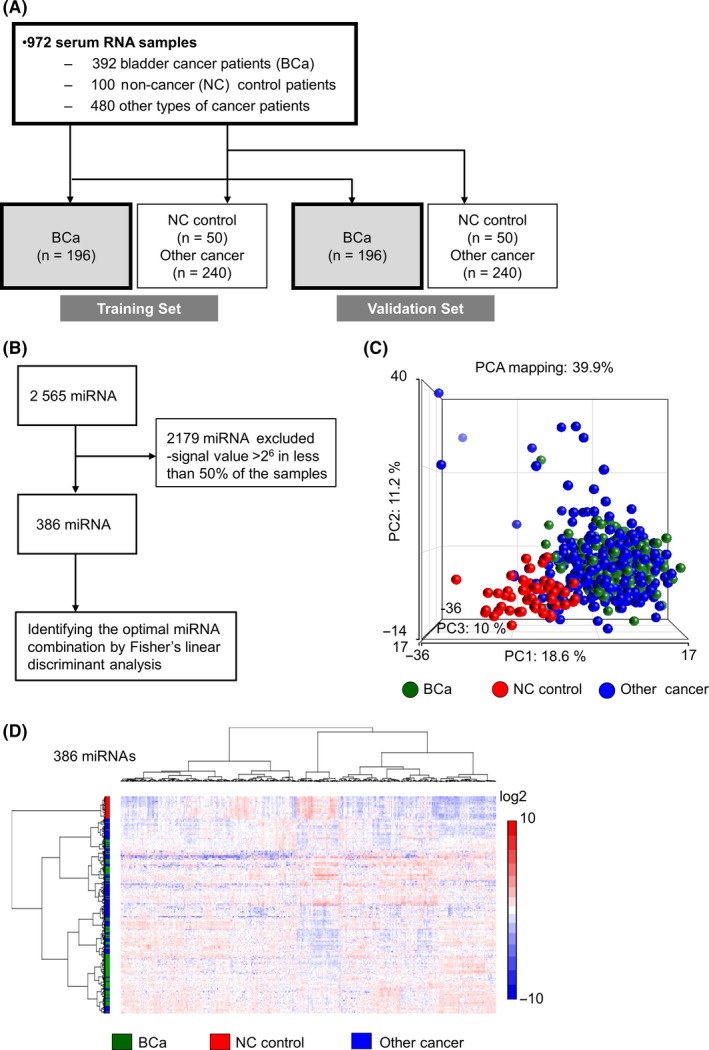
The strategy to select candidate miRNA for bladder cancer diagnosis. A, Work flow of bladder cancer, non‐cancer and other cancer patients for establishing the diagnostic model. Serum samples were obtained from 392 bladder cancer (BCa), 100 non‐cancer (NC) control and 480 other cancer (12 types of solid cancer) patients. The sample set was divided into 2 groups, the training set and the validation set. B, Flow diagram of miRNA for selecting candidate miRNA. A total of 2178 microRNA (miRNA) were excluded for the biomarker search due to low expression. C, A principal component analysis map for 196 bladder cancer, 50 non‐cancer and 240 other cancer samples using 386 highly expressed miRNA. D, A hierarchical clustering analysis of a heatmap showing 196 bladder cancer, 50 non‐cancer and 240 other cancer samples with highly expressed 386 miRNA
Table 1.
Characteristics of patients
| Characteristics | Discovery set (n = 546) | Validation set (n = 546) | P‐value |
|---|---|---|---|
| Bladder cancer | 196 | 196 | |
| Median age, y (range) | 69 (60‐76) | 68 (62‐74) | .95 |
| Sex, n (%) | |||
| Male | 137 (69.9) | 146 (74.5) | .31 |
| Female | 59 (30.1) | 50 (25.5) | |
| Urinary cytology, n (%) | |||
| Class I | 15 (7.7) | 21 (10.7) | .2 |
| Class II | 64 (32.6) | 51 (26.0) | |
| Class III | 30 (15.3) | 43 (21.9) | |
| Class IV | 29 (14.8) | 21 (10.7) | |
| Class V | 52 (26.5) | 51 (26.0) | |
| NA | 6 (3.1) | 9 (4.6) | |
| Tumor stage, n (%) | |||
| <pT2 | 150 (76.5) | 150 (76.5) | .85 |
| ≥pT2 | 46 (23.5) | 44 (22.4) | |
| NA | 0 | 2 (1.0) | |
| Pathological grade, n (%) | |||
| Low grade | 36 (18.4) | 41 (20.9) | .53 |
| High grade | 160 (81.6) | 155 (79.1) | |
| Lymph node status, n (%) | |||
| N+ | 18 (9.2) | 24 (12.2) | .35 |
| cN0 or pN0 | 162 (82.6) | 158 (80.6) | |
| NA | 16 (8.2) | 12 (6.1) | |
| Metastatic status, n (%) | |||
| M1 | 9 (4.6) | 8 (4.1) | .79 |
| M0 | 172 (87.8) | 175 (89.3) | |
| NA | 15 (7.6) | 13 (6.6) | |
| Healthy control | 50 | 50 | |
| Median age, y (range) | 61(51‐59) | 68 (52‐68) | .72 |
| Sex, n (%) | |||
| Male | 23 (46.0) | 25 (50.0) | .69 |
| Female | 27 (54.0) | 25 (50.0) | |
| Other cancer | 240 | 240 | |
| Median age, y (range) | 63 (56‐71) | 63 (54‐70) | .83 |
| Sex, n (%) | |||
| Male | 150 (62.5) | 136 (56.7) | .19 |
| Female | 90 (37.5) | 104 (43.3) | |
3.2. Selection of circulating micro RNA biomarker candidates for bladder cancer detection
For the 386 miRNA, principal component analysis (PCA) mapping (Figure 1C) and hierarchical unsupervised clustering analysis with a heatmap (Figure 1D) were generated to visualize the expression patterns of miRNA in all samples in the training set. Both classification analyses indicated that expression profiles of miRNA in non‐cancer controls were distinct from those in bladder cancer and other types of cancer; however, the analyses failed to differentiate between bladder cancer and other types of cancer samples in miRNA profiling (Figure 1C,D).
As a next step, to develop a better classification method, we used Fisher's linear discriminant analysis to design comprehensive classifiers consisting of 1‐9 miRNA in the training set, and the best results of each combination are shown in Table 2. Based on the optimal level of the area under the curve (AUC: .98) and accuracy, the analysis identified a combination of 7 miRNA (miR‐6087, miR‐6724‐5p, miR‐3960, miR‐1343‐5p, miR‐1185‐1‐3p, miR‐6831‐5p and miR‐4695‐5p), designated the 7‐miRNA panel, that exhibited the best discrimination performance in the training set (diagnostic index = (−2.21832)*miR‐6087 + (2.17809)*miR‐6724‐5p + (−1.04605)*miR‐3960 + (−1.57609)*miR‐1343‐5p + (.202966)*miR‐1185‐1‐3p + (.203839)*miR‐6831‐5p + (−.411172)*miR‐4695‐5p + 34.7121). A receiver operating characteristic (ROC) curve analysis showed the following values: AUC: .98; sensitivity: 91%; and specificity: 98% (Table 2 and Figure 2A middle). Except for miR‐4695‐5p, the expression levels of single miRNA were significantly altered between bladder cancer and both controls; miR‐6087, miR‐3960 and miR‐1343‐5p were downregulated in bladder cancer, and miR‐6724‐5p, miR‐1185‐1‐3p and miR‐6831‐5p were upregulated in bladder cancer (Figure 3). Of note, the diagnostic performance of the single miRNA miR‐6087 (diagnostic index = (−2.47083)*miR‐6087 + 29.1765), which is the most downregulated miRNA in bladder cancer, exhibited high accuracy based on the ROC curve analysis (AUC: .88, sensitivity: 93%; and specificity: 79%) in the training set (Figure 2A upper). Using quantitative RT‐PCR (qRT‐PCR) for validation, we confirmed that the expression levels of miR‐6087 and miR‐1343‐5p significantly decreased in bladder cancer (Figure S1C). In the process of quantitative PCR validation of selected miRNA, all internal control miRNA (Figure S1A,B) were stably detected in bladder cancer and other types of cancer samples. With the validated 2 miRNA, we established the discriminant. The diagnostic performance of the 2 miRNA (diagnostic index = (−2.49199)*miR‐6087 + (−1.14124)*miR‐1343‐5p + 40.6986) had higher accuracy than the single miRNA miR‐6087 (AUC: .90, sensitivity: 97%, specificity: 74%; Figure 2A lower).
Table 2.
Discriminant analysis for bladder cancer in the training set
| Model | miRNA number | Sensitivity | Specificity | Accuracy | AUC |
|---|---|---|---|---|---|
| Model 1 | 1 | .94 | .77 | .84 | .88 |
| Model 2 | 2 | .95 | .81 | .86 | .91 |
| Model 3 | 3 | .95 | .87 | .90 | .94 |
| Model 4 | 4 | .97 | .86 | .91 | .95 |
| Model 5 | 5 | .98 | .87 | .91 | .97 |
| Model 6 | 6 | .97 | .90 | .93 | .97 |
| Model 7 | 7 | .98 | .91 | .94 | .98 |
| Model 8 | 8 | .98 | .91 | .94 | .98 |
| Model 9 | 9 | 1.00 | .90 | .94 | .98 |
AUC, area under the curve.
Model 1: (−2.47083)*hsa‐miR‐6087 + 29.1765.
Model 2: (−2.45684)*hsa‐miR‐6087 + (.674768)*hsa‐miR‐663a + 20.7712.
Model 3: (−2.47956)*hsa‐miR‐6087 + (−1.18834)*hsa‐miR‐6781‐5p + (.662579)*hsa‐miR‐744‐5p + 34.9109.
Model 4: (−1.67453)*hsa‐miR‐6087 + (−1.07965)*hsa‐miR‐3940‐5p + (−.865343)*hsa‐miR‐4728‐5p + (.936314)*hsa‐miR‐6819‐5p + 30.2466.
Model 5: (−2.33489)*hsa‐miR‐6087 + (2.1135)*hsa‐miR‐6724‐5p + (−1.28296)*hsa‐miR‐3960 + (−1.33813)*hsa‐miR‐1343‐5p + (.211841)*hsa‐miR‐1185‐2‐3p + 35.6487.
Model 6: (−2.22483)*hsa‐miR‐6087 + (1.96229)*hsa‐miR‐6724‐5p + (−1.1623)*hsa‐miR‐3960 + (−1.24909)*hsa‐miR‐1343‐5p + (.191799)*hsa‐miR‐1185‐2‐3p + (.0988384)*hsa‐miR‐4658 + 32.9756.
Model 7: (−2.21832)*hsa‐miR‐6087 + (2.17809)*hsa‐miR‐6724‐5p + (−1.04605)*hsa‐miR‐3960 + (−1.57609)*hsa‐miR‐1343‐5p + (.202966)*hsa‐miR‐1185‐1‐3p + (.203839)*hsa‐miR‐6831‐5p + (−.411172)*hsa‐miR‐4695‐5p + 34.7121.
Model 8: (−2.23426)*hsa‐miR‐6087 + (2.10616)*hsa‐miR‐6724‐5p + (−1.09832)*hsa‐miR‐3960 + (−1.49652)*hsa‐miR‐1343‐5p + (.233803)*hsa‐miR‐1185‐1‐3p + (.209904)*hsa‐miR‐6831‐5p + (−.365926)*hsa‐miR‐4695‐5p + (−.195056)*hsa‐miR‐7109‐5p + 36.4566.
Model 9: (−2.18021)*hsa‐miR‐6087 + (2.14473)*hsa‐miR‐6724‐5p + (−.990552)*hsa‐miR‐3960 + (−1.3526)*hsa‐miR‐1343‐5p + (.201392)*hsa‐miR‐1185‐1‐3p + (.215897)*hsa‐miR‐6831‐5p + (−.117666)*hsa‐miR‐3184‐5p + (−.0946823)*hsa‐miR‐7108‐3p + (−.373914)*hsa‐miR‐4695‐5p + 32.4599.
Figure 2.
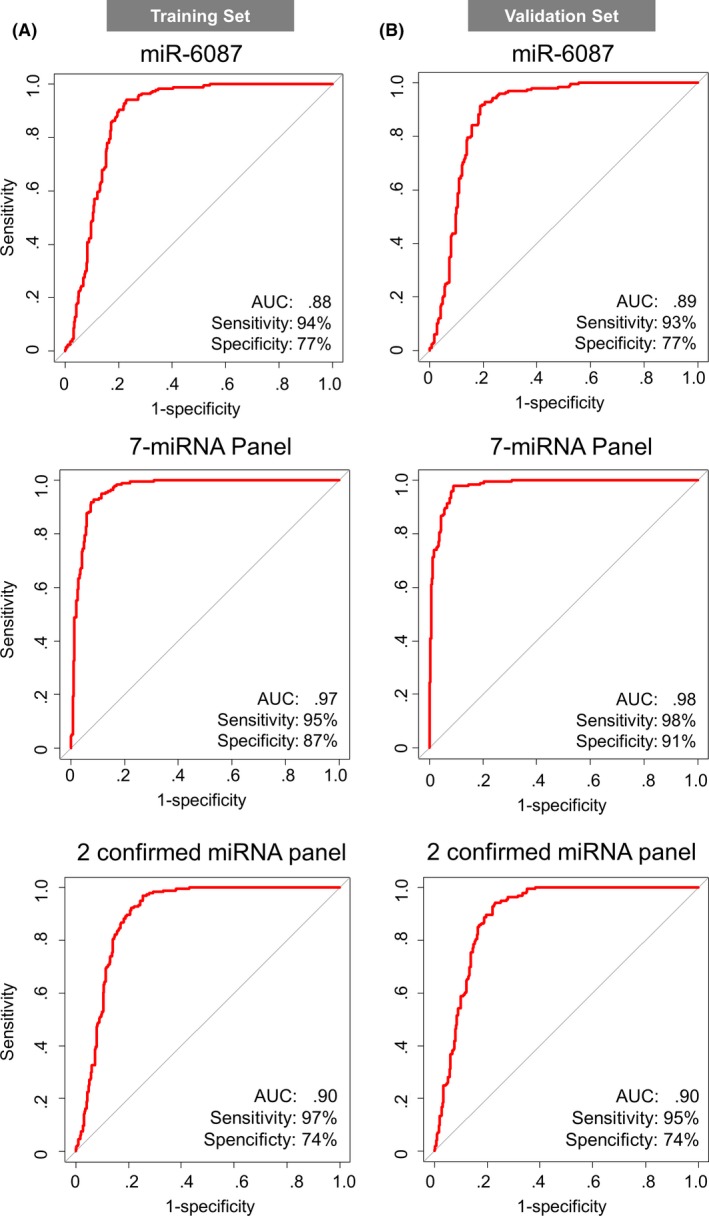
Receiver operating characteristic (ROC) curve analysis of miR‐6087, 7‐miRNA panel and 2 confirmed miRNA panel in the training set and the validation set. A, ROC curves for detecting bladder cancer patients using miR‐6087, 7‐miRNA panel and 2 confirmed miRNA panel selected for diagnostic models in the training set. B, ROC curves of miR‐6087, 7‐miRNA panel and 2 confirmed miRNA panel in the validation set
Figure 3.
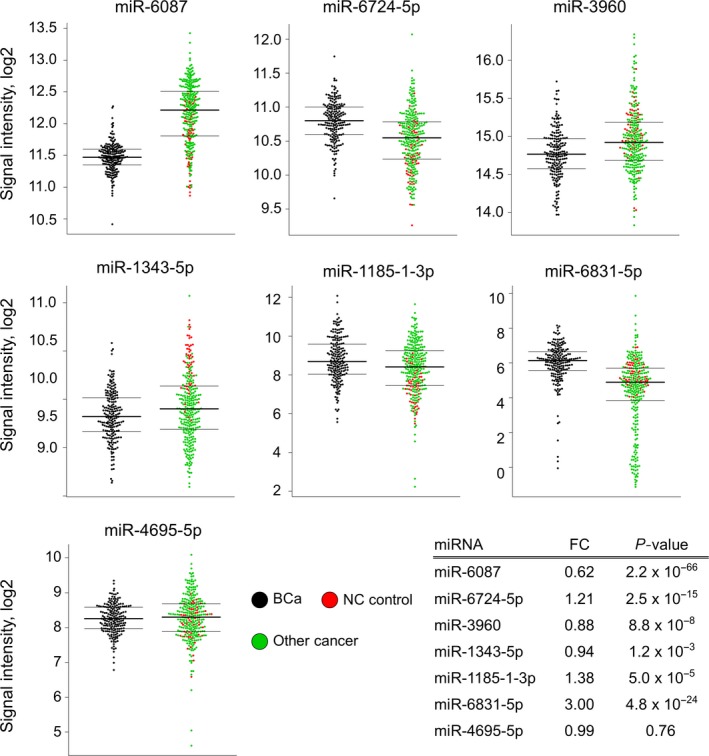
Selected 7 miRNA expression levels among bladder cancer, non‐cancer and other cancer samples. Expression levels of 7 selected miRNA, including miR‐6087, miR‐6724‐5p, miR‐3960, miR‐1343‐5p, miR‐1185‐1‐3p, miR‐6831‐5p and miR‐4695‐5p, in dot plots. Black: bladder cancer samples (n = 196). Red: non‐cancer samples (n = 50). Green: other types of cancer samples (n = 240) in the training set. Fold change and P‐value are shown for 7 miRNA
The diagnostic performance of these models (single miRNA‐6087, 7‐miRNA panel and the 2 confirmed miRNA panel) was confirmed in the validation set, revealing that the model was highly accurate (single miRNA‐6087: AUC: .89; sensitivity: 93%; specificity: 77%; negative predictive value [NPV]: 92%; and positive predictive value [PPV]: 80%, 7‐miRNA panel: AUC: .97; sensitivity: 95%; specificity: 87%; NPV: 95%; and PPV: 88%, 2 confirmed miRNA panel: AUC: .90; sensitivity: 95%; specificity: 74%; NPV: 93%; and PPV: 79%) in the ROC curve analysis (Figure 2B). Our models could predict the presence of bladder cancer with statistical significance by distinguishing it from non‐cancer and other types of cancer in the patients.
3.3. Comparison of bladder cancer and other types of cancers using the diagnostic index
We next attempted to investigate the diagnostic performance of single miR‐6087, the 7‐miRNA panel and the 2 confirmed miRNA panel for discriminating bladder cancer from 12 other types of cancers. For this purpose, 20 serum samples, each from 12 types of cancers, were applied. Based on the expression profiles of the single miRNA‐6087, 7 miRNA and 2 confirmed miRNA, the diagnostic index was calculated and individually plotted on the graph (Figure 4A‐C). The analysis of the diagnostic index indicated the high accuracy of the model, showing high sensitivity (the single miRNA: 94.4%, the 7‐miRNA panel: 95.4%, the 2 confirmed miRNA: 94.9%) and high specificity (84.5% on average) for these 12 solid cancers. Although the separation in gastric adenocarcinoma (GC) and biliary tract cancer (BT) was not very clear, for distinguishing sarcoma (SA), pancreatic cancer (PC) and breast cancer (BC), the specificities were 100% in this analysis of 7‐miRNA panel. Thus, the analysis demonstrated that the performance of this 7‐miRNA panel for bladder cancer discrimination was robustly validated, and high accuracy was also shown in specifically distinguishing bladder cancer from other types of cancers.
Figure 4.
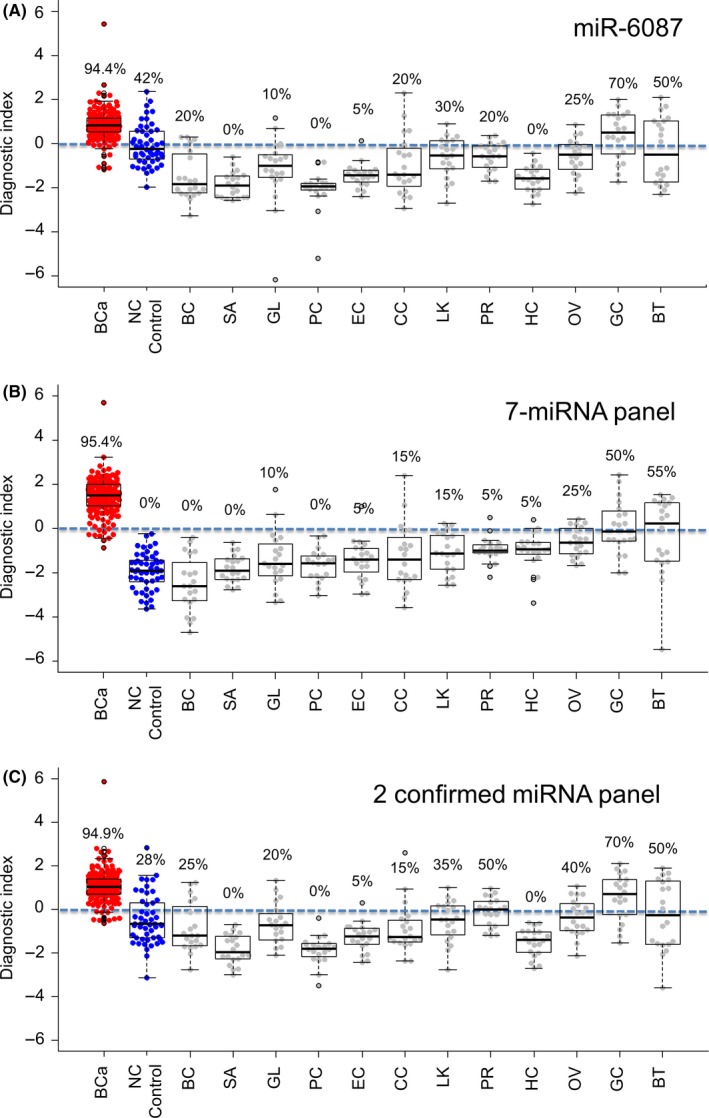
Diagnostic performance of the discriminants in other types of cancers. A‐C, Diagnostic index was calculated and plotted in a dot plot among 12 different cancers (BC, breast cancer; BT, biliary tract cancer; CC, colorectal adenocarcinoma; EC, esophageal squamous cell carcinoma; GC, gastric adenocarcinoma; GL, glioma; HC, hepatocellular carcinoma; LK, lung carcinoma; OV, ovarian cancer; PC, pancreatic cancer; PR, prostate cancer; SA, bone and soft tissue sarcoma) for the discriminants. An index score ≥0 indicated bladder cancer and an index score <0 indicated the absence of bladder cancer. Each positive rate is shown in the plot
3.4. Diagnostic performance of single miR‐6087, the 7‐miRNA panel and the 2 confirmed micro RNA panel according to clinical conditions
Whether the biomarker is effective and feasible in the early stages of cancer is critical; thus, we also examined the diagnostic performance of the 7‐miRNA panel for bladder cancer based on clinical conditions. Grade and T stage were used to assess the performance of the diagnostic index. When PCA maps of bladder cancer samples with 386 highly expressed miRNA were generated by grade, T stage (Figure S2A,B), patient age and gender (Figure S2C,D), there was no clear difference in these factors. Then, the diagnostic index of the 7‐miRNA panel was calculated and showed high performance for grade (low grade: 92.7% and high grade: 96.1%) (Figure 5A middle). Similarly, the diagnostic index according to T stage was also high and comparable between the early and late stages (<pT2: 94.7% and ≥pT2: 97.7) (Figure 5B middle). In contrast, the diagnostic index of the single miRNA and 2 confirmed miRNA panel also had a high performance for grade and T stage (Figure 5A,B; the single miRNA: upper, 2 confirmed miRNA: lower). Furthermore, according to N status and M status, it had also no significant (Figure S3A,B). The data indicated that the 7‐miRNA panel could be feasible for use in early detection of bladder cancer using patient serum samples. Urinary cytology is commonly used to diagnose bladder cancer despite having low sensitivity. The 7‐miRNA panel could detect bladder cancer in all classes of urinary cytology with negative cytology (class I + II: 97%; Figure S4A,B). The data also indicated that the 7‐miRNA panel had higher accuracy than urinary cytology.
Figure 5.
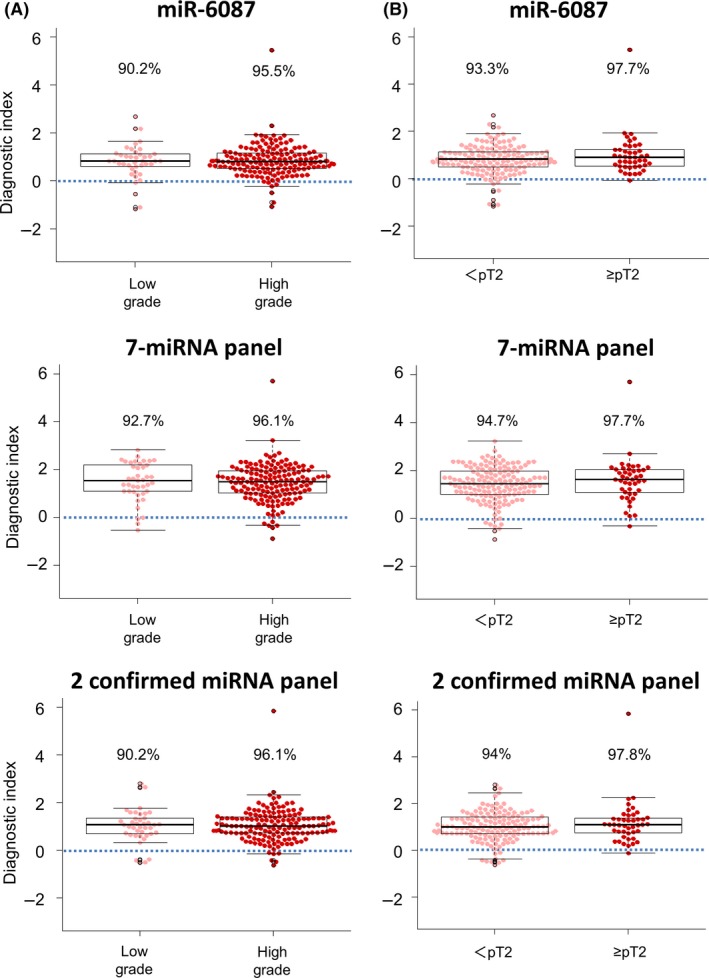
Diagnostic performance of the model according to the clinical condition. A, Diagnostic performance of the miR‐6087, 7‐miRNA panel and 2 confirmed miRNA panel model based on clinical grade in the validation set. B, Diagnostic performance of the miR‐6087, 7‐miRNA panel and 2 confirmed miRNA panel model based on T stage. An index score ≥0 indicated bladder cancer and an index score <0 indicated the absence of bladder cancer. Each positive rate is shown in the plot
We also designed the model to distinguish between <pT2 (n = 300) and ≥pT2 (n = 90), by separating a training set and a validation set. As shown in Table S2, we selected the best miRNA combination based on Fisher's linear discriminant analysis, which is the same approach for identifying the 7‐miRNA panel for bladder cancer discrimination. In the training set, the best model showed an AUC of .70, and in the validation set, it showed an AUC of .59 (Figure S5A). Using this model, we attempted to distinguish between bladder cancer samples and other controls (healthy and other cancers); however, the discrimination performance is actually much lower (AUC: .61, Figure S5B).
4. DISCUSSION
In this study, the levels of serum miR‐6724‐5p, miR‐1185‐1‐3p and miR‐6831‐5p were significantly elevated, and those of serum miR‐6087, miR‐3960 and miR‐1343‐5p were significantly reduced in bladder cancer patients compared with individuals without cancer or patients with 12 other types of solid tumors. The Fisher's linear discriminant analysis‐based combination of these serum miRNA levels (the 7‐miRNA panel and 2 confirmed miRNA panel) showed high accuracy in discriminating individuals with bladder cancer from the control groups, including non‐cancer controls (participants without cancer) and other types of cancer patients. Compared with typical urine tumor biomarkers, such as the Nuclear Matrix Protein 22 (NMP22) and BTA stat test, our model had much higher sensitivity and specificity.16, 17, 18 In the training and validation sets, the 7‐miRNA panel in bladder cancer showed high sensitivity (95%‐98%) and specificity (87%‐91%), whereas another typical tumor detection method, urinary cytology, which is also a low‐invasiveness test, had 48% sensitivity and 86% specificity.19 Notably, the 7‐miRNA panel in bladder cancer is also effective for the detection of both low and high grades (92.7% and 96.1% in sensitivity, respectively), suggesting that the performance of the 7‐miRNA panel is independent of tumor grade. Likewise, the sensitivity of the 7‐miRNA panel to detect patients with T stage <pT2 and stage ≥pT2 bladder cancer (94.7% and 97.7% sensitivity, respectively) was comparable; thus, it could be applicable for detection of both early‐stage and late‐stage cancer. In addition, the 7‐miRNA panel and 2 confirmed miRNA panel in bladder cancer could specifically distinguish bladder cancer from 12 other types of solid tumors. These findings highlight the potential of the 7‐miRNA panel for non‐invasive assessment of bladder cancer in the preclinical stages.
Recently, the molecular characterization of cell‐free DNA, circulating tumor DNA and circulating miRNA by liquid biopsy is an attractive alternative to tissue biopsy to diagnose cancer and other diseases.13, 14, 15, 20, 21, 22, 23 For diagnosis of bladder cancer by liquid biopsy, there are several reports of biomarker searches with large samples, including those detecting tumor‐specific hotspot mutations in serum DNA or miRNA in urine from patients.20, 21 For the study of serum miRNA, a few studies have investigated the potential of miRNA detection in serum for biomarkers in bladder cancer.13, 14, 15 Most of these previous reports have performed microarray or next‐generation sequencing with serum miRNA samples from patients diagnosed with bladder cancer and control individuals (non‐cancer controls) to detect preclinical bladder cancer. A unique aspect of our study is that the 7‐miRNA panel and 2 confirmed miRNA panel could distinguish bladder cancer patients from 12 other types of solid tumors. In addition, the diagnostic performance of both panels for non‐muscle invasive bladder cancer (T stage <pT2) could reach an accuracy >90% in the diagnostic index. Because bladder cancer occurs in normal urothelial cells and does not invade muscle from the beginning, both panels could detect non‐muscle invasive bladder cancer. However, both panels could not separate non‐muscle and muscle invasive bladder cancer, which is most valuable information for deciding whether cystectomy is performed or not.
In addition, urinary cytology, which has high specificity but low sensitivity, is commonly used for detecting bladder cancer. In the bladder cancer group, many cases also had not been captured by urinary cytology (Table 1). However, the 7‐miRNA panel could be an effective biomarker in bladder cancer patients with negative urinary cytology. In particular, urologists have been unsure of whether to diagnose class III cases as bladder cancer. They are reported as atypical cells with low‐grade bladder cancer potential.24 In Figure S4B, class III is included in the malignant group (class III‐V) because most urologists actively observe and/or re‐examine class III cases.
Unexpectedly, we found that a single miRNA, miR‐6087, had remarkably high diagnostic power, with an AUC of .89, sensitivity of 93% and specificity of 77% for detecting individuals with bladder cancer in the validation set. To our knowledge, there is no report showing the relationship between bladder cancer and miR‐6087. Our miRNA microarray analysis clearly indicated that miR‐6087 expression was statistically significantly decreased in patients with bladder cancer, although the molecular mechanism of the downregulation of miR‐6087 remains unclear. One report showed miR‐6087 detection in patients with class IV lupus nephritis, which is commonly developed in patients with systemic lupus erythematous in the Colombian population.25 In the paper, Navarro‐Quiroz et al show the upregulation of miR‐6087 in serum samples of patients with lupus nephritis. In another study, it has been shown that miR‐6087 may regulate endothelial cell differentiation by downregulating endoglin.26 Interestingly, when we elaborately examined the expression patterns of miR‐6087 in bladder cancer, non‐cancer and other cancer samples, a remarkable difference was observed between bladder cancer and other cancer samples, and not between bladder cancer and non‐cancer samples (Figure 3). These data suggest that the quantity of serum miR‐6087 generally increased in cancer but not in bladder cancer. In addition to miR‐6087, similar trends in miRNA expression among all samples were seen in miR‐6831‐5p, which was clearly decreased in some types of other cancer samples but not in non‐cancer controls. Therefore, the detection of serum miR‐6087 and miR‐6831‐5p levels could critically contribute to the discrimination of individuals with bladder cancer from those with other types of cancer. Another interesting fact is that serum miR‐1343‐5p levels are higher in non‐cancer controls than in cancer samples, including bladder and 12 other types of cancer (Figure 4), suggesting that the downregulation of serum miR‐1343‐5p levels could be a biomarker for cancer patients.
Although this evidence highlights the important roles of serum miRNA in the biomarker discovery, there are a few criticisms of the present study. One of these issues is that all microarray experiments to generate miRNA profiles were conducted with the serum miRNA samples, which were retrospectively collected in the hospitals. All serum samples from cancer patients were collected in the NCCH. However, non‐cancer samples were collected from different hospitals. Before performing the microarray analysis, it was evident that there were inconsistencies in the time intervals for sample preparation, storage periods and storage temperatures, which were not strictly regulated among hospitals. The stability of miRNA in body fluid could affect the sample quality and miRNA expression levels.27, 28 Furthermore, the storage procedures for non‐cancer samples were not consistent among facilities. To minimize bias of the results, we also included serum samples of patients with the other cancers in the control group, which were collected in the same facility using the same methods as for bladder cancer samples. Therefore, although we believe that we successfully constructed a bladder cancer‐specific diagnostic model, further validation studies are needed. In addition, the method of selection of control samples to distinguish bladder cancer is open to debate. In this study, we prepared serum samples from healthy individuals and other types of cancer samples as controls; however, it could be better to use at‐risk samples of bladder cancer such as patients with hematuria as controls. For comparison of the serum samples between bladder cancer patients and patients at risk of bladder cancer and to further confirm our data in this work, we have started a prospective trial in the clinical setting, and the analysis of fresh blood samples will assist in standardizing our models for bladder cancer screening and surveillance in the coming years. Another limitation is that the origins of the 7 miRNA and their functions in bladder cancer are totally unknown. Because the miRNA that we found to be bladder cancer biomarkers are relatively newly discovered miRNA, there is almost no literature on them in relation to cancer biology.
It is important to consider whether the present study confirmed orthogonal validation for microarray data using miRNA‐seq or qRT‐PCR. We previously performed miRNA‐seq and microarray analysis using the same 20 serum samples stocked in NCC Biobank (unpublished data). According to our miRNA‐Seq results, the number of sequence reads that were perfectly matched with mature miRNA sequences based on miRBase was limited. In the analysis of miRNA‐seq data, when we defined the full length of a mature miRNA sequence as “L,” the perfect match in length of “L‐2” was counted as the presence of this miRNA, considering the sequence variations of miRNA, such as 5′ trimming, 3′ trimming, substitutions and 3′ additions. We demonstrated a significant correlation between the microarray and miRNA‐Seq results for miRNA with read counts greater than 10 reads per million total reads.
Because, for PCR quantification, the sequence needs to be perfectly matched to the primer designed, the validation and microarray data often had differences. Thus, qRT‐PCR methods might not be suitable for the validation of microarray results. However, we performed qRT‐PCR for validation to confirm the expression levels of the internal control and to compare the expression levels of candidate miRNA between bladder cancer and other types of cancer. The former, the internal control miRNA (miR‐149‐3p, miR‐2861 and miR‐4463), had stable expression in each sample, and our microarray performance had accurate data. The latter, 2 miRNA (miR‐6087 and miR‐1343‐5p), had similar expression as for the microarray analysis (Figure S1B). Although PCR quantification might not be suitable for validation of microarrays, our qRT‐PCR analysis tended to present similar results as for microarrays.
Taken together, the data presented in this study suggest that both panels could detect early‐stage and both high‐grade and low‐grade bladder cancers using a small quantity of blood samples, and that the method is clinically feasible and valuable for the surveillance of bladder cancer in at‐risk groups. Our microarray‐based serum miRNA detection method is based on techniques including serum collection, miRNA extraction and miRNA microarray, which are robust and simple experimental procedures. Thus, miRNA‐based bladder cancer detection should be useful for the primary screening and surveillance of bladder cancer and should become prevalent in clinical settings.
DISCLOSURE
ST is an employee of Toray Industries, the provider of the 3D‐Gene system. YA is an employee of Dynacom, the developer of the statistical script used for selecting the best miRNA combination. All other authors have no conflict of interest to declare.
Supporting information
ACKNOWLEDGMENTS
The authors thank Tomomi Fukuda, Takumi Sonoda, Hiroko Tadokoro, Megumi Miyagi, Tatsuya Suzuki and Kamakura Techno‐Science for performing the microarray assays, Junpei Kawauchi and Satoshi Kondou for technical support, Noriko Abe for the management of serum samples, Michiko Ohori for the management of personal information, Hitoshi Fujimiya for developing in‐house analytic tools, and Kazuki Sudo for independent confirmation of participant eligibility. Some of the samples were obtained from NCC Biobank, which is supported by NCC Research and Development Fund (29‐A‐1). Some clinical information was obtained from the Center for Cancer Registries, NCC. The authors also thank Biobank at the NCGG for providing biological resources.
Usuba W, Urabe F, Yamamoto Y, et al. Circulating miRNA panels for specific and early detection in bladder cancer. Cancer Sci. 2019;110:408–419. 10.1111/cas.13856
[Correction added on 26 December 2018, after first online publication: Author contributions to the first 3 authors were added]
REFERENCES
- 1. Ferlay J, Soerjomataram I, Dikshit R, et al. Cancer incidence and mortality worldwide: sources, methods and major patterns in GLOBOCAN 2012. Int J Cancer. 2015;136:E359‐E386. 10.1002/ijc.29210. [DOI] [PubMed] [Google Scholar]
- 2. Wang H, Naghavi M, Allen C, et al. Global, regional, and national life expectancy, all‐cause mortality, and cause‐specific mortality for 249 causes of death, 1980‐2015: a systematic analysis for the Global Burden of Disease Study 2015. Lancet. 2016;388:1459‐1544. 10.1016/s0140-6736(16)31012-1. [DOI] [PMC free article] [PubMed] [Google Scholar]
- 3. Cancer.Net . Bladder cancer: statistics; Cancer.Net, Doctor‐approved patient information from ASCO website. 2017. https://www.cancer.net/cancer-types/bladder-cancer/statistics. Accessed March 15, 2018.
- 4. Almallah YZ, Rennie CD, Stone J, Lancashire MJ. Urinary tract infection and patient satisfaction after flexible cystoscopy and urodynamic evaluation. Urology. 2000;56:37‐39. [DOI] [PubMed] [Google Scholar]
- 5. Bartel DP. MicroRNAs genomics, biogenesis, mechanism, and function. Cell. 2004;116:281‐297. [DOI] [PubMed] [Google Scholar]
- 6. Ruan K, Fang X, Ouyang G. MicroRNAs: novel regulators in the hallmarks of human cancer. Cancer Lett. 2009;285:116‐126. 10.1016/j.canlet.2009.04.031. [DOI] [PubMed] [Google Scholar]
- 7. Mlcochova H, Hezova R, Stanik M, Slaby O. Urine microRNAs as potential noninvasive biomarkers in urologic cancers. Urol Oncol. 2014;32(41):e1‐e9. 10.1016/j.urolonc.2013.04.011. [DOI] [PubMed] [Google Scholar]
- 8. Kosaka N, Iguchi H, Ochiya T. Circulating microRNA in body fluid: a new potential biomarker for cancer diagnosis and prognosis. Cancer Sci. 2010;101:2087‐2092. 10.1111/j.1349-7006.2010.01650.x. [DOI] [PMC free article] [PubMed] [Google Scholar]
- 9. Kosaka N, Yoshioka Y, Fujita Y, Ochiya T. Versatile roles of extracellular vesicles in cancer. J Clin Invest. 2016;126:1163‐1172. 10.1172/jci81130. [DOI] [PMC free article] [PubMed] [Google Scholar]
- 10. Shimomura A, Shiino S, Kawauchi J, et al. Novel combination of serum microRNA for detecting breast cancer in the early stage. Cancer Sci. 2016;107:326‐334. 10.1111/cas.12880. [DOI] [PMC free article] [PubMed] [Google Scholar]
- 11. Yokoi A, Yoshioka Y, Hirakawa A, et al. A combination of circulating miRNAs for the early detection of ovarian cancer. Oncotarget. 2017;8:89811‐89823. 10.18632/oncotarget.20688. [DOI] [PMC free article] [PubMed] [Google Scholar]
- 12. Sasaki H, Yoshiike M, Nozawa S, et al. Expression level of urinary microRNA‐146a‐5p is increased in patients with bladder cancer and decreased in those after transurethral resection. Clin Genitourin Cancer. 2016;14:e493‐e499. 10.1016/j.clgc.2016.04.002. [DOI] [PubMed] [Google Scholar]
- 13. Du L, Jiang X, Duan W, et al. Cell‐free microRNA expression signatures in urine serve as novel noninvasive biomarkers for diagnosis and recurrence prediction of bladder cancer. Oncotarget. 2017;8:40832‐40842. 10.18632/oncotarget.16586. [DOI] [PMC free article] [PubMed] [Google Scholar]
- 14. Jiang X, Du L, Wang L, et al. Serum microRNA expression signatures identified from genome‐wide microRNA profiling serve as novel noninvasive biomarkers for diagnosis and recurrence of bladder cancer. Int J Cancer. 2015;136:854‐862. 10.1002/ijc.29041. [DOI] [PubMed] [Google Scholar]
- 15. Kozomara A, Griffiths‐Jones S. miRBase: annotating high confidence microRNAs using deep sequencing data. Nucleic Acids Res. 2014;42(Database issue):D68‐D73. 10.1093/nar/gkt1181 [DOI] [PMC free article] [PubMed] [Google Scholar]
- 16. Wadhwa N, Jatawa SK, Tiwari A. Non‐invasive urine based tests for the detection of bladder cancer. J Clin Pathol. 2012;65:970‐975. 10.1136/jclinpath-2012-200812. [DOI] [PubMed] [Google Scholar]
- 17. Raitanen MP; FinnBladder Group . The role of BTA stat Test in follow‐up of patients with bladder cancer: results from FinnBladder studies. World J Urol. 2008;26:45‐50. 10.1007/s00345-007-0230-3. [DOI] [PubMed] [Google Scholar]
- 18. Chou R, Gore JL, Buckley D, et al. Urinary biomarkers for diagnosis of bladder cancer: a systematic review and meta‐analysis. Ann Intern Med. 2015;163:922‐931. 10.7326/m15-0997. [DOI] [PubMed] [Google Scholar]
- 19. Yafi FA, Brimo F, Steinberg J, Aprikian AG, Tanguay S, Kassouf W. Prospective analysis of sensitivity and specificity of urinary cytology and other urinary biomarkers for bladder cancer. Urol Oncol. 2015;33(66):e25‐e31. 10.1016/j.urolonc.2014.06.008. [DOI] [PubMed] [Google Scholar]
- 20. Todenhöfer T, Struss WJ, Seiler R, Wyatt AW, Black PC. Liquid biopsy‐analysis of circulating tumor DNA (ctDNA) in bladder cancer. Bladder Cancer. 2018;4:19‐29. 10.3233/blc-170140. [DOI] [PMC free article] [PubMed] [Google Scholar]
- 21. Christensen E, Birkenkamp‐Demtröder K, Nordentoft I, et al. Liquid biopsy analysis of FGFR3 and PIK3CA hotspot mutations for disease surveillance in bladder cancer. Eur Urol. 2017;71:961‐969. 10.1016/j.eururo.2016.12.016. [DOI] [PubMed] [Google Scholar]
- 22. Juracek J, Peltanova B, Dolezel J, et al. Genome‐wide identification of urinary cell‐free microRNAs for non‐invasive detection of bladder cancer. J Cell Mol Med. 2018;22:2033‐2038. 10.1111/jcmm.13487. [DOI] [PMC free article] [PubMed] [Google Scholar]
- 23. Yasui T, Yanagida T, Ito S, et al. Unveiling massive numbers of cancer‐related urinary‐microRNA candidates via nanowires. Sci Adv. 2017;3:e1701133 10.1126/sciadv.1701133. [DOI] [PMC free article] [PubMed] [Google Scholar]
- 24. Raab SS, Slagel DD, Jensen CS, et al. Low‐grade transitional cell carcinoma of the urinary bladder: application of select cytologic criteria to improve diagnostic accuracy [corrected]. Mod Pathol. 1996;9(3):225‐232. Erratum in: Mod Pathol 1996 Jul;9(7):803. [PubMed] [Google Scholar]
- 25. Navarro‐Quiroz E, Pacheco‐Lugo L, Navarro‐Quiroz R, et al. Profiling analysis of circulating microRNA in peripheral blood of patients with class IV lupus nephritis. PLoS One. 2017;12:e0187973 10.1371/journal.pone.0187973. [DOI] [PMC free article] [PubMed] [Google Scholar]
- 26. Yoo JK, Kim J, Choi SJ, et al. Discovery and characterization of novel microRNAs during endothelial differentiation of human embryonic stem cells. Stem Cells Dev. 2012;21:2049‐2057. 10.1089/scd.2011.0500. [DOI] [PMC free article] [PubMed] [Google Scholar]
- 27. Moreau MP, Bruse SE, David‐Rus R, Buyske S, Brzustowicz LM. Altered microRNA expression profiles in postmortem brain samples from individuals with schizophrenia and bipolar disorder. Biol Psychiatry. 2011;69:188‐193. 10.1016/j.biopsych.2010.09.039. [DOI] [PMC free article] [PubMed] [Google Scholar]
- 28. Sourvinou IS, Markou A, Lianidou ES. Quantification of circulating miRNAs in plasma: effect of preanalytical and analytical parameters on their isolation and stability. J Mol Diagn. 2013;15:827‐834. 10.1016/j.jmoldx.2013.07.005. [DOI] [PubMed] [Google Scholar]
Associated Data
This section collects any data citations, data availability statements, or supplementary materials included in this article.
Supplementary Materials