

Abstract
Chordomas are rare bone tumors with a poor prognosis and no approved targeted therapy. Y‐box binding protein‐1 (YBX1) promotes tumor growth, invasion and drug resistance. However, the role of YBX1 in chordoma is unclear. In this study, we examined the expression of YBX1 using immunohistochemistry and found that YBX1 was significantly upregulated in 32 chordoma tissues compared to distant normal tissues. In addition, YBX1 upregulation was associated with surrounding tissue invasion, recurrence and poor prognosis. Biological function studies demonstrated that YBX1 promoted cell proliferation and invasion, accelerated G1/S phase transition, and inhibited apoptosis. Further investigation revealed that YBX1 enhanced epidermal growth factor receptor (EGFR) transcription by directly binding to its promoter in chordoma cells. YBX1 regulated protein expression of p‐EGFR, p‐AKT and its downstream target genes that influenced cell apoptosis, cell cycle transition and cell invasion. YBX1 activated the EGFR/AKT pathway in chordoma and YBX1‐induced elevated expression of key molecules in the EGFR/AKT pathway were downregulated by EGFR and AKT pathway inhibitors. These in vitro results were further confirmed by in vivo data. These data showed that YBX1 promoted tumorigenesis and progression in spinal chordoma via the EGFR/AKT pathway. YBX1 might serve as a prognostic and predictive biomarker, as well as a rational therapeutic target, for chordoma.
Keywords: AKT, chordoma, EGFR, tumorigenesis, YBX1
1. INTRODUCTION
Chordoma is an uncommon malignant bone tumor of the axial skeleton; it is assumed to originate from residual embryonic notochord and accounts for approximately 1%‐4% of all skeletal tumors.1 Chordomas are chemoresistant and relatively radioresistant.2, 3, 4 Unfortunately, more than 40% of patients present with local recurrence, and metastases occur in 40%‐60% of patients during follow‐up. There is currently no standard medical therapy for chordoma.5, 6 Although various biomarkers in chordoma have been identified in recent years, the underlying molecular mechanisms regulating tumorgenesis and progression of chordoma are not fully understood. To enhance our understanding of chordoma and improve the overall prognosis of patients with chordoma, there is an urgent need to identify novel effective biomarkers and to develop new therapeutic strategies.
Y‐box binding protein‐1 (YBX1), encoded by the YBX1 gene, is a member of the cold‐shock protein superfamily and participates in a wide variety of cellular processes.7 Many studies have indicated that YBX1 expression is significantly elevated and correlates with poor outcome and recurrence in common tumor types, such as pancreatic cancer and melanoma.8, 9 In addition, YBX1 regulates tumor cell proliferation, apoptosis, invasion, migration and chemoresistance through the related pathways.10 Multiple key molecules that interact with YBX1 have been shown to be overexpressed in chordoma and contribute to chordoma development, such as hypoxia inducible factor 1 alpha subunit (HIF‐1α), a mechanistic target of rapamycin kinase (mTOR) and RB transcriptional corepressor 1 (RB).6, 11, 12, 13, 14
Receptor tyrosine kinases (RTK) have been proved to participate in the tumorigenesis and development of chordoma. The epidermal growth factor receptor (EGFR) is the most significantly activated RTK in chordoma.15 Studies have indicated that EGFR inhibitors significantly reduce the tumor growth and invasion ability of chordoma in vitro and vivo.16, 17 Numerous studies have shown that YBX1 enhances EGFR expression and activates EGFR‐mediated pathways, promoting the aggressive malignant phenotypes in multiple tumors.18, 19 However, to our knowledge, the functional role and regulatory mechanism of YBX1 in chordoma have not been investigated. Based on the theoretical evidence mentioned above, we hypothesized that YBX1 is involved in the tumorigenesis and progression of chordoma through EGFR‐mediated pathways.
In this study, we examined the expression, biological functions and molecular mechanisms of YBX1 in chordoma. Our results showed that YBX1 promoted tumorigenesis and the progression of chordoma via the EGFR/AKT pathway, suggesting that YBX1 could be a prognostic biomarker and a promising therapeutic target for chordoma.
2. MATERIALS AND METHODS
2.1. Patients and tumor tissues
All cases of spinal chordoma diagnosed at Peking University Third Hospital between 2008 and 2016 were considered for enrolment. A total of 32 patients (20 men and 12 women) who had no preoperative treatment were included in the study, with an average age of 50.3 years (range, 11‐70 years). All patients underwent surgery at our department. Nineteen distant normal tissues obtained at least 3 cm from the surgical margins were collected as controls. The average follow‐up period was 52.9 months (range, 5‐121 months). We retrospectively reviewed clinicopathological characteristics, including age, sex, tumor location, tumor size, surrounding muscle invasion, recurrence, length of follow‐up and disease status. The present study was conducted with the approval of the Ethics Committee of the Peking University Third Hospital Institutional Review Board (No. IRB00006761‐2016048). Written informed consent was obtained from all patients whose specimens and clinical information were used for this study.
2.2. Immunohistochemistry
Immunohistochemical examination of YBX1 expression in tissue samples was performed as described previously.20 Primary antibody (anti‐YBX1 antibody, Cat. No. ab76149, 1:200 dilution, Abcam, Cambridge, MA, USA) was incubated at 4°C overnight.
The percentage of positive cells was graded as follows: 0 (none); 1 (<25%); 2 (26%‐50%); 3 (50%‐75%); and 4 (>75%). The intensity of immunoreactivity was graded as follows: 0 (no reaction); 1 (weak); 2 (moderate); and 3 (strong). The final score was the product of these 2 indices and ranged from 0 to 12. As the mean IRS was 7.6, samples with IRS ≤6 and IRS ≥8 were classified as low and high YBX1 expression, respectively.
Immunohistochemical staining of phospho‐EGFR and phospho‐Akt expression in tissue samples were also performed using primary antibodies (anti‐phospho‐EGFR antibody, Cat. No. 3777, 1:200 dilution, anti‐phospho‐Akt antibody, Cat. No. 4060, 1:100 dilution, Cell Signal Technology, Danvers, MA, USA). The score was applied as mentioned above to make classifications of low and high expression, respectively.
2.3. Chordoma cell lines and cell culture
Human chordoma cell lines U‐CH1 (CRL‐3217) and MUG‐Chor1 (CRL‐3219) were purchased from American Type Culture Collection (Manassas, VA, USA) and were cultivated in Iscove's modified Dulbecco's medium (IMDM) and RPMI medium (HyClone, Logan, UT, USA) at a ratio of 4:1 supplemented with 10% FBS (Gibco, Grand Island, NY, USA), 2 mmol/L L‐glutamine (HyClone), 100 U/mL penicillin and 100 μg/mL streptomycin (PS, HyClone) at 37°C in a humidified atmosphere of 95% air and 5% CO2. Culture flasks were coated with rat tail type I collagen (Corning, Bedford, MA, USA) prior to use.
2.4. Lentivirus packaging and infection
To knockdown the endogenous YBX1 gene, shRNA targeting YBX1 was synthesized and cloned into the pLL3.7‐U6‐EGFP lentivirus vector (Addgene, Watertown, MA, USA). A scrambled plasmid was used as a negative control.
For YBX1 gene overexpression, the full length CDS of the YBX1 gene was cloned into the pHIV‐EGFP‐lentivirus vector and an empty plasmid was used as a control. The knockdown and overexpression effects of YBX1 were detected by western blot (WB).
The lentivirus overexpressing YBX1 and the control lentivirus were termed YBX1 HA and Ctrl HA, respectively. The lentiviruses expressing YBX1 shRNA1, YBX1 shRNA2 and the control lentivirus were termed YBX1 shRNA1, YBX1 shRNA2 and shRNA Ctrl, respectively.
2.5. Nucleus pulposus cell isolation and culture
Human intervertebral disc nucleus pulposus tissues were collected from patients with lumbar disc herniation or lumbar spinal stenosis. The tissues were rinsed 3 times with sterile PBS with 1% penicillin‐streptomycin to remove any residual blood and minced into small fragments of approximately 1 mm3. Then, the cells were isolated by digestion with .25% trypsin (BI, Cromwell, CT, USA) and .1% type II collagenase (Gibco) for 2 hours at 37°C. The isolated cells were seeded in DMEM‐F12 culture medium (HyClone) with 10% FBS and 1% PS. After the primary cells adhered, the culture media was replaced every 3 days. The NP cells were passaged when the cells were approximately 80%‐90% confluent.
2.6. Real‐time quantitative PCR
Total RNA was isolated using TRIzol Reagent (Invitrogen). cDNA was generated using a First‐Strand cDNA Synthesis Kit (KR116, Tiangen, Beijing, China). Real‐time quantitative PCR (RT‐qPCR) was performed using a commercial SYBR Green RT‐PCR Kit (FP209, Tiangen) according to the manufacturer's instructions. The primers for RT‐qPCR were listed in Table 1. mRNA expression was calculated using the 2−ΔΔCt method. GAPDH expression was used as control. All reactions were repeated in triplicate.
Table 1.
ShRNA and primer sequences used in the present study
| Gene | Sequences (5′‐3′) | |
|---|---|---|
| shRNA1 | YBX1 | CCACGCAATTACCAGCAAA |
| shRNA2 | YBX1 | AGAAGGTCATCGCAACGAA |
| RT‐qPCR primer | YBX1 | F: GACCGACCAGACTCTCATCC |
| YBX1 | R: TCACCAACCTCCATGTTCCT | |
| GAPDH | F: GGTGGTCTCCTCTGACTTCAACA | |
| GAPDH | R: GTTGCTGTAGCCAAATTCGTTGC | |
| ChIP‐qPCR primer1 | EGFR | F: TCCCATTTGCCTTTCTCTAGTTTTGTTTTC |
| EGFR | R: GTCCACCCCATCCCCACTGTTCCTTCTC | |
| ChIP‐qPCR primer2 | EGFR | F: GTGGGACACTTAGCCTCTCTAAAAG |
| EGFR | R: AGGCCTCCTTAATGTTTATTGCAAC | |
| ChIP‐qPCR primer3 | EGFR | F: AGGAAAAGAAAGTTTGCCAAGGCAC |
| EGFR | R:AGCCACCTCCTGGATGGTCTTTAAG | |
| ChIP‐qPCR primer4 | EGFR | F: GATGCAAATAAAACCGGACTGAAGG |
| EGFR | R:GGTTCTGGAAGTCCATCGACATGTT |
2.7. Western blot analysis
Total proteins were extracted by RIPA lysis buffer containing 1% protease inhibitors (PMSF, Beyotime Institute of Biotechnology, Cat. No. ST506) and 1% phosphatase inhibitors (Applygen Technology, Cat. No. P1260) at 4°C. Nuclear protein was extracted using NE‐PER Nuclear and Cytoplasmic Extraction Reagents (Cat. No. 78833, Thermo Fisher Scientific MA, USA). Then, 30 μg of denatured proteins were electrophoresed in 10% SDS‐PAGE Gels (Invitrogen) and transferred to nitrocellulose membranes. The information regarding primary antibodies is listed in Table S1.
2.8. Cell Counting Kit‐8 assay
U‐CH1 and MUG‐Chor1 cells were seeded into 96‐well plates at a final density of 5 × 10³ cells per well (100 μL of medium per well) and incubated for 1, 4 and 7 days. At each time point, 10 μL of Cell Counting Kit‐8 (CCK‐8) reagent (Dojindo Laboratories, Kumamoto, Japan) was added to each well and incubated for 3 hours. The absorption at 450 nm was determined for each sample.
2.9. Colony formation assay
U‐CH1 and MUG‐Chor1 cells were seeded into 12‐well plates at 3 × 10² cells per well. Then, the cells were cultured with complete growth medium, which was refreshed every 2 days. After incubation for 2 weeks, the colonies were fixed with 4% paraformaldehyde and stained with .5% crystal violet. The number of colonies with at least 50 cells in each well was counted under an inverted microscope (Leica, Frankfurt, Germany).
2.10. Transwell invasion assay
Cell invasion assays were performed in Boyden chambers containing polycarbonate filters with a pore size of 8 μm and coated with a Matrigel (BD Biosciences, Franklin Lakes, NJ). U‐CH1 and MUG‐Chor1 cells were starved in serum‐free medium for 24 hours and then re‐suspended in serum‐free medium. Then, 5 × 10³ cells per well were added to the upper chamber pre‐coated with Matrigel, while the bottom chambers were filled with 500 μL of complete culture medium with 10% FBS. After incubation for 48 hours, the invaded cells were fixed with 75% ethanol, stained with crystal violet, and counted using light microscopy.
2.11. Annexin V‐FITC/PI apoptosis assay
Cell apoptosis was detected by flow cytometry using an Annexin V‐FITC/PI apoptosis detection kit (BD, USA). After incubation for 48 hours, 1 × 10⁶ cells were re‐suspended in 300 μL of 1× binding buffer. A total of 5 μL of Annexin V‐FITC and 5 μL of propidium iodide (PI) were added to the samples, and the cells were vortexed and incubated for 30 minutes at 4°C in the dark according to the manufacturer's protocol. The fluorescence intensity analysis of the cells was immediately conducted by flow cytometry (Cytoflex; Beckman Coulter, USA).
2.12. Cell cycle analysis
For cell cycle analysis, the collected cells were fixed in ice‐cold 70% ethanol for 1 hour and re‐suspended in PBS with .1% BSA. Then, the fixed cells were stained with PI (20 μg/mL) containing RNase (1 μg/mL) for 20 min in the dark. The cells were run on a FACSCalibur flow cytometer (Cytoflex; Beckman Coulter, USA). The data were analyzed using CELL Quest software (BD Biosciences).
2.13. ChIP
U‐CH1 and MUG‐Chor1 cells were plated at a density of 1 × 10⁷ in a 150‐mm dish for 48 hours. The binding ability of YBX1 on the EGFR promoter was evaluated by ChIP assays followed by real‐time qPCR (ChIP‐qPCR). ChIP assays were performed using a ChIP assay kit (Simple ChIP Plus Enzymatic Chromatin IP Kit, #9005, CST) according to the manufacturer's protocol. Chip qPCR primer 1,2 targeted region of EGFR promoter. Primer 3,4 targeting 2 pairs of primers located in the CDS region were used as negative control. The primer sequences are listed in Table 1.
2.14. Dual luciferase reporter assays
U‐CH1 and MUG‐Chor1 cells were co‐transfected with firefly luciferase reporter plasmid containing the EGFR promoter (GeneChem, Shanghai, China) and an expression plasmid encoding HA‐YBX1, together with pRL‐TK (Renilla) control plasmid, using Lipofectamine 2000 (Invitrogen). Luciferase activity was measured using the Dual‐Luciferase Reporter Kit (Promega). For data analysis, the luciferase activity was measured relative to Renilla to standardize the background signal.
2.15. Subcutaneous xenograft model
NOD/SCID/IL2Rγnull (NOG) mouse (4‐week‐old, male, 20 g) were purchased from Beijing Vital River Laboratory Animal Technology (Beijing, China). U‐CH1 cells (5 × 10⁶ cells in 200 μL were mixed 1:1 with PBS and Matrigel, Corning 354238) that stably expressed YBX1 and the control lentiviral vector (Ctrl HA, YBX1 HA, YBX1 shRNA and shRNA Ctrl) were subcutaneously injected into the right flank of mice. Once palpable, the tumor was measured weekly with a digital calliper. Tumor volume was calculated using the following formula: volume = (a × b 2)/2, where a is the widest diameter of the tumor and b is the diameter perpendicular to a. Eight weeks after injection, mice were killed. Subcutaneous tumors were excised from each mouse, with a portion immediately frozen for proteomic analysis and a portion placed in 4% paraformaldehyde for histopathological analysis. Animal experiments were performed in accordance with the policies and principles of laboratory animal care of the Peking University of Medicine Animal Care and Use Committee.
2.16. Immunofluorescence microscopy
For immunofluorescence analysis, monolayers of cells were grown on a confocal dish (NEST, Guangzhou, China). The cells were fixed in 4% paraformaldehyde for 15 minutes and permeabilized with PBS containing .5% TritonX‐100. Blocking was performed with 5% BSA, and the cells were subsequently incubated overnight at 4°C with primary antibody (1:100, ab76149, abcam). FITC‐conjugated rabbit anti‐goat IgG (1:500, ab150079, abcam) was used as the secondary antibody. The cell nuclei were counterstained with 10 μg/mL 4′,6‑Diamidino‑2‑phenylindole (DAPI) solution (C0065, Solarbio, Beijing, China). Images were obtained and analyzed using a confocal microscope (TCS‐SP8, Leica, Wetzlar, Germany).
2.17. Statistical analysis
All statistical analyses were performed using SPSS software 22.0 (IBM, Armonk, NY, USA). Continuous data were presented as mean ± SD. A 2‐tailed unpaired Student's test was used to assess the statistical significance of independent data. For multiple comparisons, a one‐way ANOVA analysis was used. The associations between YBX1 expression and clinicopathological characteristics were evaluated using the Fisher exact probability test. Kaplan‐Meier statistics, log‐rank tests and the Cox proportional hazards regression model were used to examine the relationship between YBX1 expression and patients’ survival rate. A P‐value of <.05 based on 2‐tailed tests was considered significant.
3. RESULTS
3.1. YBX1 is overexpressed in spinal chordoma tissues and cells
Immunohistochemical results demonstrated that YBX1 was mainly localized in the cytoplasm with a few cells showing localization in the nucleus. Compared with distant normal tissues, YBX1 expression was significantly elevated in chordoma samples (P < .001) (Table 2, Figure 1A,B). YBX1 and p‐YBX1 expression in chordoma tissues and cells compared with corresponding controls was also detected using RT‐qPCR and western blot (Figure 1C‐F, S1). YBX1 was localized in both nucleus and cytoplasm in U‐CH1 cell line examined by immunofluorescence microscopy (Figure S2). In addition, immunohistochemical staining showed that tumor cells exhibited positive staining for p‐EGFR and p‐Akt. YBX1 expression was correlated to p‐EGFR and p‐Akt expression in chordoma (Figure S2, Table S2). Our results showed that YBX1 and p‐YBX1 expression was significantly upregulated in chordoma tissues and cells.
Table 2.
Expression of YBX1 in chordoma tissues and distant normal tissues
| Tissue samples | Number | YBX1 expression | P‐value | |
|---|---|---|---|---|
| High (n) | Low (n) | |||
| Chordoma tissues | 32 | 20 | 12 | <.001 |
| Distant normal tissues | 19 | 2 | 17 | |
Figure 1.
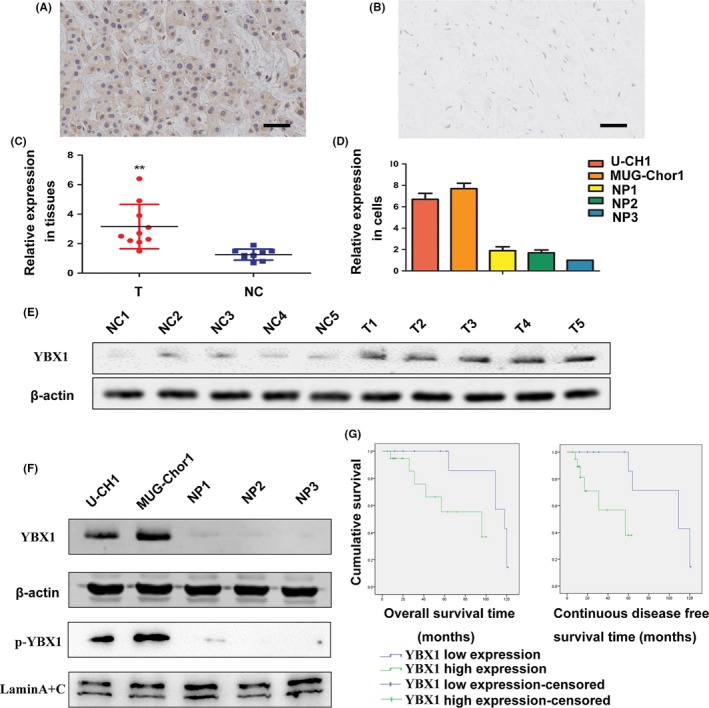
Expression of YBX1 in chordoma and association of YBX1 expression with the prognosis of patients. A, Immunohistochemistry staining of YBX1 in chordoma tissues. B, Distant normal control tissues; bar scale = 50 μm. C, D, Real‐time quantitative PCR (RT‐qPCR) analysis of YBX1 expression in tissues and cell lines. **P < .01. NC, normal control tissues group; NP, nucleus pulposus cell group; T, tumor group. E, F, Western blot analysis of YBX1 and p‐YBX1 expression in tissues and cell lines. G, Kaplan‐Meier survival analysis of overall survival rate and continuous disease‐free survival rate
3.2. YBX1 overexpression is associated with surrounding tissue invasion, recurrence and poor prognosis
Based on the immunohistochemical analysis, the samples were classified into 2 staining groups: low expression (YBX1 score ≤6, n = 12) and high expression (YBX1 score ≥8, n = 20) group. Fisher exact probability test analysis indicated that high YBX1 expression was not significantly associated with patient age (P = .726), sex (P = 1.000), tumor location (P = .726) or tumor size (P = .647). In samples from patients that presented surrounding tissue invasion, 16 of 20 (80.0%) exhibited YBX1 positivity, while in samples from patients without surrounding invasion, the percentage was 33.3% (4/12); this difference was significant (P = .021). During follow up, 18 patients experienced local recurrence, and the median recurrence time was 29.3 ± 21.7 months. Among the samples with high YBX1 expression, 15 of 20 patients (75.0%) developed recurrence, whereas in samples with low YBX1 expression, only 3 of 12 patients (25.0%) experienced recurrence; this difference was significant (P = .010) (Table 3). To investigate the prognostic significance of YBX1 expression, Kaplan‐Meier survival analysis and multivariate Cox proportional hazard models were performed. High YBX1 expression was significantly associated with poor overall survival (OS) and continuous disease‐free survival (CDFS) (log‐lank test, P = .03 for OS, P = .017 for CDFS; Figure 1G, Table S3). Multivariate Cox regression analysis revealed that YBX1 expression was an independent prognostic marker for OS in patients with chordoma (P = .034, HR = 6.796, 95% CI 1.157‐39.934; Table S4).
Table 3.
Association of YBX1 expression with clinical characteristics in chordomas
| Characteristics | Number | YBX1 expression | P‐value | |
|---|---|---|---|---|
| High (n) | Low (n) | |||
| Age (years) | ||||
| <50 | 15 | 10 | 5 | .726 |
| ≥50 | 17 | 10 | 7 | |
| Gender | ||||
| Male | 24 | 15 | 9 | 1.000 |
| Female | 8 | 5 | 3 | |
| Tumor location | ||||
| Cervical | 17 | 10 | 7 | .726 |
| Sacrococcygeal | 15 | 10 | 5 | |
| Tumor size (mm) | ||||
| <90 | 26 | 17 | 9 | .647 |
| ≥90 | 6 | 3 | 3 | |
| Surrounding tissue invasion | ||||
| Yes | 20 | 16 | 4 | .021* |
| No | 12 | 4 | 8 | |
| Recurrence | ||||
| Yes | 18 | 15 | 3 | .010* |
| No | 14 | 5 | 9 | |
*p < 0.05
3.3. YBX1 promotes chordoma cell proliferation
To investigate the functional role of YBX1 in cellular proliferation in chordoma, we constructed YBX1 overexpression and knockdown systems by transfecting both cell lines with pHIV‐EGFP‐YBX1 and pLL3.7‐U6‐shRNA‐YBX1. The overexpression and downregulated expression of YBX1 and p‐YBX1 were confirmed by western blot in both U‐CH1 and MUG‐Chor1 cells (Figure 2A).
Figure 2.

YBX1 promotes chordoma cell proliferation. A, The overexpression and knockdown of YBX1 and p‐YBX1 in chordoma cell lines as identified by western blot. B, Cell Counting Kit‐8 (CCK‐8) showing YBX1‐promoted cell proliferation, n = 3, mean ± SD. *P < .05, **P < .01, ***P < .001. C, D, Representative images and numbers of colony formation assay showing YBX1‐promoted cell proliferation, n = 3, mean ± SD. **P < .01, ***P < .001
After culturing with pLL3.7‐U6‐shRNA‐YBX1 for 4 and 7 days, cell viability was inhibited in both U‐CH1 and MUG‐Chor1 cell lines. The proliferation of U‐CH1 and MUG‐Chor1 cells harboring YBX1 shRNA1 and YBX1 shRNA2 was remarkably decreased at 4 days and 7 days. The proliferation of U‐CH1 and MUG‐Chor1 cells harboring YBX1‐HA was remarkably increased at 4 and 7 days (Figure 2B).
The results of the colony formation assay also showed that YBX1 promoted cell proliferation in chordoma. The number of colonies formed in the 2 YBX1‐knockdown groups was lower than that in the corresponding control group. The number of colonies was significantly higher in the YBX1‐overexpression groups than in the corresponding control groups (Figure 2C,D).
3.4. YBX1 enhances chordoma cell invasion
The results of transwell invasion chamber assays showed that the invasive ability of both cell lines was markedly reduced by YBX1 knockdown and enhanced by YBX1 overexpression compared with that of the control group (Figure 3A). The number of cells in the substratum of the membrane per view under high magnification (200×) in the control group was significantly greater compared with the YBX1‐knockdown groups of U‐CH1 and MUG‐Chor1 cells. The number of U‐CH1 and MUG‐Chor1 cells in the substratum of the membrane in the YBX1‐overexpression group was significantly greater than that in the control group (Figure 3B).
Figure 3.
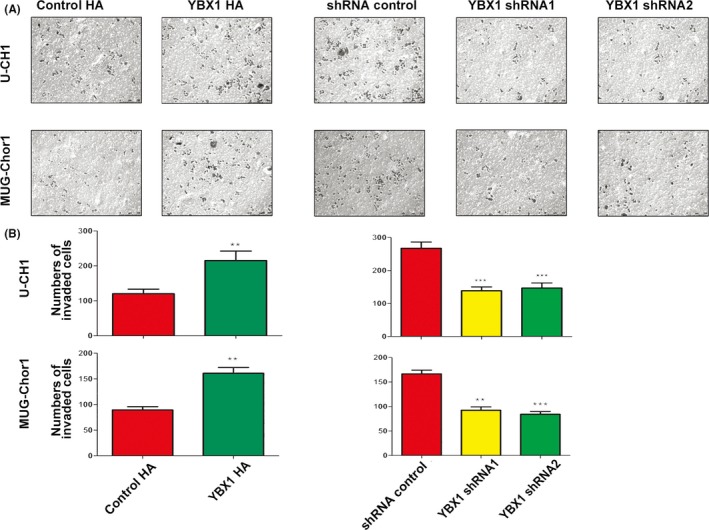
YBX1 promotes cell invasion. A, B, Upregulation of YBX1 promoted cell invasion. Representative images of transwell invasion assays and the numbers of invaded cells, n = 3, mean ± SD. **P < .01, ***P < .001
3.5. YBX1 knockdown induces apoptosis of chordoma cells
The apoptosis rate in the control group was higher compared with that in the YBX1‐overexpression group of U‐CH1 cells and MUG‐Chor1 (Figure 4A,B). The apoptosis rate in the control group was lower compared with that in the YBX1‐knockdown group of U‐CH1 and MUG‐Chor1 cells (Figure 4C,D).
Figure 4.
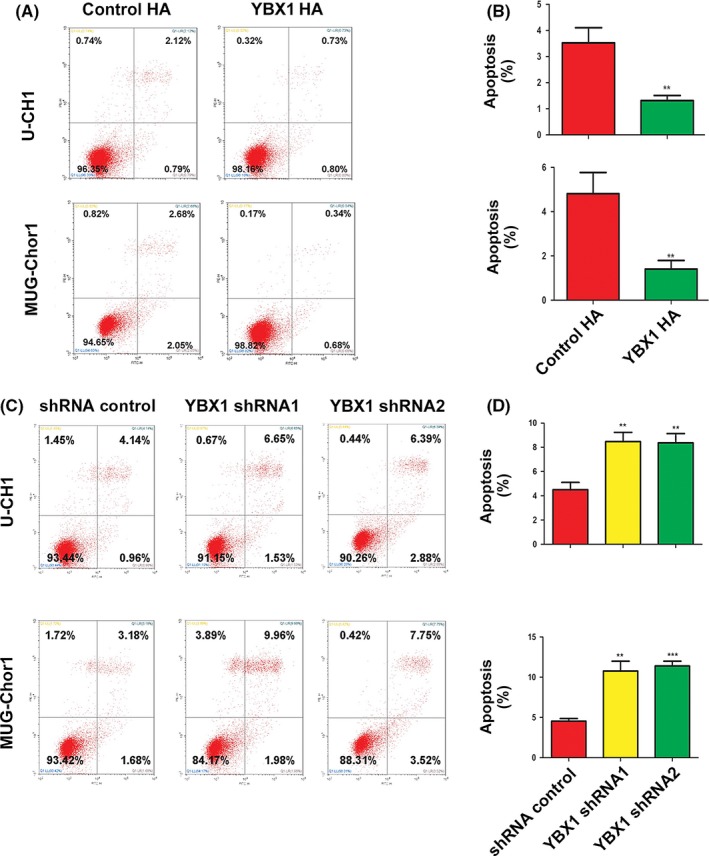
YBX1 inhibits cell apoptosis. A, B, YBX1 overexpression: pictures of cell apoptosis detected by flow cytometry. The results of statistical analysis of total apoptosis rate, n = 3, mean ± SD. **P < .01. C, D, YBX1 knockdown: Pictures of cell apoptosis detected by flow cytometry and the results of statistical analysis of total apoptosis rate, n = 3, mean ± SD. *P < .05, **P < .01, ***P < .001
3.6. YBX1 knockdown induces cycle arrest in chordoma cells
YBX1 knockdown in both chordoma cell lines markedly increased the proportion of cells in G0/G1 phase and decreased cell proportion in S phase. Compared with the shRNA‐Ctrl group, the proportion of cells in G0/G1 phase increased significantly in U‐CH1 and MUG‐Chor1 cells harboring YBX1‐shRNA. Furthermore, YBX1 knockdown caused a marked decrease in the proportion of cells in S phase in both cell lines. These results indicate that the loss of YBX1 results in G1/S arrest (Figure 5A,B).
Figure 5.
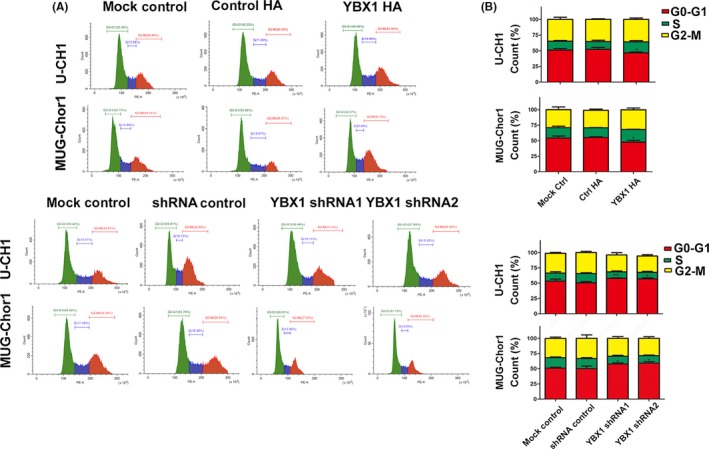
YBX1 knockdown induces G1/S arrest. A, Representative results of flow cytometric analysis of cell cycle. B, Alterations in cell cycle phases and their distributions, n = 3, mean ± SD. *P < .05, **P < .01
There was an increase in the proportion of cells in S phase and a decrease in the proportion of cells in G0/G1 phases in the YBX1‐overexpression groups compared with that in the Ctrl‐HA groups in both cell lines. These data suggest that YBX1 overexpression accelerates the G1/S transition.
3.7. YBX1 binds to the enhanced epidermal growth factor receptor promoter to enhance transcription in chordoma cells
Enhanced epidermal growth factor receptor is frequently the most significantly activated RTK in chordomas. Based on the observation that YBX1 binds to the EGFR promoter in breast cancer, we investigated whether YBX1 positively regulates EGFR promoter activity in chordoma. We determined that YBX1 was able to stimulate EGFR promoter activity using a luciferase reporter construct. EGFR luciferase promoter activity in cells co‐transfected with the YBX1 expression vector was significantly higher than that with empty vector. The promoter activity correlates positively with the concentration of YBX1 expression vector in both U‐CH1 and MUG‐Chor1 cells (Figure S3).
Next, we performed ChIP assays to determine whether YBX1 directly binds the EGFR promoter in chordoma cells. The YBX1 antibody effectively immunoprecipitated the DNA amplified by the EGFR primer compared with the immunoglobulin (IgG) controls (Figure S3). These results suggest that YBX1 regulates EGFR transcription by binding to the region of its promoter.
3.8. YBX1 is involved in the EGFR/AKT pathway in chordoma
As YBX1 transactives EGFR in chordoma, we furthermore confirmed that YBX1 could activate the EGFR pathway in chordoma. We examined EGFR, p‐EGFR expression in chordoma cells with YBX1 overexpression. Western blot results showed that YBX1 overexpression increased p‐EGFR protein levels in U‐CH1 cells. We also examined the status of the EGFR/AKT pathway downstream target genes that influence cell apoptosis, invasion and cell cycle transition. Upregulation of YBX1 led to decreased expression of pro‐apoptotic protein (P53 and Bax) and increased expression of anti‐apoptotic protein Bcl‐2. YBX1 increased the expression of cyclin D1 and cyclin E1, while decreasing the expression of p16. To confirm the activating effect of YBX1 on the EGFR/AKT pathway, we investigated whether EGFR/AKT inhibitors could suppress the elevated expression of key molecules by YBX1. We found that elevated p‐EGFR, c‐Myc and P53 protein levels as a result of YBX1 overexpression in U‐CH1 cells decreased with the administration of EGFR inhibitors (afatinib or erlotinib HCI). With Rapamycin and PKI‐587 treatment (AKT and mTOR inhibitors), the protein levels of p‐AKT and p‐S6 were also decreased. (Figure 6A‐C).
Figure 6.
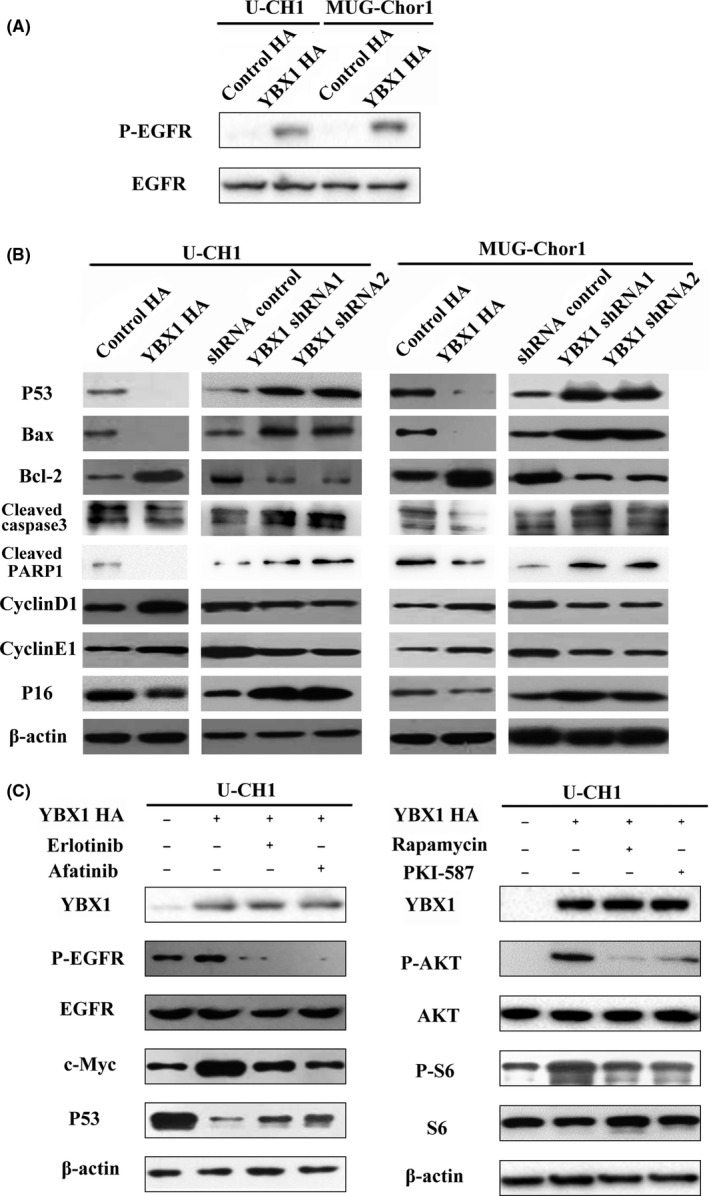
YBX1 activates the EGFR/AKT pathway. A, EGFR pathway‐related protein alterations in chordoma cell lines after YBX1 overexpression and EGFR/AKT pathway inhibitors. B, C, Apoptosis‐related protein and cell cycle‐related proteins after YBX1 overexpression and knockdown
3.9. YBX1 promotes chordoma tumor growth in vivo
To evaluate the effects of YBX1 on chordoma growth in vivo, we established a xenograft model of U‐CH1 cells with different YBX1 expression vectors. Mice injected with YBX1 shRNA cells showed a significant increase in tumor development compared with those injected with the shRNA‐Ctrl cells after 7 and 8 weeks (P < .01). The tumors developed from the YBX1 HA cells were larger in size than those from the control cells (P < .01). Furthermore, YBX1 expression in dissected tumors was confirmed by immunohistochemistry and western blot. These data supported the role of YBX1 in promoting chordoma tumor growth (Figure 7).
Figure 7.
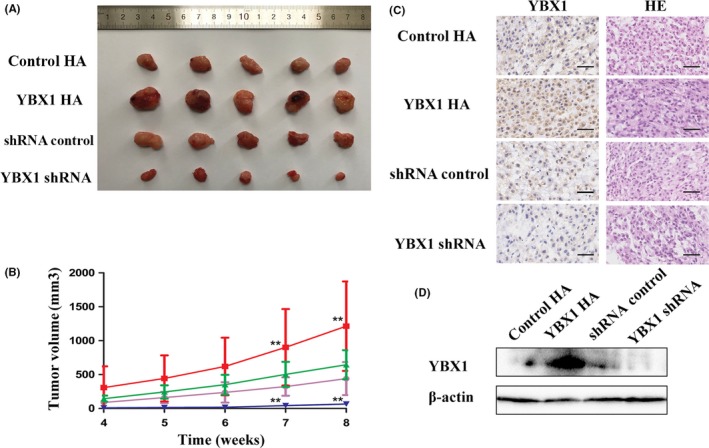
YBX1 promotes tumor growth in vivo. A, Dissected tumors. B, Tumor growth curves. C, Representative H&E staining and immunohistochemical pictures of YBX1 in dissected tumors, n = 5, mean ± SD. **P < .01. Scale bar: 50 mm. D, Expression of YBX1 in dissected tumors
4. DISCUSSION
Chordomas are characterized by remarkable local invasiveness and a high recurrence rate even after complete surgical resection of the primary tumor. To date, there are no effective therapeutic targets for chordoma, although several biomarkers have been identified. YBX1 has been widely reported to be a negative prognostic factor and plays prominent pro‐oncogenic roles in malignant transformation, cell proliferation, invasion, metastasis and drug resistance in various cancers.9, 21, 22, 23 Previous studies showed that YBX1 is detectable in the cytoplasm and/or the nucleus in various tumors. Nuclear YBX1 expression is closely associated with prognosis in patients with pancreatic cancer, uterine cervical cancer and diffuse large B‐cell lymphoma.8, 24, 25 El‐Naggar et al10 report strong cytoplasmic YBX1 staining in high‐risk sarcomas, such as malignant osteosarcoma, Ewing's sarcoma and rhabdomyosarcomas. Consistent with previous sarcoma study, our results showed that YBX1 were detected in the cytoplasm and nucleus in chordoma samples and cell lines. The existence of cytoplasm‐nucleus translocation of YBX1 in chordoma could make possible the intranuclear function of YBX1. YBX1 expression was significantly higher in chordoma tissues than in normal tissues. In our study, YBX1 upregulation correlated with surrounding tissue invasion and recurrence of chordoma. Kaplan‐Meier analysis and log‐rank tests indicated that the CDFS and OS in patients with high YBX1 expression were substantially shorter than in those with low YBX1 expression. Multivariate Cox regression analysis showed that YBX1 was an independent prognostic marker for OS in patients with chordoma. The data suggested that cytoplasmic YBX1 expression could be a useful novel biomarker in chordoma.
Numerous studies have strongly suggested that YBX1 is an oncogene and is involved in the proliferation and malignant phenotype of tumors. Cell growth is strictly regulated and controlled by a careful balance of regulatory systems. Abnormal cell growth is the critical feature of malignant tumors.9, 21, 25, 26, 27 In this study, we observed a significant suppression of cell proliferation of chordoma cell lines after YBX1 knockdown, consistent with previous studies. Cell cycle transition is the main factor influencing cell proliferation. Okada et al21 report that specific small interfering RNA to YBX1 induced G1/S arrest. Miao et al25 suggest that YBX1 could promote cell proliferation by accelerating the G1/S transition in diffuse large B‐cell lymphoma. Similarly, cell cycle analysis showed that there was delayed G1/S transition with YBX1 knockdown and accelerated G1/S transition with YBX1 overexpression in chordoma. In sum, YBX1 promoted cell growth and regulated cell cycle progression at G1/S in chordoma.
Apoptosis is programmed cell death, a vital haemostasis mechanism that maintains the cell population in tissues and prevents cancer development. The Bcl‐2 family of proteins regulate mitochondrial membrane permeability and have special significance in the process of apoptosis. Bcl‐2 is the representative of anti‐apoptotic proteins and Bax belongs to the pro‐apoptotic proteins. Tumor suppressor protein P53 regulates the repair of cellular DNA and its abnormal state correlates to apoptosis in cell process.28 Cleaved caspase 3 and cleaved PARP1 are common apoptosis markers. Lasham observed that YBX1 is a negative regulator of P53, protecting cells from P53‐mediated apoptosis.29 Manik reports that YBX1 knockdown induces apoptosis in multiple myeloma cells.30 In addition, Wang found that YBX1 overexpression also increased Bax, decreased Bcl‐2 expression, and induced apoptosis in vascular endothelial cells.31 In accordance with the previous studies above, our study showed that YBX1 was a negative regulator of apoptosis in chordoma.
Receptor tyrosine kinases are the key regulators of cellular processes and play an important role in tumor development and progression. As a cell‐surface receptor tyrosine kinase, EGFR transduces growth signals. Binding to epidermal growth factor (EGF) induces the autophosphorylation of EGFR, which, in turn, activates downstream pathways, including the MAPK‐ERK and PI3K‐AKT pathways. EGFR is frequently the most significantly activated RTK in chordoma.15 Abnormal activation of the EGFR‐mediated pathway is reported to promote tumor invasion ability and development of chordoma. Previous studies indicated that EGFR inhibitor markedly diminished EGFR phosphorylation in a dose‐dependent manner and suppressed proliferation of the chordoma in vitro and vivo.6, 16, 17 EGFR was transcriptionally induced by YBX1 in breast cancer and glioma.18, 19 In our study, immunohistochemical staining showed that YBX1 expression was correlated to p‐EGFR and p‐Akt expression in chordoma. These data supported the hypothesis that YBX1 was involved in chordoma development through the EGFR pathway. We observed that YBX1 promoted the transcriptional activation of EGFR promoter via a luciferase reporter system using chordoma cells. Furthermore, we performed ChIP assays that clearly revealed that YBX1 directly regulated EGFR transcription by binding to its promoter in chordoma cell lines. Indeed, we observed that YBX1 overexpression promoted the expression of p‐EGFR in chordoma cell lines.
As the major downstream pathway of EGFR, the AKT‐mediated pathway plays a critical role in tumorigenesis. Bin reports that YBX1 promotes epithelial‐mesenchymal transition via AKT activation in lung adenocarcinoma cells.32 Sinnberg suggests that YBX1 activation contributes to the increased activity of the PI3K/AKT pathway in melanoma cells.33 Consistent with previous studies, we found that YBX1 activated the AKT pathway in chordoma.
Furthermore, we examined target genes downstream of EGFR/AKT pathway that influenced cell cycle transition, cell apoptosis and cell invasion. In terms of cell cycle transition, the G1/S transition is principally controlled by the interplay of G1 cyclins and cyclin kinase inhibitors.34 G1 cyclins mainly include cyclin D1, cyclin E1 and cyclin A, facilitating cell cycle transition from the G1 phase to the S phase. P16 is recognized as an tumor suppressor gene encoding a specific inhibitor of cyclin‐dependent kinase, resulting in G1/S phase arrest. It has been reported that cyclinD1, cyclinE1 and p16 are governed by AKT‐mediated pathways in the regulation of cell cycle transition.35, 36 Thus, we evaluated the effects of YBX1 on the levels of cyclinD1, cyclinE1 and p16 in chordoma cell lines. YBX1 overexpression promoted the expression of cyclin D1 and cyclinE1, and decreased the expression of p16, accelerating G1/S transition.
P53, Bax and Bcl‐2 are considered as the main regulators in the process of apoptosis. Multiple studies have revealed that AKT activation promotes apoptosis through regulation of Bax and Bcl‐2.37, 38 Therefore, we investigated their levels in the chordoma after YBX1 overexpression and knockdown. YBX1 knockdown significantly decreased the level of P53 and Bax and increased the expression of Bcl‐2, cleaved caspase‐3 and cleaved PARP1. In addition, previous study illustrated that activation of S6 and c‐Myc promoted the proliferation, apoptosis and invasion properties of tumor cells.39, 40, 41, 42 In our study, the elevated expression of P53, c‐Myc and p‐S6 by YBX1 overexpression were downregulated by EGFR/AKT pathway inhibitors, confirming that YBX1 regulates the EGFR/AKT pathway in chordoma. Combining our findings with the previous results, YBX1 may promote the cell proliferation, invasion and inhibit apoptosis in chordoma through the EGFR/AKT pathway.
Although our findings reveal YBX1's role in tumorigenesis and progression in chordoma, this study still had several limitations. As YBX1 is a multifunctional protein, further studies should focus on other functions of YBX1 in chordoma. In addition, the study of regulatory mechanism of YBX1 in chordoma is inadequate. The YBX1 phosphorylation level and nucleocytoplasmic shuttling in chordoma should be researched in depth.
In summary, our results suggest that YBX1 acts as an oncogene, promoting tumorigenesis and progression via the EGFR/AKT pathway in spinal chordoma. Accordingly, we believe that YBX1 may serve as a clinically useful biomarker and a promising molecular target for chordoma.
CONFLICT OF INTEREST
The authors declare no conflict of interest.
Supporting information
ACKNOWLEDGMENTS
We are grateful to the Peking University Third Hospital Central Laboratory for technical guidance. We also appreciate the assistance of Dr Yansen Li from Peking University People's Hospital, Dr Shi Fei from Shanghai General Hospital, Dr Zhou Zifei from Shanghai Tenth People's Hospital and Dr Zhang Xiaxia from Beijing Tiantan Hospital in China.
Liang C, Ma Y, Yong L, et al. Y‐box binding protein‐1 promotes tumorigenesis and progression via the epidermal growth factor receptor/AKT pathway in spinal chordoma. Cancer Sci. 2019;110:166–179. 10.1111/cas.13875
Funding information
National Natural Science Foundation of China (Grant/Award Number: 81641103).
REFERENCES
- 1. Smoll NR, Gautschi OP, Radovanovic I, Schaller K, Weber DC. Incidence and relative survival of chordomas: the standardized mortality ratio and the impact of chordomas on a population. Cancer. 2013;119:2029‐2037. [DOI] [PubMed] [Google Scholar]
- 2. Housari G, Gonzalez M, Calero P, Beni R, Lobo E. Sacral chordoma: management of a rare disease in a tertiary hospital. Clin Transl Oncol. 2013;15:327‐330. [DOI] [PubMed] [Google Scholar]
- 3. York JE, Kaczaraj A, Abi‐Said D, et al. Sacral chordoma: 40‐year experience at a major cancer center. Neurosurgery. 1999;44:74‐79; discussion 9‐80. [DOI] [PubMed] [Google Scholar]
- 4. Rotondo RL, Folkert W, Liebsch NJ, et al. High‐dose proton‐based radiation therapy in the management of spine chordomas: outcomes and clinicopathological prognostic factors. J Neurosurg Spine. 2015;23:788‐797. [DOI] [PubMed] [Google Scholar]
- 5. Stacchiotti S, Sommer J. Building a global consensus approach to chordoma: a position paper from the medical and patient community. Lancet Oncol. 2015;16:e71‐e83. [DOI] [PubMed] [Google Scholar]
- 6. Scheipl S, Barnard M, Cottone L, et al. EGFR inhibitors identified as a potential treatment for chordoma in a focused compound screen. J Pathol. 2016;239:320‐334. [DOI] [PMC free article] [PubMed] [Google Scholar]
- 7. Kosnopfel C, Sinnberg T, Schittek B. Y‐box binding protein 1–a prognostic marker and target in tumour therapy. Eur J Cell Biol. 2014;93:61‐70. [DOI] [PubMed] [Google Scholar]
- 8. Shinkai K, Nakano K, Cui L, et al. Nuclear expression of Y‐box binding protein‐1 is associated with poor prognosis in patients with pancreatic cancer and its knockdown inhibits tumor growth and metastasis in mice tumor models. Int J Cancer. 2016;139:433‐445. [DOI] [PubMed] [Google Scholar]
- 9. Schittek B, Psenner K, Sauer B, Meier F, Iftner T, Garbe C. The increased expression of Y box‐binding protein 1 in melanoma stimulates proliferation and tumor invasion, antagonizes apoptosis and enhances chemoresistance. Int J Cancer 2007;120:2110‐2118. [DOI] [PubMed] [Google Scholar]
- 10. El‐Naggar AM, Veinotte CJ, Cheng H, et al. Translational activation of HIF1alpha by YB‐1 promotes sarcoma metastasis. Cancer Cell. 2015;27:682‐697. [DOI] [PubMed] [Google Scholar]
- 11. Akhavan‐Sigari R, Gaab MR, Rohde V, Abili M, Ostertag H. Expression of PDGFR‐alpha, EGFR and c‐MET in spinal chordoma: a series of 52 patients. Anticancer Res. 2014;34:623‐630. [PubMed] [Google Scholar]
- 12. Ji Z, Long H, Hu Y, et al. Expression of MDR1, HIF‐1alpha and MRP1 in sacral chordoma and chordoma cell line CM‐319. J Exp Clin Cancer Res. 2010;29:158. [DOI] [PMC free article] [PubMed] [Google Scholar]
- 13. Chen K, Mo J, Zhou M, et al. Expression of PTEN and mTOR in sacral chordoma and association with poor prognosis. Med Oncol. 2014;31:886. [DOI] [PubMed] [Google Scholar]
- 14. Liu JQ, Zhang QH, Wang ZL. Clinicopathological significance of p16, cyclin D1, Rb and MIB‐1 levels in skull base chordoma and chondrosarcoma. World J Otorhinolaryngol Head Neck Surg. 2015;1:50‐56. [DOI] [PMC free article] [PubMed] [Google Scholar]
- 15. Dewaele B, Maggiani F, Floris G, et al. Frequent activation of EGFR in advanced chordomas. Clin Sarcoma Res. 2011;1:4. [DOI] [PMC free article] [PubMed] [Google Scholar]
- 16. Shalaby A, Presneau N, Ye H, et al. The role of epidermal growth factor receptor in chordoma pathogenesis: a potential therapeutic target. J Pathol. 2011;223:336‐346. [DOI] [PubMed] [Google Scholar]
- 17. Siu IM, Ruzevick J, Zhao Q, et al. Erlotinib inhibits growth of a patient‐derived chordoma xenograft. PLoS ONE. 2013;8:e78895. [DOI] [PMC free article] [PubMed] [Google Scholar]
- 18. Stratford AL, Habibi G, Astanehe A, et al. Epidermal growth factor receptor (EGFR) is transcriptionally induced by the Y‐box binding protein‐1 (YB‐1) and can be inhibited with Iressa in basal‐like breast cancer, providing a potential target for therapy. Breast Cancer Res. 2007;9:R61. [DOI] [PMC free article] [PubMed] [Google Scholar]
- 19. Ou Y, Zhao Z, Zhang W, et al. Kindlin‐2 interacts with beta‐catenin and YB‐1 to enhance EGFR transcription during glioma progression. Oncotarget. 2016;7:74872‐74885. [DOI] [PMC free article] [PubMed] [Google Scholar]
- 20. Ma Y, Zhu B, Liu X, et al. iASPP overexpression is associated with clinical outcome in spinal chordoma and influences cellular proliferation, invasion, and sensitivity to cisplatin in vitro. Oncotarget. 2017;8:68365‐68380. [DOI] [PMC free article] [PubMed] [Google Scholar]
- 21. Fujiwara‐Okada Y, Matsumoto Y, Fukushi J, et al. Y‐box binding protein‐1 regulates cell proliferation and is associated with clinical outcomes of osteosarcoma. Br J Cancer. 2013;108:836‐847. [DOI] [PMC free article] [PubMed] [Google Scholar]
- 22. Dhall G, Traverso M, Finlay JL, Shane L, Gonzalez‐Gomez I, Jubran R. The role of chemotherapy in pediatric clival chordomas. J Neurooncol. 2011;103:657‐662. [DOI] [PubMed] [Google Scholar]
- 23. Saji H, Toi M, Saji S, Koike M, Kohno K, Kuwano M. Nuclear expression of YB‐1 protein correlates with P‐glycoprotein expression in human breast carcinoma. Cancer Lett. 2003;190:191‐197. [DOI] [PubMed] [Google Scholar]
- 24. Nishio S, Ushijima K, Yamaguchi T, et al. Y‐box‐binding protein‐1 is a poor prognostic marker and related to epidermal growth factor receptor in uterine cervical cancer. Gynecol Oncol. 2014;132:703‐708. [DOI] [PubMed] [Google Scholar]
- 25. Miao X, Wu Y, Wang Y, et al. Y‐box‐binding protein‐1 (YB‐1) promotes cell proliferation, adhesion and drug resistance in diffuse large B‐cell lymphoma. Exp Cell Res. 2016;346:157‐166. [DOI] [PubMed] [Google Scholar]
- 26. Basaki Y, Taguchi K, Izumi H, et al. Y‐box binding protein‐1 (YB‐1) promotes cell cycle progression through CDC6‐dependent pathway in human cancer cells. Eur J Cancer. 2010;46:954‐965. [DOI] [PubMed] [Google Scholar]
- 27. Dey A, Robitaille M, Remke M, et al. YB‐1 is elevated in medulloblastoma and drives proliferation in Sonic hedgehog‐dependent cerebellar granule neuron progenitor cells and medulloblastoma cells. Oncogene. 2016;35:4256‐4268. [DOI] [PMC free article] [PubMed] [Google Scholar]
- 28. Elmore S. Apoptosis: a review of programmed cell death. Toxicol Pathol. 2007;35:495‐516. [DOI] [PMC free article] [PubMed] [Google Scholar]
- 29. Lasham A, Moloney S, Hale T, et al. The Y‐box‐binding protein, YB1, is a potential negative regulator of the p53 tumor suppressor. J Biol Chem. 2003;278:35516‐35523. [DOI] [PubMed] [Google Scholar]
- 30. Chatterjee M, Rancso C, Stuhmer T, et al. The Y‐box binding protein YB‐1 is associated with progressive disease and mediates survival and drug resistance in multiple myeloma. Blood. 2008;111:3714‐3722. [DOI] [PubMed] [Google Scholar]
- 31. Wang W, Wang HJ, Wang B, et al. The role of the Y box binding protein 1 C‐terminal domain in vascular endothelial cell proliferation, apoptosis, and angiogenesis. DNA Cell Biol. 2016;35:24‐32. [DOI] [PubMed] [Google Scholar]
- 32. Ha B, Lee EB, Cui J, Kim Y, Jang HH. YB‐1 overexpression promotes a TGF‐beta1‐induced epithelial‐mesenchymal transition via Akt activation. Biochem Biophys Res Commun. 2015;458:347‐351. [DOI] [PubMed] [Google Scholar]
- 33. Sinnberg T, Sauer B, Holm P, et al. PI3K/AKT mediated YB‐1 activation promotes melanoma cell proliferation which is counteracted by an autoregulatory loop. Exp Dermatol. 2012;21:265‐270. [DOI] [PubMed] [Google Scholar]
- 34. Bendris N, Lemmers B, Blanchard JM. Cell cycle, cytoskeleton dynamics and beyond: the many functions of cyclins and CDK inhibitors. Cell Cycle. 2015;14:1786‐1798. [DOI] [PMC free article] [PubMed] [Google Scholar]
- 35. Liu W, Ren H, Ren J, et al. The role of EGFR/PI3K/Akt/cyclinD1 signaling pathway in acquired middle ear cholesteatoma. Mediators Inflamm. 2013;2013:651207. [DOI] [PMC free article] [PubMed] [Google Scholar]
- 36. Al‐Ansari MM, Hendrayani SF, Shehata AI, Aboussekhra A. p16(INK4A) represses the paracrine tumor‐promoting effects of breast stromal fibroblasts. Oncogene. 2013;32:2356‐2364. [DOI] [PMC free article] [PubMed] [Google Scholar]
- 37. Sui Y, Zheng X, Zhao D. Rab31 promoted hepatocellular carcinoma (HCC) progression via inhibition of cell apoptosis induced by PI3K/AKT/Bcl‐2/BAX pathway. Tumour Biol. 2015;36:8661‐8670. [DOI] [PubMed] [Google Scholar]
- 38. Abraham AG, O'Neill E. PI3K/Akt‐mediated regulation of p53 in cancer. Biochem Soc Trans. 2014;42:798‐803. [DOI] [PubMed] [Google Scholar]
- 39. Zhang L, Wang H, Zhu J, Ding K, Xu J. FTY720 reduces migration and invasion of human glioblastoma cell lines via inhibiting the PI3K/AKT/mTOR/p70S6K signaling pathway. Tumour Biol. 2014;35:10707‐10714. [DOI] [PubMed] [Google Scholar]
- 40. Xie R, Yang H, Xiao Q, et al. Downregulation of LRIG1 expression by RNA interference promotes the aggressive properties of glioma cells via EGFR/Akt/c‐Myc activation. Oncol Rep. 2013;29:177‐184. [DOI] [PubMed] [Google Scholar]
- 41. De Salvo M, Maresca G, D'Agnano I, et al. Temozolomide induced c‐Myc‐mediated apoptosis via Akt signalling in MGMT expressing glioblastoma cells. Int J Radiat Biol. 2011;87:518‐533. [DOI] [PubMed] [Google Scholar]
- 42. Wu Y, Sato H, Suzuki T, et al. Involvement of c‐Myc in the proliferation of MCF‐7 human breast cancer cells induced by bHLH transcription factor DEC2. Int J Mol Med. 2015;35:815‐820. [DOI] [PubMed] [Google Scholar]
Associated Data
This section collects any data citations, data availability statements, or supplementary materials included in this article.
Supplementary Materials