Abstract
Organoids are three-dimensional cell cultures that mimic organ functions and structures. The organoid model has been developed as a versatile in vitro platform for stem cell biology and diseases modeling. Tumor organoids are shown to share ~ 90% of genetic mutations with biopsies from same patients. However, it’s not clear whether tumor organoids recapitulate the cellular heterogeneity observed in patient tumors. Here, we used single-cell RNA-Seq to investigate the transcriptomics of tumor organoids derived from human colorectal tumors, and applied machine learning methods to unbiasedly cluster subtypes in tumor organoids. Computational analysis reveals cancer heterogeneity sustained in tumor organoids, and the subtypes in organoids displayed high diversity. Furthermore, we treated the tumor organoids with a first-line cancer drug, Oxaliplatin, and investigated drug response in single-cell scale. Diversity of tumor cell populations in organoids were significantly perturbed by drug treatment. Single-cell analysis detected the depletion of chemosensitive subgroups and emergence of new drug tolerant subgroups after drug treatment. Our study suggests that the organoid model is capable of recapitulating clinical heterogeneity and its evolution in response to chemotherapy.
I. INTRODUCTION
Organoid platforms have been developed to create miniaturized structures of various organs in 3D in vitro culture conditions [1–4]. Organoids are widely applied to stem cell studies [1, 5] and disease modeling [6–11]. In colorectal tumor organoids, it has been shown that 90% of genetic mutations from patient tumors are still maintained in tumor organoids, suggesting the robustness of modeling tumor mutations [12]. Therefore, tumor organoids are starting to be broadly applied for clinical applications [6, 13, 14].
Tumor heterogeneity is widely observed in many cancer types, and is considered a major reason for relapse and refractory cancer after chemotherapy [15–19]. However, it is not clear whether tumor organoids recapitulate and maintain clinical tumor heterogeneity, which is a critical aspect for using organoids as cancer models.
To address this important question, we used Drop-Seq [20] to profile transcriptomics of single cells in organoids derived from human colorectal tumors (Fig. 1), and applied machine learning methods to unbiasedly classify subtypes within tumor organoids. The single-cell analysis suggests heterogeneity is still well maintained in organoids and showing high diversity. Next, we treated organoids with Oxaliplatin, a first-line colorectal cancer drug. Single-cell analysis revealed varying responses to drug treatment from different organoid subpopulations.
Figure 1.
Human Colorectal Tumor Organoids. Tumor cells derived from a patient of colorectal cancer was embeded in matrigel and cultured in 3D sturcture. The Scale bar is 400 um.
II. MATERIAL AND METHODS
A. Human Colorectal Tumor Organoids
Early stage (stage I) primary human CRC tumors (previously untreated with chemotherapy agents) surgically resected during biopsies were used for this study and informed consent was obtained from each patient. Approval for this research protocol was obtained from IRB committees at Weill Cornell Medical College and NY Presbyterian Hospital. Cancer cells derived from a CRC patient were cultured in matrigel following the protocol developed by Sato et al.[21]. Tumors were washed, stripped, and chopped into 5 mm pieces. Tissue fragments were incubated with digestion buffer. Isolated intestinal fragments were embedded in matrigel and seed in 48-well plates. Organoids were cultured for approximately 14 days prior to harvesting and sequencing. Drug treatments were administered to organoid cell culture for approximately 48 hours prior to harvesting. [22].
B. Single-Cell RNA-Seq
Published protocol of Drop-Seq [20] was followed for library preparation. Briefly, we followed the steps (1) suspended the organoid cells into single cells, (2) encapsulated single cells with multiplexed barcoded microparticle, (3) lysed the isolated cells in droplets, (4) captured STEMPs (single-cell transcriptomes attached to microparticles), (5) performed reverse transcription and PCR amplification to construct sequencing library, and (6) sequencing the cDNA library.
C. Computational Analysis
The sequencing reads were processed following the pipeline developed by the McCarroll lab: 1. Tag cell and molecular barcodes, 2. trim 5’ adaptors and 3’ polyA sequence, and 3. aligned the reads to hg19 reference genome. Cells and genes with low total number of reads are filtered out. Read counts are normalized using TMM (Trimmed Mean of M-values) in EdgeR package[23]. t-Distributed Stochastic Embedding (t-SNE)[24], a nonlinear dimension reduction method, was applied to visualize single-cell transcriptomics on 2D space. Unbiased clustering was done by applying Density-based spatial clustering of applications with noise (DBSCAN)[25]. Heatmaply in R were used to visualize the heatmaps of gene signatures and pathway signatures.
D. Pathway Analysis
We performed pathway analyses on the abundant genes identified in individual clusters from single-cell transcriptomics using pathway analysis function in EdgeR. Top 100 genes with most abundant mean expression in each cluster were selected for gene set enrichment analysis based on Gene Ontology (GO) and Kyoto Encyclopedia of Genes Genomes (KEGG)[26] (p-value <0.05).
III. RESULTS
A. Heterogeneity in Tumor Organoids
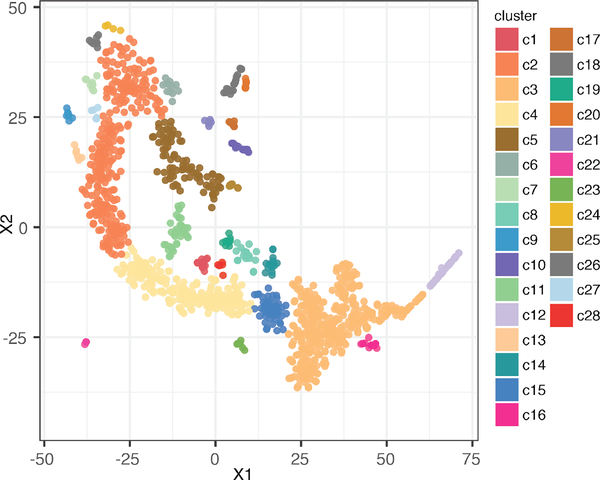
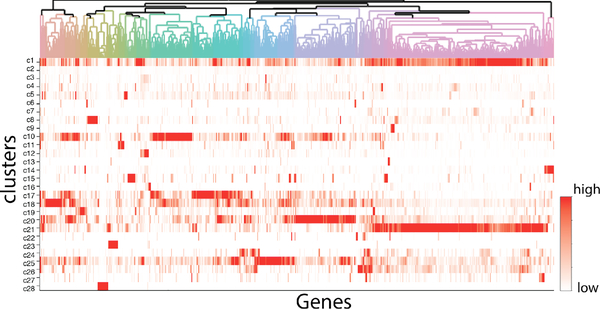
By using Drop-Seq, we captured ~1,500 tumor cells from organoids in normal condition with abundant sequencing reads detected. t-SNE algorithm was performed to convert high dimensionality of transcriptomic in single cells to 2D space for data visualization (Fig. 2). t-SNE is a machine learning algorithm that performs nonlinear dimensionality reduction based on probability distribution, and it has been applied to many scientific and engineering fields, including single cell analysis [27]. In addition, unbiased clustering algorithm, DBSCAN, was applied to t-SNE analysis to cluster the subtypes within tumor organoids (Fig. 2). Around ~30 clusters are identified robustly with permutations of perplexities and iterations of t-SNE analysis. These clusters show distinct spatial distribution on the t-SNE map, and display highly diverse expression patterns (Fig. 3). Some of the cell clusters show abundant gene expressions in majority of gene groups (e.g. cluster c1: the top row in Fig. 3), while some other clusters show enriched gene expressions only in very specific gene groups (e.g. cluster c28: the lowest row in Fig. 3). Combing these results, tumor organoids maintain cell heterogeneity, and these subtypes display highly diversified transcriptomic patterns.
Figure 2.
t-SNE plot showing unbiased clustered subtypes in tumor organoids. Each dot represent a single cell, and color refers different clusters identified using DBSCAN. There are 28 clusters identified in this t-SNE plot.
Figure 3.
Heatmap of transcriptomic signatures in each cluster. Columns are clusters, and rows are genes. Red color shows the mean expressions of genes in clusters. Dendrogram on genes showing gene groups associated with single-cell clusters shown in Figure 2.
B. Pathway Signatures of Subtypes in Organoids
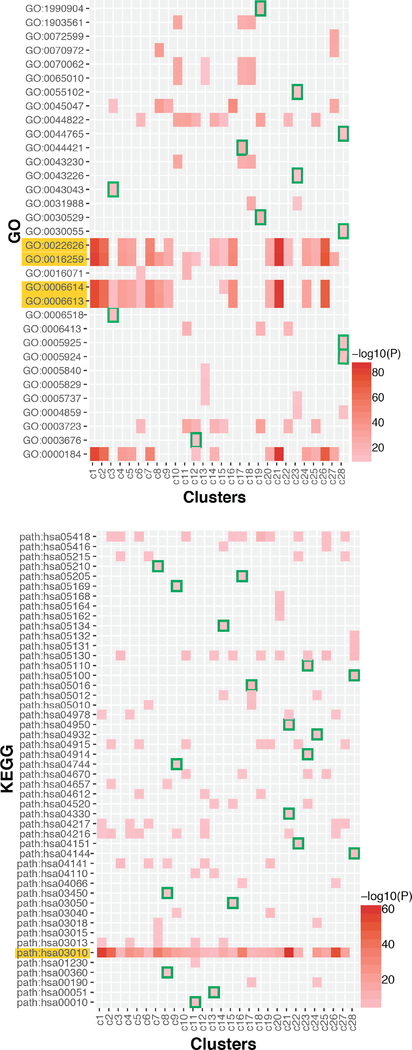
To find out transcriptomic signatures in each cluster, we ran pathway enrichment analysis based on Gene Ontology (GO) and Kyoto Encyclopedia of Genes and Genomes (KEGG) (Fig. 4). Top 5 most enriched GOs or KEGG pathways in each cluster were collected for pathway signature analysis. In these analysis, there are some pathways highly enriched in most of the subtypes (e.g. GO:002226: GO:0016259, GO:0006614, GO:0006613, hsa03010). These pathways are related to ribosome, co-translational protein targeting to membrane, and mRNA catabolic process, etc. In addition, there are numerous GOs or KEGG pathways only enriched in specific clusters. For example, glycolysis/gluconeognesis (hsa00010), fructose and mannose metabolism (hsa00051), and non-homologous end-joining (hsa0003450) are uniquely enriched in cluster c11, c13, and c8 respectively. The patterns of enriched pathways in the subtypes are also highly diverse, which is consistent with previous t-SNE and gene signature analysis, suggesting the heterogeneity in the level of gene sets and pathways.
Figure 4.
Heatmap of Pathway Enrichement Analysis. Upper: Gene Ontology, Bottom: KEGG pathway Analysis. Rows are GOs or KEGG pathways, and columns are cell clusters. Red colors represent the significance of pathway enrichment (-log10(p value)). Green color highlights the pathway signatures specific to single clusters. The yellow highlighted pathways (rows) are the pathways globally enriched in tumor organoids.
C. Oxaliplatin treatment perturbs the subtypes in tumor organoids
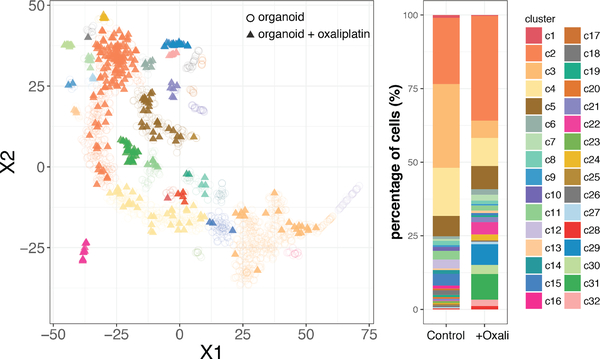
We next added a chemotherapy drug, Oxaliplatin, to tumor organoids and performed single cell analysis consistently to compare the single-cell transcriptomics and tumor cell populations in response to Oxaliplatin. In the t-SNE analysis, we combined the tumor organoids in normal condition (Fig. 2) and tumor organoids with Oxaliplatin treatment (Fig. 5). The distribution of single cells with Oxaliplatin treatment is roughly consistent with the distribution in control condition, but the diversity of subtypes is greatly altered. To quantify the diversity alteration, we calculated cell percentage in each cluster and compared it between normal condition and Oxaliplatin treatment (Fig. 5). With Oxaliplatin treatment, there were 8 subtypes (c10, c12, c14, c16, c17, c18, c20, c23) completely depleted and 4 newly emerging populations (c29, c30, c31, and c32). In addition, the ratios of two major populations (c3 and c4) in normal condition were significantly reduced by Oxaliplatin treatment, and c2 becomes the single dominating population.
Figure 5.
Left: t-SNE plot of single-cell RNASeq from organoid cells after Oxaliplatin treatment (tringles with solid colors), and the t-SNE plot of organoids in normal condition shown in Fig. 2 is plotted in circles for comparison. Right: Cell percentage in cell clusters. Each color represents percentages of cells in each clusters. Organoids in normal condition (data shown in Fig. 2) and Oxaliplatin treatments are shown in two separate tacked bars.
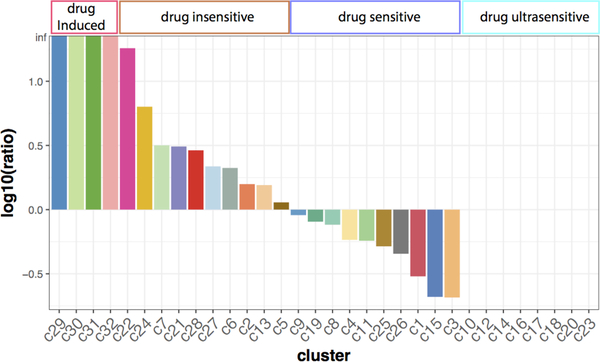
The ratios of cell percentage between normal condition and Oxaliplatin treatment were calculated to quantify the alteration of organoid heterogeneity (Fig. 6). These clusters were grouped into four types corresponding to the cell percentage alterations: 1. Drug induced group (c29, c30, c31, and c32), 2. Drug insensitive group (c2, c5, c6, c7, c13, c22, c21, c24, c27, and c28), 3. Drug sensitive group (c1, c3, c4, c8, c9, c11, c15, c19, c25, and c26), and 4. Drug ultrasensitive group (c10, c12, c14, c16, c17, c18, c20, c23). Drug induced groups includes the subtypes only appear after Oxaliplatin treatment, while Drug ultrasensitive are subtypes completely depleted by Oxaliplatin. In addition, Drug insensitive group consists of 10 clusters showing increasing cell percentages after drug treatment, and drug sensitive group consists of the other 10 groups showing decreasing cell percentages in response to Oxaliplatin.
Figure 6.
Ratios of cell percentage changes in clusters. The ratio is calculated by (cell percentage after Oxaliplatin treatment / percentage in control).
IV. DISCUSSION
Tumor organoids display heterogeneous single-cell transcriptomics with highly varying signatures of genes and pathways. Single-cell analysis reveals that drug treatment on tumor organoids causes differential responses in subtypes. We demonstrated a computational approach combining single-cell RNA-Seq, machine learning algorithms, pathway analysis, and signature classifications to characterize the drug responses in heterogeneous tumors using tumor organoids as a drug testing platform.
ACKNOWLEDGMENT
We thank the members of the Shen lab and the Lipkin lab for discussion and generous support.
Resrach supported by NIH NIGMS R35GM122465, R21CA201963 and NSF 1511357.
Contributor Information
Kai-Yuan Chen, Department of Biomedical Engineering, Duke University, Durham, NC 27708 USA (phone: 607-793-0198; kai.yuan.chen@duke.edu)..
Tara Srinivasan, Department of Biomedical Engineering. Cornell University, Ithaca, NY 14853 USA (ts594@cornell.edu)..
Christopher Lin, Department of Computer Science, Duke University, Durham, NC 27708 USA (christopher.lin@duke.edu)..
Kuei-Ling Tung, Department of Biological and Environmental Engineering. Cornell University, Ithaca, NY 14853 USA (kt347@cornell.edu)..
Ziyang Gao, Department of Biomedical Engineering, Duke University, Durham, NC 27708 USA (ziyang.gao@duke.edu)..
David S. Hsu, Department of Medical Oncology, Duke University Medical Center, Durham, NC 27708 USA. (shiaowen.hsu@duke.edu).
Steven M. Lipkin, Departments of Medicine, Genetic Medicine and Surgery, Weill Cornell Medical College, New York, NY 10065 USA (stl2012@med.cornell.edu).
Xiling Shen, Department of Biomedical Engineering, Duke University, Durham, NC 27708 USA (xs37@duke.edu)..
REFERENCES
- [1].Sato T et al. , “Single Lgr5 stem cells build crypt-villus structures in vitro without a mesenchymal niche,” Nature, vol. 459, no. 7244, pp. 262–5, May 14 2009. [DOI] [PubMed] [Google Scholar]
- [2].Lee JH et al. , “Lung stem cell differentiation in mice directed by endothelial cells via a BMP4-NFATc1-thrombospondin-1 axis,” Cell, vol. 156, no. 3, pp. 440–55, January 30 2014. [DOI] [PMC free article] [PubMed] [Google Scholar]
- [3].Huch M et al. , “Long-term culture of genome-stable bipotent stem cells from adult human liver,” Cell, vol. 160, no. 1–2, pp. 299–312, January 15 2015. [DOI] [PMC free article] [PubMed] [Google Scholar]
- [4].Lancaster MA et al. , “Cerebral organoids model human brain development and microcephaly,” Nature, vol. 501, no. 7467, pp. 373–9, September 19 2013. [DOI] [PMC free article] [PubMed] [Google Scholar]
- [5].Chen KY et al. , “A Notch positive feedback in the intestinal stem cell niche is essential for stem cell self-renewal,” Mol Syst Biol, vol. 13, no. 4, p. 927, April 28 2017. [DOI] [PMC free article] [PubMed] [Google Scholar]
- [6].Broutier L et al. , “Human primary liver cancer-derived organoid cultures for disease modeling and drug screening,” Nat Med, vol. 23, no. 12, pp. 1424–1435, December 2017. [DOI] [PMC free article] [PubMed] [Google Scholar]
- [7].Duarte AA et al. , “BRCA-deficient mouse mammary tumor organoids to study cancer-drug resistance,” Nat Methods, vol. 15, no. 2, pp. 134–140, February 2018. [DOI] [PubMed] [Google Scholar]
- [8].Weeber F, Ooft SN, Dijkstra KK, and Voest EE, “Tumor Organoids as a Pre-clinical Cancer Model for Drug Discovery,” Cell Chem Biol, vol. 24, no. 9, pp. 1092–1100, September 21 2017. [DOI] [PubMed] [Google Scholar]
- [9].Cristobal A, van den Toorn HWP, van de Wetering M, Clevers H, Heck AJR, and Mohammed S, “Personalized Proteome Profiles of Healthy and Tumor Human Colon Organoids Reveal Both Individual Diversity and Basic Features of Colorectal Cancer,” Cell Rep, vol. 18, no. 1, pp. 263–274, January 3 2017. [DOI] [PubMed] [Google Scholar]
- [10].Walsh AJ, Cook RS, Sanders ME, Arteaga CL, and Skala MC, “Drug response in organoids generated from frozen primary tumor tissues,” Sci Rep, vol. 6, p. 18889, January 7 2016. [DOI] [PMC free article] [PubMed] [Google Scholar]
- [11].Skardal A, Devarasetty M, Rodman C, Atala A, and Soker S, “Liver-Tumor Hybrid Organoids for Modeling Tumor Growth and Drug Response In Vitro,” Ann Biomed Eng, vol. 43, no. 10, pp. 2361–73, October 2015. [DOI] [PMC free article] [PubMed] [Google Scholar]
- [12].Weeber F et al. , “Preserved genetic diversity in organoids cultured from biopsies of human colorectal cancer metastases,” Proc Natl Acad Sci U S A, vol. 112, no. 43, pp. 13308–11, October 27 2015. [DOI] [PMC free article] [PubMed] [Google Scholar]
- [13].Huang L et al. , “Ductal pancreatic cancer modeling and drug screening using human pluripotent stem cell- and patient-derived tumor organoids,” Nat Med, vol. 21, no. 11, pp. 1364–71, November 2015. [DOI] [PMC free article] [PubMed] [Google Scholar]
- [14].van de Wetering M et al. , “Prospective derivation of a living organoid biobank of colorectal cancer patients,” Cell, vol. 161, no. 4, pp. 933–45, May 7 2015. [DOI] [PMC free article] [PubMed] [Google Scholar]
- [15].Campbell PJ et al. , “Subclonal phylogenetic structures in cancer revealed by ultra-deep sequencing,” Proc Natl Acad Sci U S A, vol. 105, no. 35, pp. 13081–6, September 2 2008. [DOI] [PMC free article] [PubMed] [Google Scholar]
- [16].Shipitsin M et al. , “Molecular definition of breast tumor heterogeneity,” Cancer Cell, vol. 11, no. 3, pp. 259–73, March 2007. [DOI] [PubMed] [Google Scholar]
- [17].Gonzalez-Garcia I, Sole RV, and Costa J, “Metapopulation dynamics and spatial heterogeneity in cancer,” Proc Natl Acad Sci U S A, vol. 99, no. 20, pp. 13085–9, October 1 2002. [DOI] [PMC free article] [PubMed] [Google Scholar]
- [18].Giaretti W, Monaco R, Pujic N, Rapallo A, Nigro S, and Geido E, “Intratumor heterogeneity of K-ras2 mutations in colorectal adenocarcinomas: association with degree of DNA aneuploidy,” Am J Pathol, vol. 149, no. 1, pp. 237–45, July 1996. [PMC free article] [PubMed] [Google Scholar]
- [19].Sauter G, Moch H, Gasser TC, Mihatsch MJ, and Waldman FM, “Heterogeneity of chromosome 17 and erbB-2 gene copy number in primary and metastatic bladder cancer,” Cytometry, vol. 21, no. 1, pp. 40–6, September 1 1995. [DOI] [PubMed] [Google Scholar]
- [20].Macosko EZ et al. , “Highly Parallel Genome-wide Expression Profiling of Individual Cells Using Nanoliter Droplets,” Cell, vol. 161, no. 5, pp. 1202–1214, May 21 2015. [DOI] [PMC free article] [PubMed] [Google Scholar]
- [21].Sato T et al. , “Long-term expansion of epithelial organoids from human colon, adenoma, adenocarcinoma, and Barrett’s epithelium,” Gastroenterology, vol. 141, no. 5, pp. 1762–72, November 2011. [DOI] [PubMed] [Google Scholar]
- [22].Pires IM, Ward TH, and Dive C, “Oxaliplatin responses in colorectal cancer cells are modulated by CHK2 kinase inhibitors,” Br J Pharmacol, vol. 159, no. 6, pp. 1326–38, March 2010. [DOI] [PMC free article] [PubMed] [Google Scholar]
- [23].Robinson MD, McCarthy DJ, and Smyth GK, “edgeR: a Bioconductor package for differential expression analysis of digital gene expression data,” Bioinformatics, vol. 26, no. 1, pp. 139–40, January 1 2010. [DOI] [PMC free article] [PubMed] [Google Scholar]
- [24].Taskesen E and Reinders MJ, “2D Representation of Transcriptomes by t-SNE Exposes Relatedness between Human Tissues,” PLoS One, vol. 11, no. 2, p. e0149853, 2016. [DOI] [PMC free article] [PubMed] [Google Scholar]
- [25].Martin Ester H-PK, Sander Jiirg, Xu Xiaowei, “A Density-Based Algorithm for Discovering Clustersin Large Spatial Databases with Noise,” in Proceedings of the Second International Conference on Knowledge Discovery and Data Mining 1996, pp. 226–231. [Google Scholar]
- [26].Kanehisa M and Goto S, “KEGG: kyoto encyclopedia of genes and genomes,” Nucleic Acids Res, vol. 28, no. 1, pp. 27–30, January 1 2000. [DOI] [PMC free article] [PubMed] [Google Scholar]
- [27].Tirosh I et al. , “Dissecting the multicellular ecosystem of metastatic melanoma by single-cell RNA-seq,” Science, vol. 352, no. 6282, pp. 189–96, April 8 2016. [DOI] [PMC free article] [PubMed] [Google Scholar]


