Abstract
Both designed and natural anion-conducting channelrhodopsins (dACRs and nACRs, respectively) have been widely applied in optogenetics (enabling selective inhibition of target-cell activity during animal behaviour studies), but each class exhibits performance limitations, underscoring trade-offs in channel structure-function relationships. Therefore, molecular and structural insights into dACRs and nACRs will be critical not only for understanding the fundamental mechanisms of these light-gated anion channels, but also to create next-generation optogenetic tools. Here we report crystal structures of the dACR iC++, along with spectroscopic, electrophysiological and computational analyses that provide unexpected insights into pH dependence, substrate recognition, channel gating and ion selectivity of both dACRs and nACRs. These results enabled us to create an anion-conducting channelrhodopsin integrating the key features of large photocurrent and fast kinetics alongside exclusive anion selectivity.
Anion selectivity within the broad family of light-gated ion channels1 was initially created by transformation, guided by crystal structures2, of natural cation-conducting channelrhodopsins (CCRs) into dACRs3–6. Anion selectivity was subsequently found to have evolved naturally in the nACRs of certain cryptophyte algae7. Both classes of anion-conducting channelrhodopsin (ACR) have proved to be useful in optogenetics—that is, for enabling reversible silencing of specific neurons with sufficient potency to modulate animal behaviour, beginning6 with the dACR iC++.
Befitting their provenance from CCRs that achieved versatile applicability in optogenetics8, in part through engineered gating spanning around 6 orders of magnitude from millisecond-scale control of fast-spiking cells to step-like bistable modulation1,3,6,9,10, dACRs offer a wider range of kinetics relevant to neuroscience than nACRs. On the other hand, nACRs exhibit larger photocurrents (despite high anion selectivity)7. Bringing important features such as speed and large photocurrents together in a single opsin has been hampered by a lack of structural understanding.
The structure of an nACR, from Guillardia theta (GtACR1; reported in the accompanying paper11, provided high-resolution perspective on anion selectivity. However, complementary structural information on dACRs would greatly accelerate development of next-generation tools for neuroscience12. Moreover, formal confirmation of the basis for anion selectivity and channel gating would require detailed structural information and redesign of dACRs. We therefore solved multiple structures of the dACR iC++6,13–16 and used resulting insights to create a new class of ACR functionality.
Structural and functional characterization of iC++
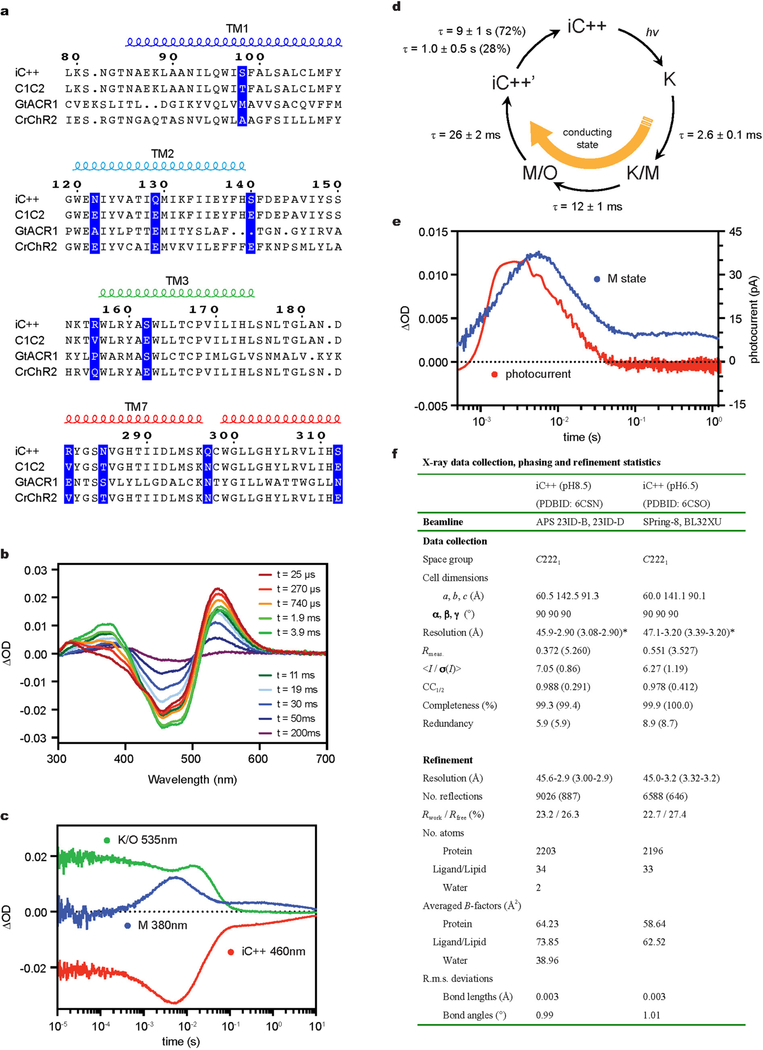
iC++ was made from a CCR (C1C2) via 10 mutations3,6 in transmem-brane helices (TM) 1, 2, 3 and 7 (Extended Data Fig. 1a). To functionally characterize iC++ states, we performed photocycle analysis via flash photolysis, observing three spectroscopically distinguishable interme-diates (K, M and O). The K intermediate had the longest lifetime of any channelrhodopsin (τ=2.6 ±0.1 ms; Extended Data Fig. 1b–d), and channel closing appeared to be coupled to decay of the M intermediate (Extended Data Fig. 1e). The photocycle of iC++ can therefore be distinguished from those of nACRs17; for example, Gt ACR1 has 5 intermediate states (K, L, M, N, O) with a much shorter K lifetime (microsecond scale) than iC++ (Supplementary Discussion). Gating of nACRs may be regulated by two kinetic processes (coupled slow-opening–fast-closing and fast-opening–slow-closing), with fast and slow closing coupled to decay of L and M intermediates, respectively17; key differences between iC++ and GtACR1 photocycle architecture therefore provide opportunities to explore underlying structural mechanisms.
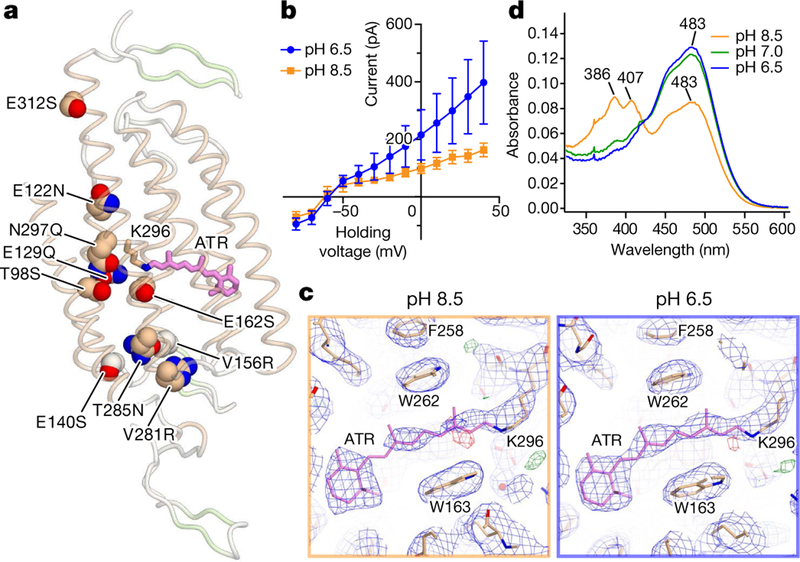
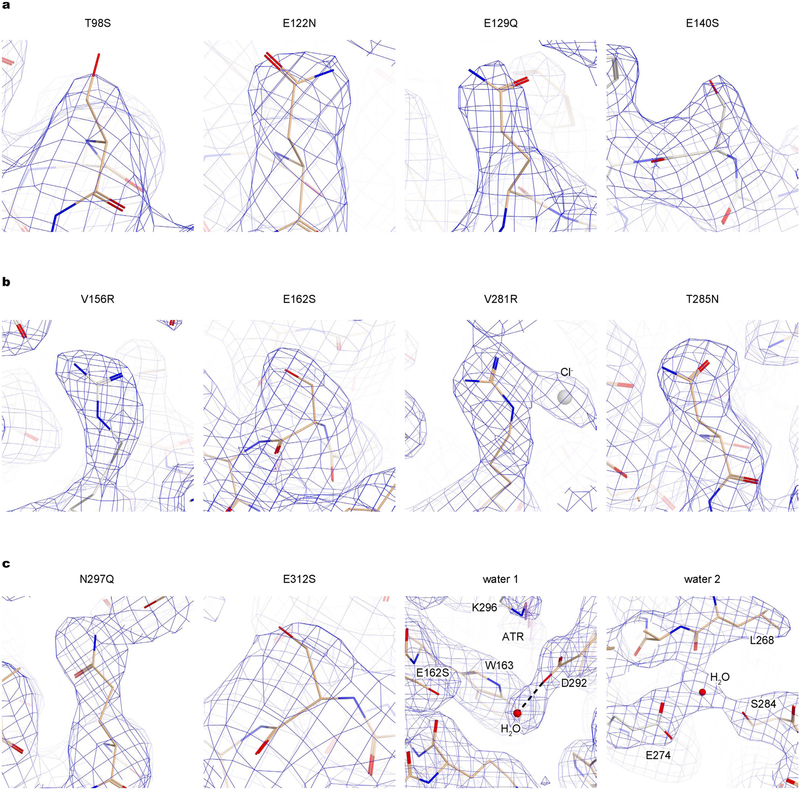
We obtained crystal structures of iC++ at pH 6.5 and 8.5 (at 3.2 and 2.9 Å resolution, respectively; Fig. 1a, Extended Data Fig. 1f). To facilitate crystallogenesis, an N-linked glycosylation site was mutated (N61Q), and crystallization was achieved within the lipidic cubic phase composed of monoolein (Extended Data Fig. 2a). The two structures were almost identical (root mean square deviation (r.m.s.d.) of 0.31 Å over all Cα atoms; Extended Data Fig. 2b). Like other channelrho-dopsins1, iC++ forms a dimer; each monomer is composed of an N-terminal extracellular domain (residues 51–84), 7 transmembrane domains (residues 85–316), and a C-terminal β-sheet domain (residues 317–342) (Fig. 1a). The 10 mutated residues were well resolved (Fig. 1a, Extended Data Fig. 3a), and we could model two putative water molecules into the electron-density map that were stable in molecular dynamics simulations (Extended Data Fig. 3b).
Fig. 1 |. Structures of iC++ and insights into pH dependence.
a, Crystal structure of iC++ at pH 8.5. iC++ mutations are shown with sphere models. b, pH-dependent photocurrents of iC ++ at pHext 6.5 (blue) and 8.5 (orange). Data are mean ±s.e.m. of 5 cells. c, Retinal-binding pocket (RBP) of iC++ at pH 8.5 and 6.5; 2Fo − Fc maps (blue mesh, contoured at 1σ) and Fo − Fc maps (green and red meshes, contoured at 3σ and −3σ, respectively) are shown. d, iC++ absorbance spectra at pH 6.5, 7.0 and 8.5.
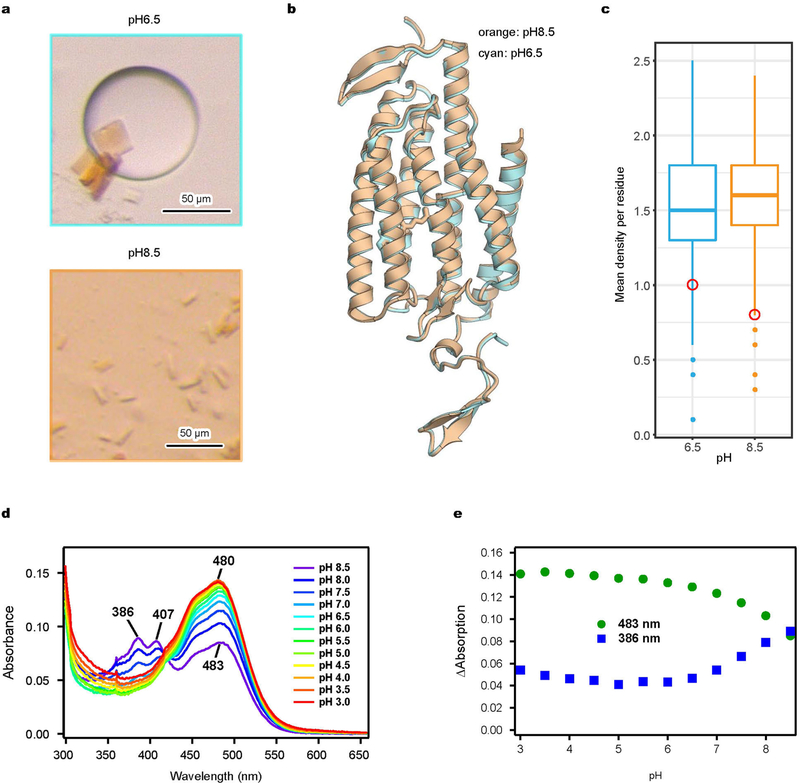
Previous studies had found differences in pH dependence among certain nACRs and dACRs3,6,7; in nACRs such as GtACR1, channel activity is insensitive to extracellular pH, but in dACRs photocurrent can decrease under alkaline conditions (Fig. 1b). Comparing the structures at pH 6.5 and 8.5 revealed that occupancy of the all-trans-ret-inal (ATR) chromophore site markedly differed. Although resolution and quality of the overall electron-density map at pH 8.5 was slightly better than at pH 6.5, the local electron density of ATR was lower (Fig. 1c), indicating a structural difference. In calculating mean elec-tron densities of the overall protein and of ATR using the diffraction to 3.2 Å, mean electron density of the overall structure was indeed higher, but that of ATR was lower, at pH 8.5 (Extended Data Fig. 2c), suggesting that occupancy of ATR was lower at pH 8.5, consistent with decreased colouration of the crystals (Extended Data Fig. 2a). We also measured absorption spectra of iC++ at different pH values and observed additional peaks at 386 nm and 407 nm for pH values above 7.5, suggesting that the Schiff base is deprotonated and ATR is hydrolyzed under alkaline conditions (Fig. 2d, Extended Data Fig. 2d, e). Reduction of electronegative potential by introduced mutations such as E129Q and E162S could destabilize the Schiff base and allow hydrolysis of ATR at alkaline pH, thus decreasing dACR activity.
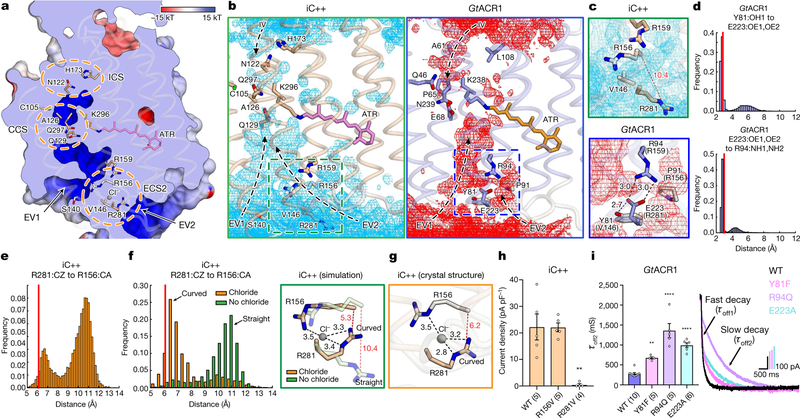
Fig. 2 |. Structural and functional characterization of the extracellular constrictions.
a, Anion-conducting pathway of iC++. Surface is coloured by the electrostatic potential and the orange dashed circles highlight constriction sites. b, Simulated water distribution for iC++ (cyan meshes, left) and GtACR1 (red meshes, right). The water density maps are contoured at a probability density of 0.016 molecules per Å3. Dashed boxes, ECS2; arrows, putative water or ion pathways. c, Magnified view of the boxed regions from b. Black and red dashed lines represent hydrogen - bonding and R156–R281 interactions, respectively, with distances shown in Å. d, e, Distance histograms for R281–R156 (e), Y81–E223 (d, top) and E223–R94 (d, bottom). f, Distance histograms for R156–R281 (left), and overlaid simulation structures at chloride-binding site with and without chloride (right). g, Crystal structure of the chloride-binding site as shown in f. h, i, Effects of mutations in the iC++ chloride-binding site (h, **P =0.0013) and GtACR1 ECS2 (i, **P =0.003, ****P =0.0001). Crystal structure distances are marked as red lines in histograms (d–f). Data are mean ±s.e.m.; one-way ANOVA followed by Dunnett’s test. Sample size (number of cells) indicated in parentheses.
Extracellular constriction sites of ACRs
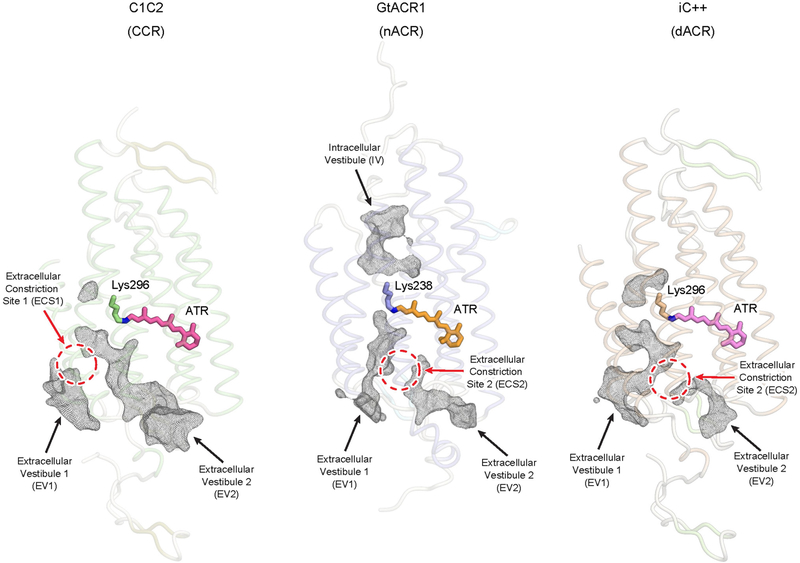
We next analysed the ion-conduction pathway, which has implications for both basic biology and optogenetics. All structurally resolved channelrhodopsins contain two extracellular vestibules (EV1 and EV2) (Extended Data Fig. 4). In C1C2, EV1 is occluded at the extracellular constriction site-1 (ECS1) by hydrogen-bonding interactions between Gln95 and Glu140, whereas EV2 extends to the central constriction site (CCS)2,11. In GtACR1, EV2 is occluded at extracellular constriction site-2 (ECS2) by hydrogen bonds among Tyr81, Arg94 and Glu223, whereas EV1 is connected to the CCS11. Unexpectedly, in the dACR iC++, overall extracellular vestibule shapes are more similar to those of the nACR GtACR1 than the CCR C1C2 (Extended Data Fig. 4)—even though iC++ was designed on the C1C2 backbone—indicating that the changes made to C1C2 when making iC++ may have accessed fundamental features involved in light-activated anion conduction. The realignment of the extracellular vestibule is partly caused by E140S, which breaks the hydrogen bond with Gln95 and allows EV1 to extend to the CCS (Fig. 2a), whereas EV2 is occluded at ECS2 by water- or ion-mediated hydrogen bonding between Arg156 and Arg281 (Fig. 2a).
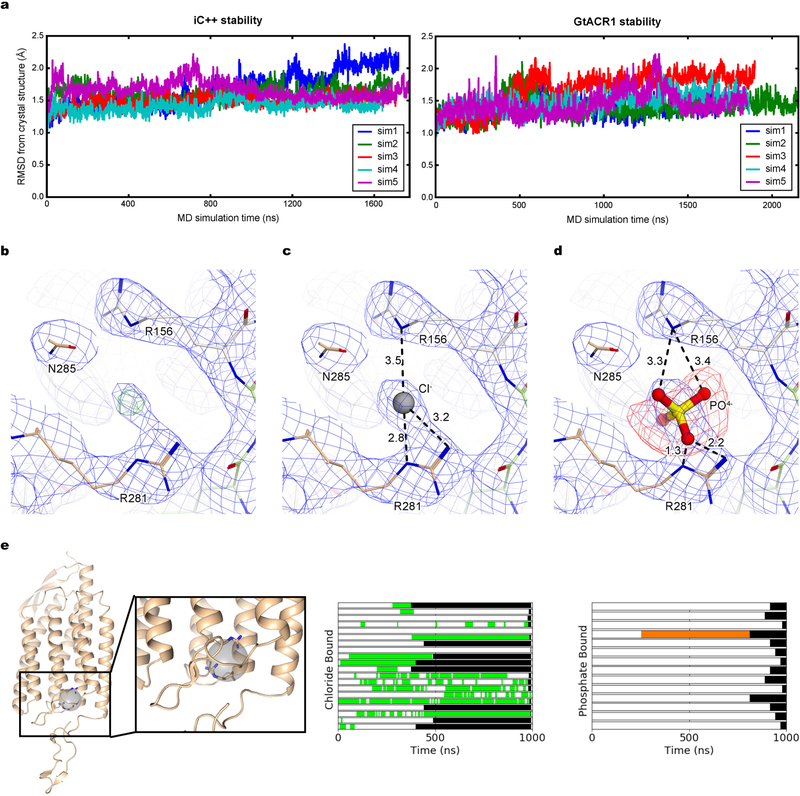
To analyse stability of constriction site interactions, we performed all-atom molecular dynamics simulations of iC++ and GtACR1 (Fig. 2b). Whereas overall structures of iC++ and GtACR1 were stable (Extended Data Fig. 5a), differences were observed. First, interactions at ECS2 of iC++ were weaker than for GtACR1 (Fig. 2c), in which interactions among Tyr81, Arg94 and Glu223 (Val146, Arg159 and Arg281 in iC++) were highly stable, and Tyr81–Arg94 remained close to hydrogen-bond distance from Glu223 (Fig. 2d). However in iC++, Arg281 adopted two conformations, such that the Arg156–Arg281 interaction was disrupted and reformed continuously, and water molecules passed from both EV1 and EV2 through ECS2 to the CCS (Fig. 2b, e).
The two conformers of Arg281 exchanged in a chloride-dependent manner (Fig. 2f, left). Simulations started with chloride ions distributed randomly in bulk solvent, yet a chloride ion often spontaneously coordinated between Arg281 and Arg156. In the absence of coordinated chloride, Arg281 exhibited a straight conformation, protruding into the extracellular solvent, but with a coordinated chloride, Arg281 adopted a curved conformation (Fig. 2f). Notably, Arg281 is curved in the crystal structure, and a strong positive peak was detected between Arg156 and Arg281 in Fo − Fc and 2Fo − Fc electron-density maps (Extended Data Fig. 5b, c). To assess whether this observed density is a chloride or phos-phate in the crystallization condition, we ran refinement in the presence of inorganic phosphate and found a strong negative peak in the Fo − Fc electron-density map (Extended Data Fig. 5d). Furthermore, simulations in the presence of chloride or phosphate revealed that chloride exhibited 10-fold greater occupancy time in the binding site compared to phosphate (Extended Data Fig. 5e). Further studies could evaluate other ions or strongly coordinated water; however, these results suggest that electron density detected in the crystal structure is much more likely to be caused by chloride than phosphate (Fig. 2g). Of note, in the presence of chloride, the curved Arg281 would be more energetically favourable and thereby trapped in the crystal structure. Therefore, one of the functions of Arg281 may be to capture chloride from the extra-cellular side and facilitate its entry into EV1, as we observed in a simu-lation run. Consistent with this model, the R281V mutation in iC++ essentially abolished photocurrents while maintaining membrane targeting and expression, demonstrating the functional importance of this structural feature of ECS2 (Fig. 2h, Extended Data Figs. 6–8). Finally, in probing the broad relevance of ECS2 for nACRs, we found that Y81F, R94Q and E223A mutants of GtACR1 showed an increased slow-closing time (τoff2) (Fig. 2i), illustrating how disruption and reformation of ECS2 hydrogen-bonding interactions may generally regulate channel gating.
Central and intracellular constriction sites
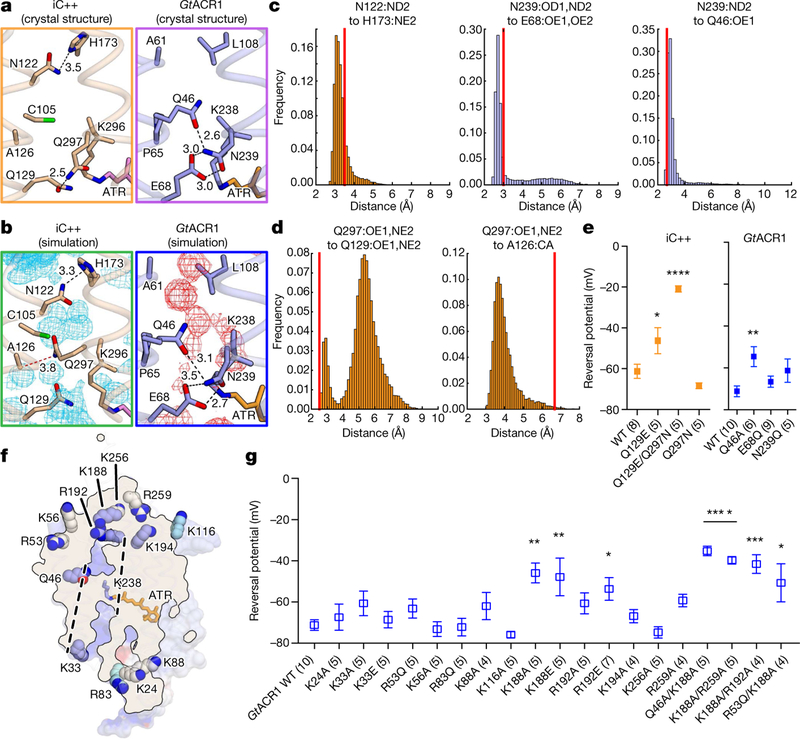
Further insights were gained from analysis of the intracellular side. In the GtACR1 structure11, Gln46, Glu68, and Asn239 form the CCS, and the intracellular vestibule extends to this CCS (Fig. 3a). By contrast, iC++ revealed two constrictions: the CCS and an intracellular constriction site (ICS; Figs. 2a, 3a). The CCS was mainly formed by Gln129–Gln297 (Glu68–Asn239 in GtACR1), and the ICS by Asn122– His173 (Ala61–Leu108 in GtACR1). In simulations, interactions at the CCS of GtACR1 and the ICS of iC++ were highly stable; in GtACR1, Gln46–Asn239 maintained hydrogen bonds with Glu68, and in iC++, Asn122 maintained hydrogen bonds with His173 (Fig. 3b, c). By contrast, interaction at the iC++ CCS was unstable; the Gln297 side chain frequently flipped out, disrupting the hydrogen bond with Gln129. Notably, in the flipped conformation, Gln297 formed a new stable van der Waals interaction with Ala126, blocking water permeation (Fig. 3b, d). These results suggest that in GtACR1 (as proposed18,19 for C1C2), the stable hydrogen bond between Glu68 and Asn239 (Glu129 and Asn297 in C1C2) serves to keep the channel closed, but the corresponding interaction in iC++ (Gln129–Gln297) alone does not fully explain inhibition of water or ion flux, as it also requires a stable van der Waals interaction with Ala126 to accommodate the flexibility of Gln297.
Fig. 3 |. Structural basis of ion selectivity in iC++ and GtACR1.
a, Crystal structures of iC++ (left) and GtACR41 (right) constriction sites. Dashed lines represent hydrogen-bonding interactions with distances shown in Å. b, Molecular dynamics simulation snapshots of the iC++ (left) and GtACR1 (right) constriction sites. Black and red dashed lines represent hydrogen bonding and van der Waals interactions, respectively. Water density maps are contoured at a probability density of 0.016 molecules per Å3. c, d, Distance histograms for N122–H173 (left), N239–E68 (middle) and N239–Q46 (right) (c), Q297–Q129 (left) and Q297–A126 (right) (d) during simulation. e, Vrev summary for CCS mutations. (*P =0.025, **P =0.007, ****P = 0.0001, left to right, respectively) f, Positively charged residues near the ion-conducting pore of GtACR1. Dashed lines represent the putative ion-conducting path. Residues on helices, β-sheets and loops are coloured blue, cyan and white, respectively. g, Vrev summary for mutations of the residues shown in f (*P <0.05, **P <0.01, ***P = 0.0003, ****P =0.0001). Distances in the crystal structure are marked as red lines in histograms (c, d). Data are mean ± s.e.m.; one-way ANOVA followed by Dunnett’s test. Sample size (number of cells) indicated in parentheses.
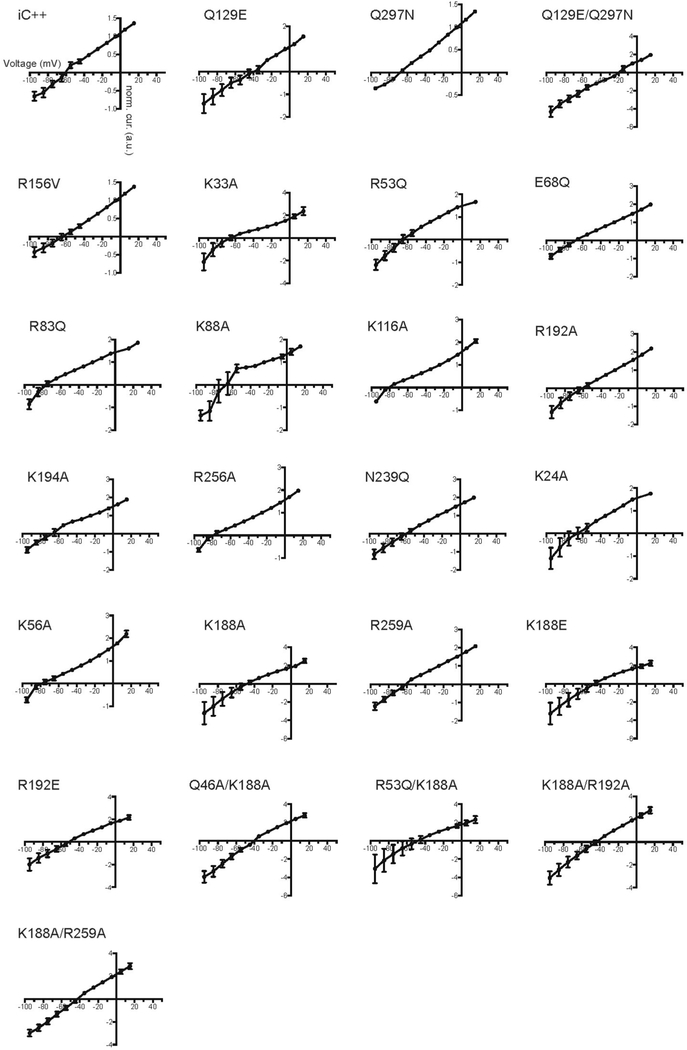
To analyse functionality of these residues in more detail, we prepared six CCS mutants, of which five were designed to interconvert structurally corresponding residues of iC++ and GtACR1 (Fig. 3e, Extended Data Figs. 6–8). Whereas all exhibited robust photocurrents, and the GtACR1 E68Q mutant (switched to the iC++ residue) maintained high anion selectivity, the corresponding mutant in iC++ (Q129E, switched to the GtACR1 residue), exhibited a depolarized reversal potential (Vrev) of −46.3 ± 6.4 mV, indicating reduced anion selectivity. Further, the double CCS mutant in iC++, Q129E/Q297N, exhibited a Vrev of −20.93 ±1.49 mV; therefore, mutating to nACR res-idues can potently reduce anion selectivity of iC++ (Fig. 3e). Indeed, under the pore-surface-electrostatic model for channelrhodopsin selectivity3,6, the Q129E mutation (even though it is GtACR1-like) would be expected to reduce the relative level of anion flux (Supplementary Discussion), as observed. Further supporting this surface-electrostatic model rather than the importance of any one specific residue in controlling GtACR1 anion selectivity, whereas Q46A showed slightly depolarized Vrev (−54.6 ±4.85 mV), both GtACR1 to iC++ mutations at the CCS (E68Q and N239Q)—neither of which were predicted to favour cation over anion flux by the pore-surface-electrostatic model—still preserved anion selectivity (Fig. 3e).
In GtACR1, 17 positively charged residues are positioned on the intracellular and extracellular surfaces, with 12 of the 17 located close to the ion-conduction pathway (Fig. 3f). Since iC++ was generated by structure-guided conversion from wild-type cation flux to designed anion flux on the basis of pore-surface electrostatics, a powerful inde-pendent confirmation of the fundamental model could potentially be found from structure-guided conversion of GtACR1 in the reverse direction from natural anion flux to designed cation flux. To test this hypothesis, we measured Vrev of 20 single and double mutants sug-gested by analysis of the GtACR1 structure to contribute to pore-surface-electrostatic electropositivity (Fig. 3g, Extended Data Figs. 6–8). Most single mutations in isolation had small effects on Vrev, signalling the presence of only moderately increased cation flux (though K188A, K188E and R192E did depolarize Vrev to −45.9 ±4.85, −47.8 ±9.15 and −53.7 ±5.48 mV, respectively). However, the double mutants (Q46A/K188A, K188A/R192A and K188A/R259A) showed yet further depolarized Vrev ( −35.2 ±2.31, −41.6 ±4.53 and −39.7 ± 1.84 mV, respectively), confirming that positively charged residues positioned in and near the intracellular pore and vestibules of the ion-conducting pathway contribute to anion selectivity in GtACR1, and demonstrating that CCRs and ACRs can be functionally interconverted, guided only by crystal structures and the pore-surface-electrostatic model.
Structure-guided engineering of FLASH
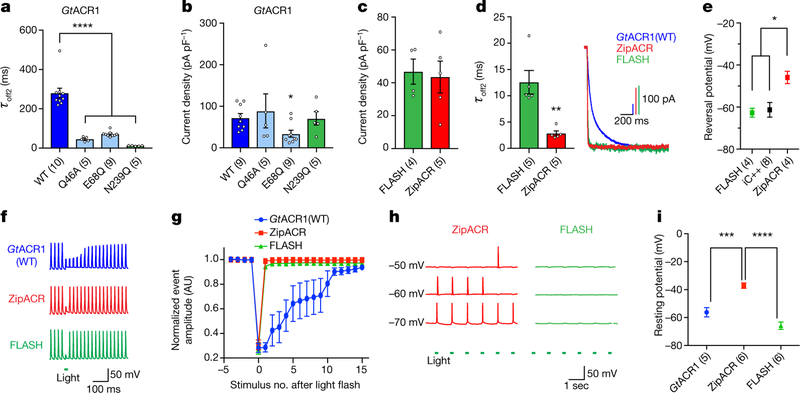
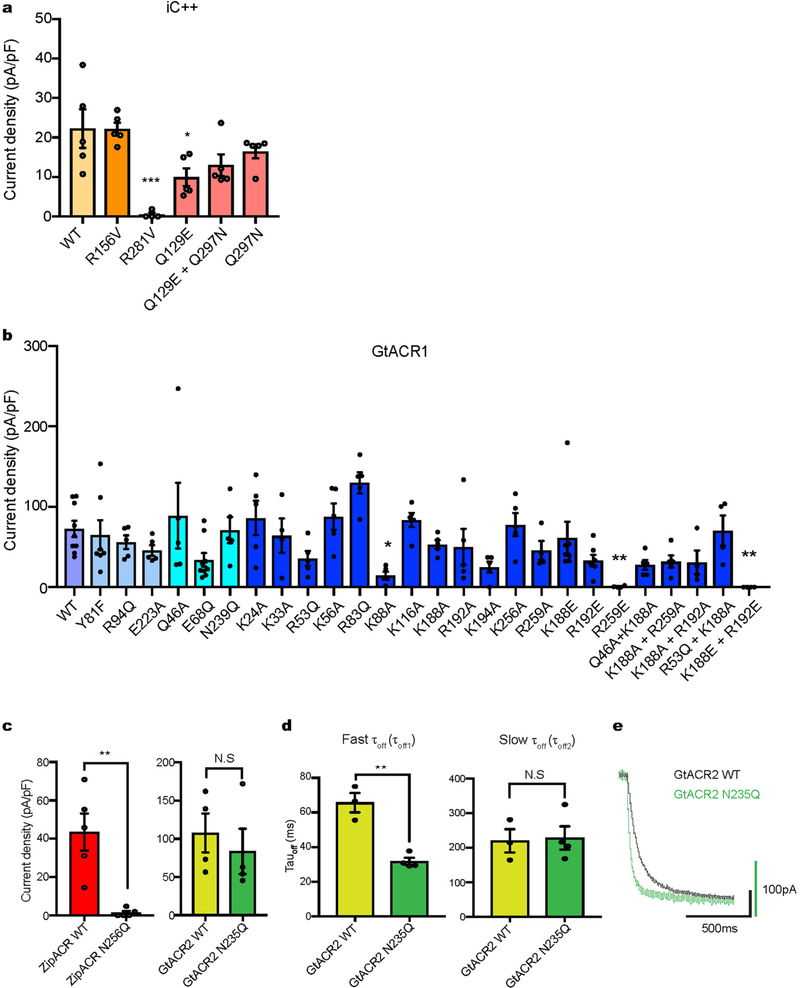
An emerging theme is that individual residues (depending on local environment) do not necessarily have identical roles in ion selectivity across channelrhodopsin families. Further illustrating this point, interactions at the CCS modulate selectivity much more potently in CCRs than in nACRs (the GtACR1 E68Q and N239Q mutants exhibit Vrev similar to the wild type; Fig. 3e). However, residues forming con-strictions tend to generally affect closing kinetics. As well as the ECS2 mutant (Fig. 2i; Y81F, R94Q, E223A), all three mutations at the CCS (Q46A, E68Q and N239Q) had powerful effects on off kinetics; most strikingly, τoff of N239Q was more than 20-fold faster than the wild type (Fig. 4a). Because this asparagine on transmembrane helix 7 is highly conserved among nACRs, we analysed this N-to-Q mutation in two other nACRs, GtACR2 and ZipACR20. Although N256Q in ZipACR was nonfunctional, GtACR2(N235Q) exhibited accelerated τoff, confirming that this structure-function relationship can be extended to other nACRs (Extended Data Fig. 6 c,d). Whereas in CCRs many strat-egies to accelerate kinetics (for higher temporal precision control of spiking) also reduce photocurrent amplitude in cells (owing to reduced operational light sensitivity9), the accelerated-decay mutants N239Q in GtACR1 and N235Q in GtACR2 both showed nearly wild-type photo-current amplitudes (Fig. 4b, Extended Data Figs. 6–8), signalling their promise as inhibitory optogenetic channels.
Fig. 4 |. Structure-guided engineering of fast and robust channel-based single-spike inhibition for optogenetics.
a, Summary of off kinetics (****P = 0.0001). b, Summary of photocurrent densities for the mutants shown in a (*P = 0.03). c, Comparison of ACR photocurrent densities (P = 0.8). d, Off kinetics (left) and traces of ACRs at −10 mV holding (right) (**P = 0.003). e, Summary of Vrev for different ACRs (*P < 0.03). f, Fast-optogenetic spike suppression by ACRs. g, Summary of depolarizing-event amplitude changes in neurons as shown in f. Light delivered at stimulus no. 0. AU, arbitrary units. h, Traces illustrating Vrestdependent spiking by ACR stimulation. i, Summary of Vrest in neurons expressing ACRs. ***P = 0.0004, ****P = 0.0001. Data are mean ± s.e.m.; one-way ANOVA with Dunnett’s test (a, i); one-way ANOVA with Tukey’s test (e); Kruskal–Wallis test with Dunn’s test (b); two-tailed t-test (c, d). Sample size (number of cells) indicated in parentheses.
To maximize performance, we further mutated GtACR1(N239Q) to R83Q, which we had found to increase photocurrents (Extended Data Figs. 6–8); we designated this GtACR1(R83Q/N239Q) double mutant FLASH (fast, light-activated anion-selective rhodopsin). Comparison to ZipACR (which has the fastest reported ACR kinetics)20 in HEK293 cells revealed that FLASH exhibited photocurrents of similar magnitude, moderately slower off kinetics (Fig. 4c, d), and a substantially different Vrev, owing to ZipACR’s depolarized reversal potential of approximately 15 mV20 (Fig. 4e). We then compared FLASH and ZipACR in cultured neurons; in contrast to GtACR1, both FLASH and ZipACR could precisely suppress individual spikes within trains up to 40 Hz (Fig. 4f, g). However, consistent with the depolarized Vrev, ZipACR-expressing neurons exhibited occasional light-induced spikes (Fig. 4h) and consistently depolarized Vrest (37.17 ±1.92 mV in the dark; Fig. 4i), relevant considerations for optogenetics.
Comparison of FLASH and ZipACR in vitro and in vivo
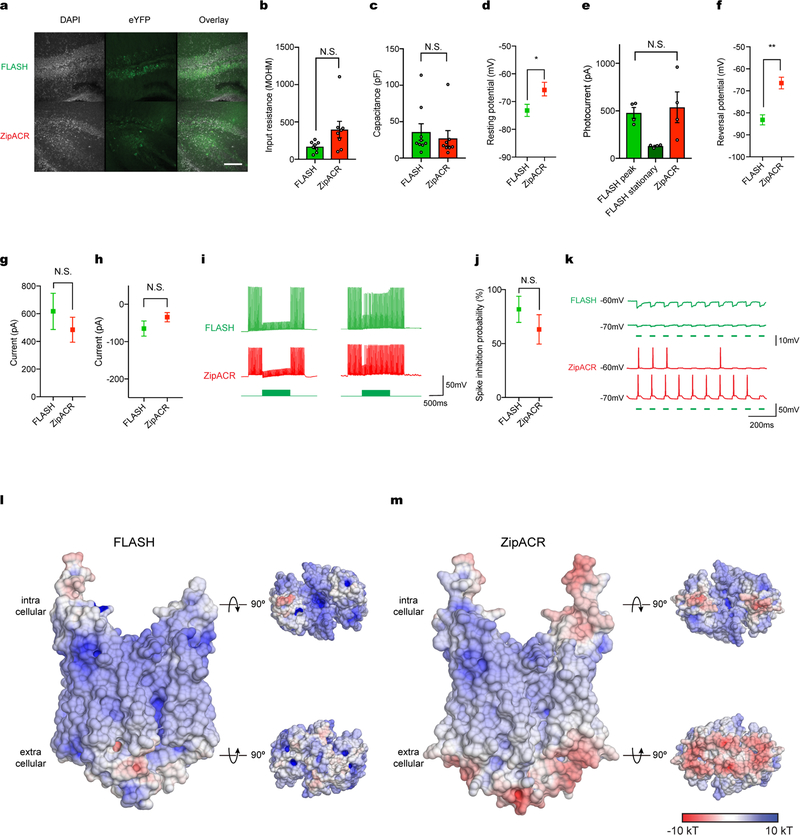
We next performed patch-clamp electrophysiology after in vivo expression. Four weeks after injection of opsin-delivering adeno-associated virus vectors (AAVs) into mouse hippocampus, FLASH and ZipACR expressed robustly in acute slices (Extended Data Fig. 9a); however, ZipACR-expressing neurons again displayed depolarized resting potentials (Extended Data Fig. 9b–d). Moreover, consistent with in vitro find-ings, whereas FLASH and ZipACR exhibited comparable photocurrents (Extended Data Fig. 9e), the ZipACR Vrev was approximately 15 mV more depolarized (Extended Data Fig. 9f). In the setting of spikes elicited by 40-Hz current injection (Extended Data Fig. 9g–k), pulsed light inhibited spikes in cells expressing either opsin, but 3 of 8 ZipACR-expressing neurons actually exhibited light-induced spikes, consistent with results from cultured neurons (Fig. 4h, Extended Data Fig. 9k).
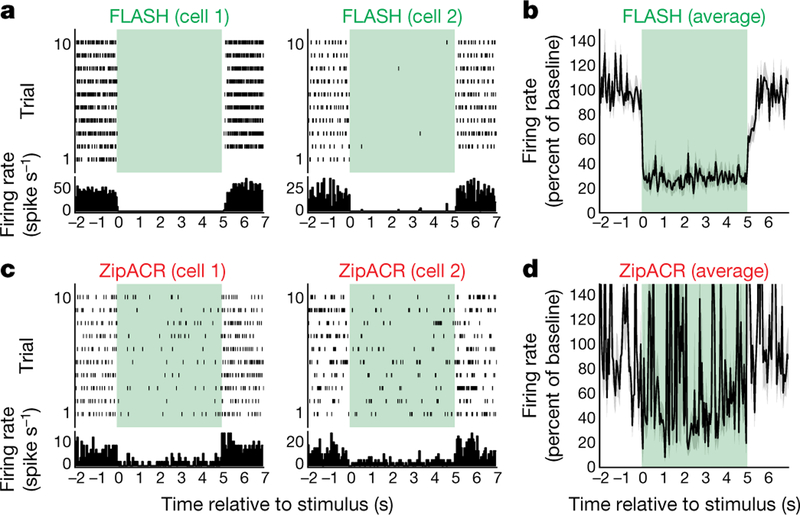
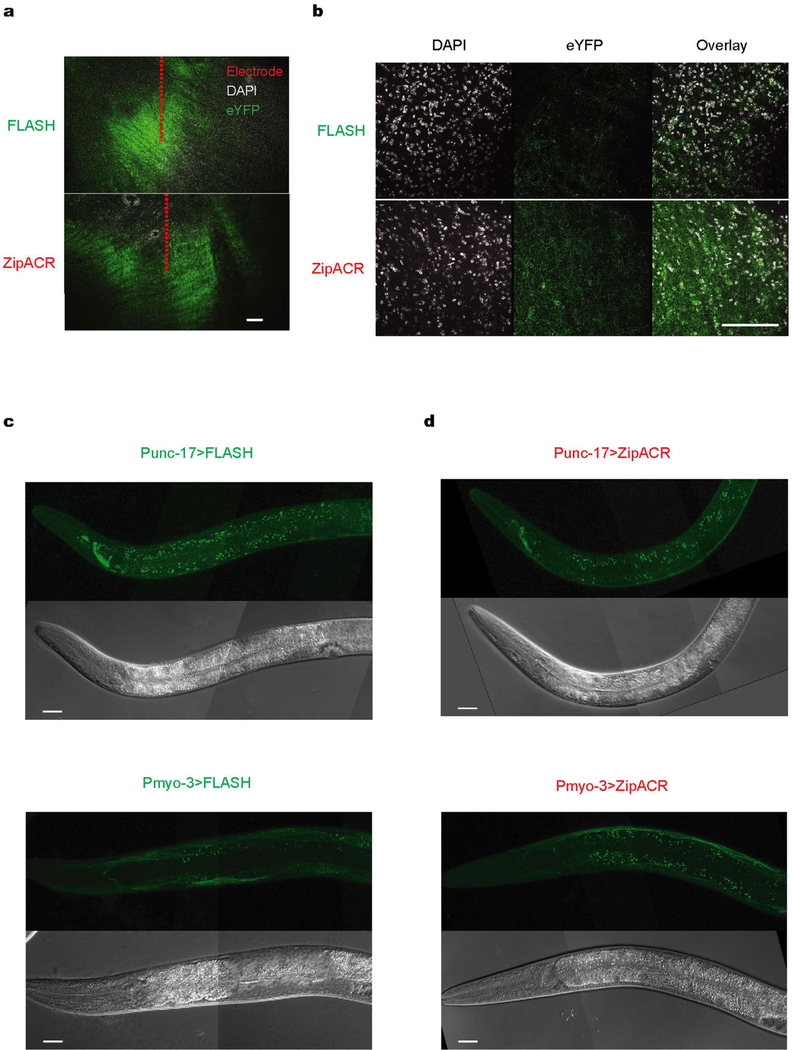
Next, we performed extracellular recording in vivo using Neuropixels probes21. We injected FLASH or ZipACR AAVs into mouse sensorimo-tor thalamus, and observed robust expression (Extended Data Fig. 10a, b). Consistent with cultured-neuron and acute-slice patch-clamp data, we observed more efficient net inhibition of spontaneous spiking in FLASH-expressing mice (Fig. 5a–d).
Fig. 5 |. Optogenetic application: in vivo electrophysiology in mouse.
a–d Raster plots, peri-event time histograms (a, c) and averaged frequency (b, d) of neuronal spiking in response to light (green area). More cells were modulated by FLASH (24/105) than by ZipACR (9/125) (n =230; one-sided Fisher’s test, P =0.0011), where modulated cells exhibited a difference in firing between the 2 s before and the 2 s after illumination (n =33; two-sided Wilcoxon test, P <0.05).
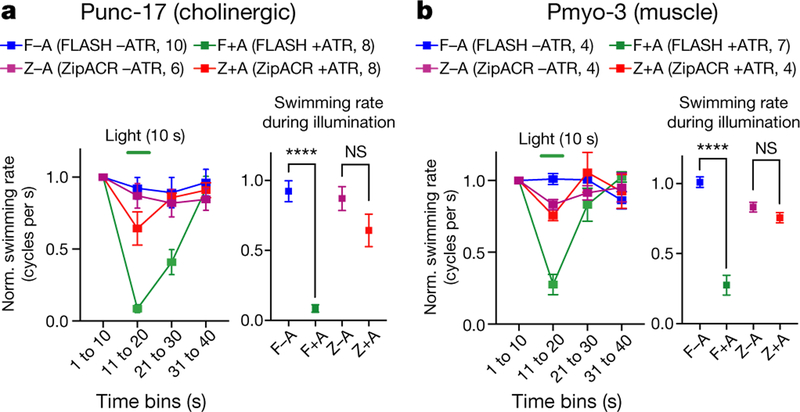
Finally, we expressed FLASH or ZipACR in muscle cells or cholinergic neurons of Caenorhabditis elegans (Extended Data Fig. 10c, d) and tested for optogenetic inhibition of behaviour. Swimming of FLASH-expressing but not ZipACR-expressing worms was almost completely eliminated following stimulation with light (Fig. 6), consistent with the mammalian data suggesting that FLASH may represent a suitable ACR for optogenetics.
Fig. 6 |. Optogenetic application: physiology and behaviour in C. elegans.
a, b, Effect of 10-s illumination (from 11 to 20 s) on swimming in animals expressing ACRs in cholinergic neurons (a) or muscle (b). Data are mean ± s.e.m. Swimming rate is normalized to the rate during the first 10 s. Data are mean ± s.e.m.; two-tailed t-test, ****P <0.0001. Sample size (number of animals) indicated in parentheses. NS, not significant.
Discussion
In this work, determination of multiple crystal structures and structure-guided analyses have led to deeper understanding of the chan-nelrhodopsin pore, and to the creation of new tools for optogenetics. Structural and computational analyses of the CCS and ECS2 suggested residues forming constrictions that could be important for kinetics, which led to structure-guided development of FLASH, a fast ACR for high-speed cell-activity suppression, tolerability and efficacy at practical expression levels, hyperpolarized Vrev due to high anion selectivity, and fast-off kinetics. Though the more-depolarized Vrev of ZipACR was consistent with these analyses, the structural basis for this property had remained unclear. However, our structures inform homology models of ZipACR and FLASH (Extended Data Fig. 9l, m) that suggest that the extracellular surface of FLASH is considerably more electropositive than that of ZipACR, further supporting the importance of residues at and near the vestibule of the ion-conducting pathway in deterring cation flux and controlling Vrev of ACRs (Extended Data Fig. 9l, m).
We engineered FLASH by improving the kinetics of GtACR1—just one class of channel property that might be advanced using the richness of structural information on iC++ and GtACR1. Structural and functional analyses not only independently confirmed the channelrhodop-sin ion-selectivity mechanism, but also suggested a rule for tuning the distinct parameter of photocurrent magnitude. High ion conductance in channelrhodopsins may depend on the overall valence (relative to the conducted species) and distribution of charged residues inside the pore. For example, although both iC++ and GtACR1 are highly chlo-ride-selective, iC++ (with many positively charged residues inside the pore) exhibits lower conductance and reduced photocurrent magnitude in comparison to GtACR1 (which has its positively charged residues distributed towards the vestibules rather than inside the pore). The latter configuration may reduce the tendency of anions to adhere to the inner surface of the pore (Supplementary Discussion), and thereby, for a given ion selectivity (in this case for anions), powerfully enhance photocurrent magnitude. An inverted valence form of this rule could also apply to CCRs, and straightforward application of the rule could help improve engineered conductances in diverse categories of chan-nelrhodopsins, as well as facilitate sequence-based screening for new channelrhodopsins with high conductance from natural sources.
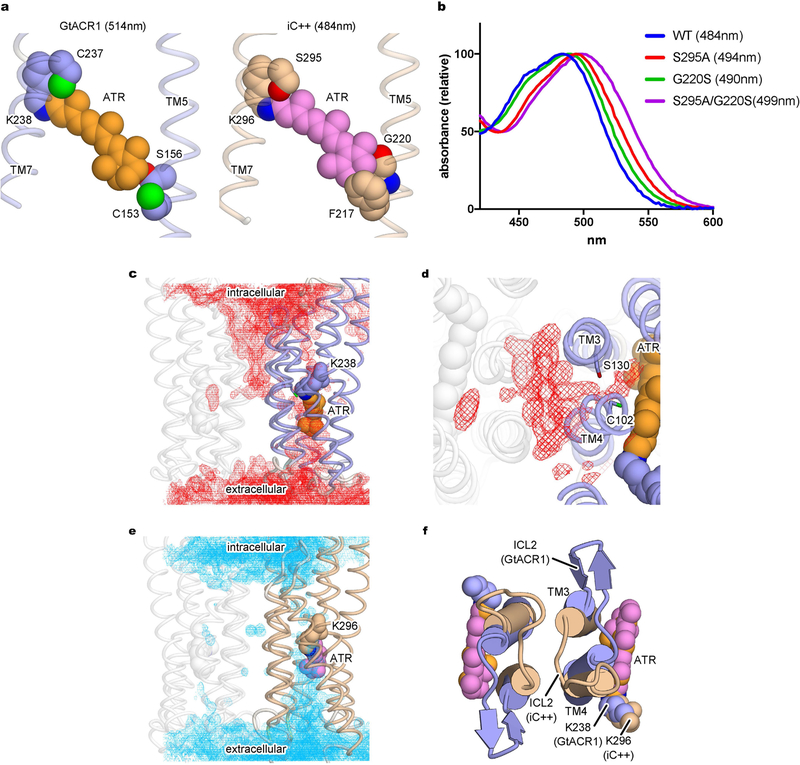
These structures also point to strategies to modulate ACR absorption spectra, and hence colour selectivity for optogenetics. The crystal structures revealed both similarities and differences in polarity properties of the retinal-binding pocket (RBP) of iC++ and GtACR1. Whereas residues surrounding the polyene of retinal are relatively well conserved, GtACR1 contains more polar side chains (for example, Cys153 and Ser156) near the β-ionone ring, which presumably contribute to the red-shifted spectrum (peak absorbance wavelength (λmax) of iC++ and GtACR1 are 484 and 514 nm, respectively) (Extended Data Fig. 11a). Supporting the importance of polarity near the β-ionone ring, the S297A mutation in iC++ caused a 10-nm red-shift in spectrum (Extended Data Fig. 11b), similar to C237A, the corresponding mutation in GtACR111. Further, the G220S mutation to the corresponding GtACR1 residue near the β-ionone in iC++ caused a 6-nm red-shift (Extended Data Fig. 11b). These two mutations are additive; our iC++(G220S/S295A) double mutant exhibited a 15-nm red-shift compared to wild-type iC++ (Extended Data Fig. 11b), providing proof of principle for structure-guided red-shifting of channel rhodopsin function.
Molecular dynamics simulations also demonstrated that hydration of the RBP differs between iC++ and GtACR1; in GtACR1, owing to divergence at ICL211 (Extended Data Fig. 11c), water molecules can penetrate deeply into the dimer interface from the intracellular side and access the RBP from between Cys102 and Ser130 (Cys128 and Asp156 in Chlamydomonas reinhardtii ChR2) (Extended Data Fig. 11d). Structure-function insights can also help determine which useful prop-erties are transferable between dACRs and nACRs. Illustrating how key residues may have different roles in distinct local contexts, we found that the CCS was more important for selectivity in iC++, but had a larger influence on kinetics in GtACR1 (Figs. 3e, 4a).
Additional work is needed to fully understand these and other intricacies, although proof of principle for newly enabled development of next-generation optogenetics has now been established by the bidirectional interconversion of ACRs and CCRs, in generating red-shifted channelrhodopsins, and in the creation of FLASH. More broadly, this study provides a framework for understanding light-induced ion conduction, by providing insights into principles governing selectivity, photocurrent magnitude, kinetics and action spectrum relevant to all channelrhodopsins.
Methods
Sample sizes were determined based on prior literature and best practices in the field; no statistical methods were used to predetermine sample size.
Cloning, protein expression, and purification.
The previously described iC++ construct6 was used for crystallography after introducing a point mutation (N61Q) to remove an N-glycosylation site. A FLAG tag followed by the 3C protease cleavage site was added to the N terminus and an enhanced GFP (EGFP) with a His10 tag and the 3C site was attached to the C terminus. The finalized iC++ crystallization construct was expressed in Sf9 cells (Expression Systems, identified by the vendor, not tested for mycoplasma contamination) using the BestBac (Expression Systems) baculovirus system. Cell cultures were grown to a density of 4 ×10⁶ cells ml−1, infected with iC++ baculovirus, and were shaken at 27 °C for 18 h. Then, 20 μM all-trans retinal (ATR) was added to the culture and incubation continued for a further 54 h, and cell pellets were harvested and stored at −80 °C. To purify iC++, the pellets were lysed with a hypotonic lysis buffer (20 mM HEPES pH 7.5, 1 mM EDTA and protease inhibitors). The cell debris was then homogenized with a glass dounce homogenizer in a solubilization buffer (1% n-dodecyl-β-d-maltopyrano-side (DDM), 0.06% cholesteryl hemisuccinate tris salt (CHS), 20 mM HEPES pH 7.5, 500 mM NaCl, 20% glycerol, 10 mM imidazole, and protease inhibitors) and solubilized for 2 h at 4 °C. The insoluble cell debris was removed by centrifugation (18,000 r.p.m., 25 min), and the supernatant was mixed with the Ni-NTA agarose resin (Qiagen) for 2 h at 4 °C. The Ni-NTA resin was collected into a glass chro-matography column, washed with 20 column volumes of a wash buffer (0.05% DDM, 0.01% CHS, 20 mM HEPES pH 7.5, 500 mM NaCl, 20% glycerol and 20 mM imidazole) and was eluted in a wash buffer supplemented with 250 mM imidazole. The Ni-NTA eluent was then supplemented with 2 mM CaCl2 and was loaded over anti-FLAG M1 resin over 1 h. The protein was then washed with a Flag wash buffer (0.05% DDM, 0.01% CHS, 20 mM HEPES pH 7.5, 300 mM NaCl, 5% glycerol and 2 mM CaCl2) and eluted with a Flag elution buffer (0.05% DDM, 0.01% CHS, 20 mM HEPES pH 7.5, 300 mM NaCl, 5% glycerol, 0.2 mg ml−1 Flag peptide and 3 mM EDTA). Following the cleavage of Flag tag and EGFP–His10 by His-tagged 3C protease, the sample was reloaded onto the Ni-NTA column to capture the cleaved EGFP–His10. The flow-through containing iC++ N61Q was collected, concentrated and purified through gel-filtration chromatography in a final buffer (100 mM NaCl, 20 mM HEPES pH 7.5, 0.05% DDM and 0.01% CHS). Peak frac-tions were pooled and concentrated to 15 mg ml−1.
Crystallization.
Purified iC++ protein was crystallized using LCP method as described previously2. Best crystals were obtained in 28% PEG 350MME, 100 mM Tris pH 8.5, 100 mM ammonium phosphate dibasic, and 7–8% formamide for pH 8.5, and, 30% PEG 350MME, 100 mM sodium phosphate pH 6.5, and 200 mM sodium malonate for pH 6.5. All crystals were harvested using micromesh loops (MiTeGen), and were flash-cooled in liquid nitrogen without any additional cry-oprotection for data collection.
Data collection and structure determination.
X-ray diffraction data of iC++ at pH 8.5 and pH 6.5 were collected at Advanced Photon Source GM/CA-CAT beamline 23ID-B and 23ID-D, and SPring-8 BL32XU, respectively. Small wedge data, each consisting of 5–20°, were collected from single crystals at wavelengths of 1.03 and 1.00 Å, respectively. Collected datasets (58 datasets for pH 8.5 and 442 datasets for pH 6.5) were processed automatically using KAMO22 (https://github.com/keitaroyam/yamtbx/blob/master/doc/kamo-en.md). Each dataset was indexed and integrated using XDS23, and classified using the correla-tion coefficients of the normalized structure amplitudes between datasets. A total of 16 (pH 8.5) and 27 (pH 6.5) datasets in best cluster were scaled and merged using XSCALE. The best clusters were found from those giving lower inner-shell Rmeas and higher outer-shell CC1/2 values. The structure was determined by molecular replacement with the program Phaser24, using the cation channelrhodopsin chimaera C1C2 (PDB ID: 3UG9) as the search model. The resultant structure was iteratively refined in Refmac525 and Phenix26, and manually rebuilt in Coot27. The final models of iC++ at pH6.5 and pH8.5 contained 97.1, 2.9 and 0.0%, and 96.0, 4.0, and 0.0% in the favoured, allowed, and outlier regions of the Ramachandran plot, respectively. Final refinement statistics are summarized in Extended Data Fig. 1e. All molecular graphics figures were prepared with Cuemol (http://www.cuemol.org).
Hippocampal neuron and HEK293 cell electrophysiology.
Recordings in hippocampal cultured neurons were performed 4–6 days after transfection in Tyrode’s solution: 150 mM NaCl, 4 mM KCl, 2 mM CaCl2, 2 mM MgCl2, 10 mM glucose and 10 mM HEPES-NaOH pH 7.4. Intracellular solution contained 140 mM K-gluconate, 10 mM HEPES-KOH pH 7.2, 10 mM EGTA and 2 mM MgCl2. Signals were amplified and digitized using the AxoPatch200B and DigiData1400 (Molecular Devices). The Spectra X Light engine (Lumencor) served as a light source, and 470/15 and 513/15 filters were used for blue and green light respectively, followed by coupling into a Leica DM LFSA microscope. Patch pipettes (3–6 MΩ) were pulled using a P2000 micropipette puller (Sutter Instruments). HEK293 cells were cultured as previously described6. Cells were transfected using Lipofectamine 2000 (Life Technologies). Recordings in HEK293 cells (Thermo Fisher, identified by the vendor, not tested for mycoplasma con-tamination) were performed 24–48 h after transfection in Tyrode’s solution and intracellular solution as described above.
Voltage clamp recordings in neurons and HEK cells were performed in the presence and absence of bath-applied tetrodotoxin (TTX, 1μM; Tocris), respectively. Although previous work (while reporting the same depolarized Vrev for ZipACR that we observed) had not also reported an effect on neuronal Vrest20, an unusual promoter was used in that work20 (from the ubiquitin gene, not typically used for optogenetics owing to relative weakness of expression). Here a stronger promoter (widely used in optogenetics, from CaMKIIα) was used in vitro. Likewise for in vivo expression in mammalian brain tissue, to match typical conditions for practical optogenetics we constructed an adeno-associated viral vector (AAV) carrying the genes encoding FLASH or ZipACR fused to enhanced YFP (eYFP) and a membrane-trafficking sequence (TS)28, under the control of the CaMKIIα promoter. For reversal potential measurements in vitro, cells were held at resting potentials from −95 mV to +15 mV in steps of 10 mV, with 1.0 mW mm−2 light (470 nm and 513 nm for iC++ and GtACR1, respectively) delivered for 1.5 s. Channel kinetics and photocurrent amplitude were measured at −10 mV and −70 mV holdings, respectively. The same light stimulus used for reversal potential measurement. Liquid junction potentials (LJPs) were corrected using the Clampex build-in LJP calculator as previously described6. Peak photocurrent amplitudes were normalized to each cell’s membrane capacitance, which was calculated from the Clampex built-in membrane test. Current clamp measurements in neurons were conducted in the presence of glutamatergic synaptic blockers: 6-cyano-7-ni-troquinoxaline-2,3,-dione (CNQX; 10 μM, Tocris) for AMPA receptors and D(−)-2-amino-5-phosphonovaleric acid (APV; 25 μM, Tocris) for NMDA receptors. For photoinduced spike suppression, neurons were stimulated by injection of 5 ms of 500 pA current at 40 Hz, and 10-ms light pulses of 513 nm light at 1.0 mW mm−2 were applied during the recording. For photoinduction of spikes in ZipACR and FLASH expressing neurons, 10-ms light pulses of 513 nm light at 1.0 mW/mm2 were applied at 10 Hz. Analyses of electrophysiology results were performed as previously described3. Statistical analysis was performed with a two-tailed t-test or a one-way ANOVA, and a Kruskal–Wallis test for non-parametric data, using Prism 7 (GraphPad) software.
pH titration.
To investigate pH-dependency of absorption spectrum of iC++, ∼3 μM protein was solubilized in 6-mix buffer (150 mM NaCl, 4 mM KCl, 10 mM glucose, 2 mM CaCl2, 2 mM MgCl2, 6-mix buffer (10 mM citrate, 10 mM MES, 10 mM HEPES, 10 mM MOPS, 10 mM CHES, 10 mM CAPS) pH 8.5, 0.05% DDM, 0.01% CHS). Then, pH was decreased by addition of concentrated HCl to pH 3.0. Absorption spectra measured with a UV-visible spectrometer (V-2400PC, SHIMADZU) for every ~0.5 pH unit change.
Laser flash photolysis.
Transient absorption changes after photo-excitation were investigated by laser flash photolysis. iC++ was solubilized in 150 mM NaCl, 10 mM HEPES (pH 7.4, NaOH), 4 mM KCl, 10 mM glucose, 2 mM CaCl2, 2 mM MgCl2, 0.05% DDM, 0.01% CHS. Optical density of the suspension was adjusted to be 0.8– 0.9 by dilution (~8.5 μM protein concentration). The sample solution was illuminated with a second harmonic generation by a nano-second pulsed Nd3+:YAG laser (λ= 532 nm, INDI40, Spectra-Physics) with the pulse energy of 3.8 mJ cm−2·pulse. The transient absorption spectra of iC++ after laser excitation were obtained by measuring the intensity of white light passed through the sample before and after laser excitation at λ=300–700 nm with an ICCD linear array detector (C8808–01, Hamamatsu). To increase signal-to-noise ratio, 90 identical spectra were averaged and singular-value-decomposition (SVD) analysis was applied. Time evolution of transient absorption change at specific wavelength after photo-excitation was measured by monitoring the change in intensity of monochromated output of a Xe arc lamp (L9289–01, Hamamatsu Photonics) passed through the sample solution by a photomultiplier tube (R10699, Hamamatsu Photonics) equipped with a notch filter (532 nm, bandwidth = 17 nm, Semrock) to avoid unnecessary detection of scattered pump pulse. The signals were monitored and stored by a digital oscillo-scope (DPO7104, Tektronix). To increase signal-to-noise ratio, 50–100 identical signals were averaged.
Measurement of UV absorption spectra.
Protein absorbance spectra were measured with an Infinite M1000 microplate reader (Tecan Systems Inc.) using 96-well plates (Thermofisher Scientific). The GtACR1 samples were suspended in a buffer containing 100 mM NaCl, 0.05% DDM, 0.01% CHS, and 20 mM sodium citrate, sodium acetate, sodium cacodylate, HEPES, Tris, CAPSO, or CAPS. The pH was adjusted from pH 4 to pH 10 by the addition of NaOH or HCl.
Molecular dynamics simulations.
System setup for molecular dynamics simulations.
Molecular dynamics simulations were performed for iC++ and GtACR1. Simulations of Gt ACR1 were initiated from coordinates closely resembling chains C and D of PDB structure 6CSM (that is, from a slightly earlier refine-ment). Simulations of iC++ were initiated from coordinates closely resembling the structure described in this manuscript. For both GtACR1 and iC++, additional short simulations of the final refined structures were performed to ensure that there were no significant differences in the dynamics. All proteins were simulated as dimers. We performed five replicates of simulations for all three systems. For each replicate, initial atom velocities were assigned randomly and independently. Prime (Schrödinger) was used to model missing side chains and loops, and neutral acetyl and methylamide groups were added to cap protein termini. Titratable residues remained in their dominant protonation state at pH 7, as determined using PropKa, except that in GtACR1, Asp234 and Glu68 were protonated as is consistent with the spectroscopy data in the accompanying paper11. Dowser software was used to add waters to cavities within the protein structure29. The prepared protein structures were aligned to the Orientation of Proteins in Membranes (OPM) structure for PDB 3UG930. The aligned structures were then inserted into a pre-equilibrated palmitoyl-oleoyl-phosphatidylcholine (POPC) bilayer using Dabble, a simulation preparation software31. Sodium and chloride ions were added to neutralize each system at a concentration of approximately 150 mM. Bilayer dimensions were chosen to maintain at least a 30 Å buffer between protein images in the x–y plane and a 20 Å buffer between protein images in the z direction. Final system dimensions were approximately 93 × 93 × 115 Å3. Simulation times in ns for each replicate are 1749, 1718, 1741, 1673, 1803 for iC++; and 2296, 2285, 2247, 1128 and 2194 for GtACR1.
Molecular dynamics simulation protocols.
We used the CHARMM36m force field for proteins, lipids, and ions, and the TIP3P model for waters32–36. Parameters for retinal were obtained through personal communication with Scott Feller37. We performed simulations using the Compute Unified Device Architecture (CUDA) version of particle-mesh Ewald molecular dynamics (PMEMD) in AMBER on one or two graphics processing units (GPUs)38. Simulations were performed using the AMBER16 software39. Three rounds of minimization were performed, each consisting of 500 iterations of steepest descent minimization, followed by 500 iterations of conjugate gradient descent minimization, with harmonic restraints of 10.0, 5.0, and 1.0 kcal∙mol−1∙Å−2 placed on the protein and lipids in respective rounds. Systems were heated from 0K to 100K in the NVT ensemble over 12.5 ps and then from 100K to 310K in the NPT ensemble over 125 ps, using 10.0 kcal∙mol−1∙Å −2 harmonic restraints applied to lipid and protein heavy atoms. Systems were then equilibrated at 310K in the NPT ensemble at 1 bar, with har-monic restraints on all protein heavy atoms tapered off by 1.0 kcal∙mol−1 ∙Å−2 starting at 5.0 kcal∙mol−1∙Å−2 in a stepwise fashion every 2 ns for 10 ns and then by 0.1 kcal∙mol−1∙Å−2 in a stepwise fashion every 2 ns for 20 ns. Production simu-lations were performed in the NPT ensemble at 310K and 1 bar, using a Langevin thermostat for temperature coupling and a Monte Carlo barostat for pressure cou-pling. These simulations used a 4-fs time step with hydrogen mass repartitioning40. Bond lengths to hydrogen atoms were constrained using SHAKE. Simulations used periodic boundary conditions. Non-bonded interactions were cut off at 9.0 Å, and long-range electrostatic interactions were computed using particle-mesh Ewald (PME) with an Ewald coefficient of approximately 0.31 Å and an interpolation order of 4. The FFT grid size was chosen such that the width of a grid cell was approximately 1 Å.
Analysis protocols for molecular dynamics simulation.
Trajectory snapshots were saved every 200 ps during production simulations. The AmberTools15 CPPTRAJ package was used to reimage and centre trajectories41. Simulations were visualized and analysed using Visual Molecular Dynamics (VMD)42. Water density maps were generated using an in-house Python script. Frames representing every 1 ns of simulation, excluding the first 500 ns, were used as input. All r.m.s.d. and atom distance plots were produced using in-house scripts with VMD’s python modules. All histograms of atom-to-atom distances were calculated for frames representing every 1 ns of simulation, excluding the first 100 ns, from all relevant simulations.
Determining the relative binding affinities of chloride and phosphate.
To determine the relative binding affinity of phosphate and chloride, we built two systems: one that contained 150 mM chloride and another in which all chlorides were removed and half were replaced with HPO42−, the most relevant species of inorganic phos-phate at physiological pH (especially for one that would be coordinated with pos-itively charged residues). Otherwise the systems were identical. These systems were prepared following the protocol described above, except that the structure of iC++ to be deposited in the PDB was used instead of an earlier refinement. Partial charges and bonded parameter terms for phosphate were obtained through CGenFF43, but we increased the Lennard Jones radii of the phosphate oxygens by 0.5 Å to prevent the aggregation of phosphates and sodium into a crystal, following precedent in the AMBER literature44. For the chloride system, we carried out 10 simulations of lengths 376, 982, 976, 980, 994, 986, 441, 991, 488, and 401 ns. For the phosphate system, we carried out 7 simulations of length 917, 890, 980, 812, 916, 944, and 970 ns. In our analysis, we aligned the protein on its transmembrane helices, and considered the binding pocket to be occupied if the centre of a chlo-ride or phosphate is present within 4 Å of the modelled position (corresponding to the sphere in Extended Data Fig. 5e). We considered the binding site in each monomer independently.
Stereotactic surgeries.
All mouse experiments conformed to guidelines established by the National Institutes of Health and were conducted under protocols approved by the Stanford Administrative Panel on Laboratory Animal Care (protocols #11414). All mice were group-housed in a light-regulated colony room (lights on at 07:00, off at 19:00), with food and water available ad libitum. Wild-type male and female C57BL/67 mice were obtained from Jackson Laboratory.
All stereotactic surgeries were performed with mice under isoflurane anaesthe-sia (4% initially, maintained at 2–3%) with regular monitoring for stable respiratory rate and absent tail pinch response. The scalp was shaved and mice were placed in the stereotactic apparatus and a heating pad was used to prevent hypothermia. All coordinates are measured in millimetres from bregma as defined45.
A midline incision was made to expose the skull and small craniotomies were made above the injection sites using a Meisinger Carbide Burr size ¼. All virus dilu-tions were performed in ice-cold PBS and all viruses were produced at the Stanford Gene and Viral Vector Core. Virus injections were delivered with a 10-μl syringe (World Precision Instruments) and 33-gauge bevelled needle (World Precision Instruments), injected at 100 nl min−1 using an injection pump (World Precision Instruments). Following injection, the injection needle was held at the injection site for 10 min then slowly withdrawn. Mice were administered 0.5–1.0 mg kg−1 subcutaneous buprenorphine-SR (ZooPharma) approximately 30 min before the end of the surgery for post-operative pain management.
For acute slice recordings, mice were injected bilaterally in the CA1 (ML: ±1.6, AP: −2.5, DV: −1.5) and DG (ML: ±1.6, AP: −2.5, DV: −2.1) regions of the hippocampus. At each coordinate, 1,000 nl of virus was delivered at a titer of 6.75 ×10¹² genome copies (gc)/ml. Four C57BL/67 mice were injected with AAV8-CaMKIIa-ZIPACR-eYFP, and four C57BL/67 mice were injected with AAV8-CaMKIIa-FLASH-eYFP.
For optrode recordings, mice were injected unilaterally in thalamus (ML: +1.25, AP: −1.3, DV: −3.5 and ML: +1.4, AP: −2.4, DV: −3.3) and hippocampus (ML: +1.25, AP: −1.3, DV: −1.75 and ML: +1.4, AP: −2.4, DV: −1.75). At each thalamus site, 1,000 nl of virus was delivered and at each hippocampus site 500 nl of virus was delivered. Mice received either AAV8-CaMKIIa-ZIPACR-eYFP or AAV8-CaMKIIa-FLASH-eYFP diluted to a concentration of 6.74 ×10¹² gc/ml. Mice were implanted with a 200-µm core diameter, 0.39-NA fibre (ThorLabs: CFMLC12L05) dorsal to the thalamus at a 30-degree angle (ML: +3.5, AP: −1.9, DV: −2.4). Mice were affixed with a headbar, implanted with a reference electrode, and the skull encased in a clear, UV-curing resin. Two weeks post-virus injec-tion, an acute craniotomy was drilled over the thalamus and the acute recording electrode implanted. We recommend for safe and effective expression of ACRs (including FLASH) a viral titer of <2 ×10¹² gc/ml, and expression time of 2–4 weeks post injection.
Slice electrophysiology.
Acute slice recordings were performed 4−5 weeks after virus injection. Coronal slices 300 μm in thickness were prepared after intracar-dial perfusion with ice-cold N-methyl-d-glucamine (NMDG) containing cutting solution: 93mM NMDG, 2.5 mM KCl, 25 mM glucose, 1.2 mM NaH2PO4, 10 mM MgSO4, 0.5 mM CaCl2, 30 mM NaHCO3, 5 mM Na ascorbate, 3 mM Na pyruvate, 2 mM thiourea and 20 mM HEPES pH 7.3–7.4. Slices were incubated for 12 min at 32–34 °C, and then were transported to room temperature oxygenated artificial cerebrospinal fluid (ACSF) solution: 124 mM NaCl, 2.5 mM KCl, 24 mM NaHCO3, 2 mM CaCl2, 2 mM MgSO4, 1.2 mM NaH2PO4, 12.5mM glucose and 5mM HEPES pH 7.3–7.4. The ACSF also contained synaptic transmission blockers 25 μM APV and 10 μM CNQX for recordings. Recording patch pipettes contained the following intracellular solution: 140 mM K-gluconate, 10 mM HEPES pH 7.2, 10 mM EGTA and 2 mM MgCl2.
Cell input resistance and capacitance were calculated after a −10-mV voltage step. Then, the mode was switched to current clamp to determine the resting potential of each cell and the holding current to keep the cell’s membrane potential at −70 mV, followed by stepwise current injection to determine the threshold current for spike generation. For all experiments, 513-nm light at 1 mW mm−2 was used. For single-spike suppression, neurons were stimulated by 40-Hz, 5-ms pulsed current injection and 10-ms light was delivered. For multiple spike suppression, neurons were illuminated with 1 s of 10-ms pulsed light at 40 Hz, to match the elec-trical stimulation. For photo-induction of spikes in ZipACR and FLASH express-ing neurons, 30-ms light pulses were applied at 10 Hz without current injection. Then, the mode was switched back to voltage clamp and Vm was held at −10 mV, whereupon 1-s light was delivered for measuring photocurrent magnitude.
In vivo electrode recording.
Extracellular electrophysiological data were recorded using a Neuropixels Phase 3 Option 3 probe, referenced using a Pt–Ir wire inserted into the anterior cortex. Recordings were performed targeting the centre of the virally injected area in the thalamus. The electrode was coated with DiI (ThermoFisher) to reconstruct the tract. 384 channels were acquired at 30 kHz. Following common average referencing, well-isolated single units were identified using KiloSort and Phy. ZipACR and FLASH were activated using continuous 532-nm illumination (for 5 s, at 5 mW at the fibre tip) delivered via an optical fibre (200 μm) placed at the surface of the surgery area. The optical fibre was con-nected to a patch cable coupled to a green Laser Diode Fibre Light Source (Doric lenses). Changes in firing rate relative to the light onset were analysed using custom Python scripts.
Histological procedures.
Mice were deeply anesthetized with sodium pentobarbi-tal and transcardially perfused with 4% paraformaldehyde. Brains were removed, post-fixed for 24 h and sectioned at 100 µm at room temperature on a vibratome. Slides coverslipped with Vectashield HardSet AntiFade mounting media with DAPI (Vector Laboratories). Images were taken using a Leica DM6000 B confocal laser microscope.
C. elegans experiments.
Genes encoding opsin–GFP were placed under the muscle-specific myo-3 promoter or under the cholinergic motor neuron specific unc-17 promoter, and lines carrying extrachromosomal arrays were generated using unc-119 rescue. C. elegans were grown in the presence or the absence of ATR, as described previously46, but with 20 μM ATR. For optogenetic manipu-lation of swimming, a 10-s epoch of the animal swimming was first recorded as a baseline, followed by 10 s of illumination and then 20 s without light. For light delivery, Zeiss FluoArc 120W/45C VIS mercury lamp with a Zeiss Axioplan 2 microscope using a 546/12 excitation filter (estimated power =43.1 mW cm−2) was used. All experiments were randomized and experimenters were blinded to allocation during experiment and outcome assessment.
Reporting summary.
Further information on research design is available in the Nature Research Reporting Summary linked to this paper.
Data availability.
The protein coordinates and atomic structure factors of iC++ at pH 8.5 and pH 6.5 have been deposited in the Protein Data Bank (PDB) under accession number 6CSN (pH 8.5) and 6CSO (pH 6.5), respectively. The raw dif-fraction images have been deposited in the SBGrid data repository (ID: 570 for pH 8.5 and 571 for pH 6.5). All other data are available from the corresponding authors upon reasonable request.
Extended Data
Extended Data Fig. 1 |. Spectroscopic and structural characterization of iC++.
a, Sequence alignment. iC++ mutations and corresponding residues in the other opsins are highlighted. b, c, Transient absorption spectra of iC++ (b) and time traces of the absorption changes (c) at specific probe wavelengths. d, Photocycle schematic for iC++, determined from analysis of results shown in b and c. e, Overlay of the M-intermediate state measured in b (blue) and a flash-induced photocurrent generated by iC++ in a HEK293 cell (red) by flashing 100 μs, 470 nm light at 2 mW mm−2. The electrophysiology experiment was repeated independently 4 times with similar results, and the spectroscopy experiment was performed once. f, Table describing data collection and refinement statistics of iC++ in pH 6.5 and pH 8.5 conditions. Datasets were collected from 16 (pH 8.5) and 27 (pH 6.5) crystals. Values in parentheses are for the highest resolution shell.
Extended Data Fig. 2 |. Structural basis of pH dependence.
a, Bright-field images of iC++ crystals formed under pH 6.5 (top) and pH 8.5 (bottom) conditions. b, Overlay of iC++ crystal structures at pH 6.5 (cyan) and pH 8.5 (orange). c, Comparison of calculated mean electron density of ATR atoms (red circle) to the distribution corresponding to protein residues (box-and-whisker plots) at pH =6.5 (cyan) or 8.5 (orange). Note lower mean electron density of ATR at pH 8.5 despite higher electron density of the overall structure. Mean values at atomic positions of the 2 Fo − Fc map were calculated using phenix.get_cc_mtz_pdb in Phenix26. Box plots show median (centre), first and third interquartile ranges, minimum and maximum. Sample size (number of residues used in calculation), n =282 for pH 8.5, and 283 for pH 6.5. Electron-density values were normalized in the model region, and maps were generated at 3.2 Å resolution. d, e, Absorption spectrum of iC++ measured over the range from pH 3.0 to pH 8.5 (d), and 483 nm and 386 nm absorbance traces collected across the measured pH range (e). Absorbance was measured for every 0.5 pH unit change while the sample was titrated by HCl. Note increased absorption at 386 nm and decreased absorption at 483 nm under alkaline conditions.
Extended Data Fig. 3 |. Electron densities of side chains and putative water molecules of iC++ structure at pH 8.5.
Shown are 2Fo − Fc maps (blue mesh, contoured at 1σ) for ten introduced mutations, and for two putative water molecules as labelled. All ten mutations have well-resolved electron densities to reliably position structural features, which support the interpretation of the roles of introduced mutations.
Extended Data Fig. 4 |. Ion-conducting pathways.
Ion-conducting pathways of C1C2 (left), GtACR1 (middle) and iC++ (right). Black meshes represent the extracellular and intracellular vestibules. Red dashed circles represent ECSs. Note that EV1 and EV2 of iC++ are structurally more similar to the extracellular vestibules of GtACR1 than those of C1C2.
Extended Data Fig. 5 |. Computational and crystallographic estimation of the potential chloride-binding site in iC++ at pH 8.5.
a, The r.m.s.d. of the atomic positions of α-carbons between the crystallographic structures and structures from molecular dynamics simulations was used to assess the stability of the crystal structures in a membrane environment and the quality of our molecular dynamics simulation parameters. The r.m.s.d. values computed from five independent simulations, each over 1500 ns in length, of iC++ (left) and GtACR1 (right), average less than 2 Å, supporting the stability of the crystal structures. In our calculations, we removed the flexible C-terminal tails of both proteins (residue 312 and 251 onwards in iC++ and GtACR1, respectively) and the first eight residues of GtACR1. b, 2 Fo − Fc map (blue mesh, contoured at 1σ) and Fo − Fc omit map (green mesh, contoured at 4σ) for electron density around the putative chloride-binding site. c, d, 2Fo − Fc map for the same site, with a chloride ion (c) and with a phosphate (d). Note the strong negative peak observed around phosphate ion. Numbers indicate distance between two atoms connected by dashed lines. e, Chlorides frequently occupy a site near Arg281 and Arg156 on the extracellular side of iC++, during molecular dynamics simulation. The left panel depicts this binding site as a grey sphere from the perspective looking out from the dimer interface with the extracellular side at the top. Arg281 and Arg156 are shown as sticks. The other two panels show intervals of simulation in which a chloride (middle) or phosphate (right) are present in the binding site. Each horizontal bar represents an individual replicate and monomer. Time periods where a chloride or phosphate bound are coloured green and orange, respectively, and the period after the end of the simulation is coloured black.
Extended Data Fig. 6 |. Photocurrent densities and kinetics of wild-type and mutant ACRs.
a, b, Summary of current densities of wild-type (WT) iC ++ and its mutants (a) and wild-type GtACR1 and its mutants (b) from this study. Data are mean ± s.e.m; one-way ANOVA followed by Dunnett’s test. *P <0.05, **P <0.01 and ***P =0.0001. c, Photocurrent comparisons of wild-type ZipACR and N256Q mutant (left) and wild-type GtACR2 and N235Q mutant (right). Data are means ±s.e.m.; two-tailed t-test, **P =0.0025. d, Fast (left) and slow (right) off-kinetics comparison of wild-type GtACR2 and the N235Q mutant, Data are mean ±s.e.m; two-tailed t-test, **P =0.0014. e, Example traces of wild-type Gt ACR2 and the N235Q mutant expressed in HEK293 cells by lipofectamine transfection, measured at −10 mV holding potential in voltage-clamp. Traces were recorded while cells were stimulated with 1.5 s of 1.0 mW mm−2 irradiance at 470 nm for iC++ and GtACR2 and 513 nm for GtACR1 and ZipACR. Sample size (number of cells) for each experiment is indicated next to label in parentheses.
Extended Data Fig. 7 |. Current–voltage relationships of ACR mutants.
Current–voltage relationships from −95 mV to +15 mV were determined from light-evoked current amplitude at the indicated holding potentials. Each measurement was normalized to the current amplitude measured at −5 mV for iC++ variants and −25 mV for GtACR1 variants. Values are means and s.e.m. For iC++ variants: n =8 for wild type, and n = 5 for the other iC++ variants. For GtACR1 variants: n =9 for E68Q, n =7 for R192E, n =5 for K24A, K33A, K33E, R53Q, K56A, R83Q, K116A, K188A, K188E, R192A, K256A, Q46A/K188A, K188A/R259A, and n =4 for the other variants. HEK293 cells expressing proteins through lipofectamine transfection method were recorded while stimulated by 1.5 s of 1.0 mW/mm2 irradiance at 470nm for iC ++ and 513 nm for GtACR1. The first five graphs are from the iC++ backbone, and the rest are GtACR1 mutations.
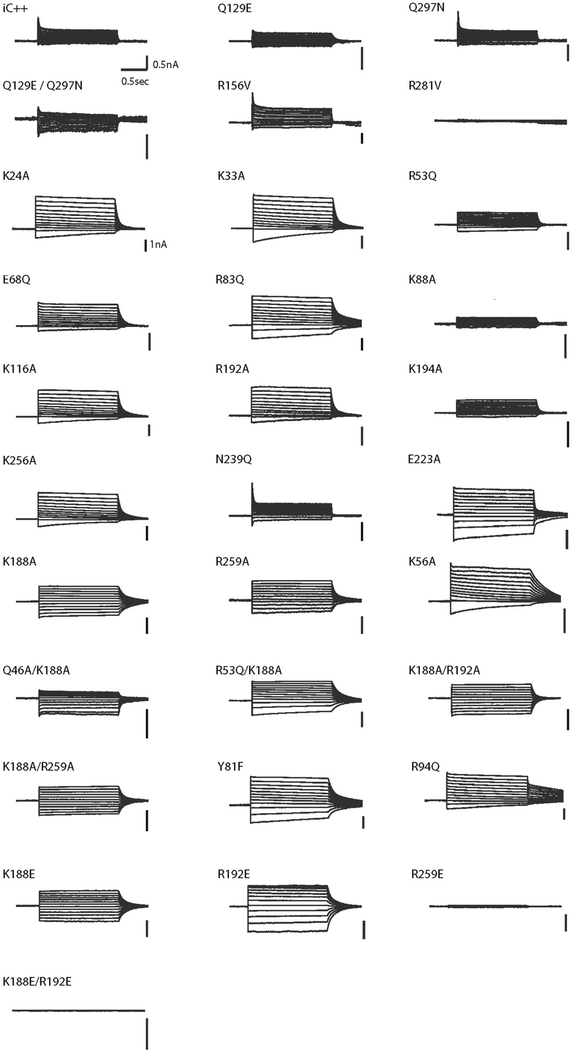
Extended Data Fig. 8 |. Representative traces for current–voltage measurements.
Voltage-clamp traces corresponding to current–voltage relationships shown in Extended Data Fig. 7, collected from − 95 mV to +15 mV in steps of 10 mV. HEK293 cells, transfected using the lipofectamine transfection method, were recorded while stimulated by 1.5 s of 1.0 mW mm−2 irradiance at 470 nm for iC++ and 513 nm for GtACR1. The first six traces are from the iC++ backbone, and the rest are GtACR1 mutations.
Extended Data Fig. 9 |. Electrophysiology and structural comparison of FLASH and ZipACR.
a, Confocal images of FLASH and ZipACR expression in mouse hippocampus 4 weeks after virus injection. Up to 15 slices per animals were collected, all with similar expression level of opsins. Scale bar, 100 μm. b–h, Comparisons of input resistance (b), capacitance (c), resting potentials (d), photocurrent measured at −10 mV (e), reversal potentials (f), currents injected to elicit action potentials (g), and holding currents needed to keep cells at −70 mV ( h) The steady-state/ peak photocurrent ratio of ZipACR was close to 100%, so the stationary current data was not included in e. All electrophysiology data were measured from FLASH- and ZipACR-expressing hippocampal neurons in acute slice preparation from animals 4 weeks after virus injection. Data are mean ±s.e.m.; two-tailed t-test. *P =0.044, **P =0.003. i, Example traces of neurons expressing FLASH and ZipACR succeeding (left) and failing (right) to inhibit multiple spikes under the pulsed illumination condition. j, Summary of FLASH and ZipACR multiple-spike inhibition, corresponding to the experimental paradigm in i. Data are mean ±s.e.m.; two-tailed t-test. P =0.32. k, Light-driven spiking was observed from ZipACR expressing neurons (3/8), but not from FLASH expressing ones (0/8). For all electrophysiology experiments, sample size (number of cells) for each experiment is indicated next to label in parentheses. l, m, Surface electrostatic potentials of homology models of FLASH (l) and ZipACR (m). Models were built using SWISS-MODEL47. The surface is coloured on the basis of electrostatic potential contoured from −10 kT (red) to +10 kT (blue). White denotes 0 kT. Surface potential was calculated using PDB2PQR48 for both GtACR1 and C1C2 models.
Extended Data Fig. 10 |. Confocal images of opsin expression in brain slices and worms.
a, b, Confocal images showing opsin expression with electrode (a) and in thalamus (b). Scale bar, 100 μm. c, d, Confocal images showing FLASH (c) and ZipACR (d) expression in worms, mediated by punc-17- (cholinergic neurons, top) and pmyo-3- (muscle, bottom) promoters. Scale bar, 20 μm.
Extended Data Fig. 11 |. Differences in polarity and hydration of retinal binding pockets in iC++ and Gt ACR1.
a, Structures of the retinal binding pockets of GtACR1 (left) and iC++ (right) in van der Waals representations. b, Absorption spectra of wild-type iC++, S295A, G220S and S295A/G220S mutants. Water density map at the dimer interface of GtACR1, viewed parallel to and from within the membrane (c) and viewed from the intracellular side (d) during molecular dynamics simulation, contoured at probability density of 0.016 molecules per Å3. e, Corresponding water density map at the dimer interface for iC++ viewed parallel to and from within the membrane, contoured at probability density of 0.016 molecules per Å3. f, Superimposed structures of iC++ (beige) and GtACR1 (blue) at the dimer interfaces, viewed from the intracellular side. ATR molecules are shown as sphere models.
Supplementary Material
Acknowledgements
We thank C. Lee, M. Lo, K. Geiselhart and M. Lima for technical support; K.K. Kumar, N.R. Latorraca, M. Inoue and K. Katayama for comments on the manuscript; E.E. Steinberg, M.A. Wright, and R.C. Malenka for inputs on mouse experiments; K. Hirata, M. Yamamoto and other staffs at BL32XU of SPring-8, and the staff at BL23ID-B/23ID-D of APS for assistance in data collection. We acknowledge support by JST PRESTO (JPMJPR1782 for H.E.K., JPMJPR15P2 for K.I.), Stanford Bio-X and the Kwanjeong Foundation (Y.S.K.), German Academic Exchange Service (D.H.); MEXT (17H03007 for K.I. and 25104009/15H02391 for H.K.), JST CREST (JPMJCR1753, H.K.), the US Department of Energy, Scientific Discovery through Advanced Computing (SciDAC) program (R.O.D.) and Mathers Charitable Foundation (B.K.K.). The project was supported by a grant for channelrhodopsin crystal structure determination from the NIMH (R01MH075957 to K.D.).
Footnotes
Reviewer information Nature thanks P. Scheerer, L. Tian and the other anonymous reviewer(s) for their contribution to the peer review of this work.
Additional information
Competing interests The authors declare no competing interests.
Publisher’s note: Springer Nature remains neutral with regard to jurisdictional claims in published maps and institutional affiliations.
References
- 1.Deisseroth K & Hegemann P The form and function of channelrhodopsin. Science 357, eaan5544 (2017). [DOI] [PMC free article] [PubMed] [Google Scholar]
- 2.Kato HE et al. Crystal structure of the channelrhodopsin light-gated cation channel. Nature 482, 369–374 (2012). [DOI] [PMC free article] [PubMed] [Google Scholar]
- 3.Berndt A, Lee SY, Ramakrishnan C & Deisseroth K Structure-guided transformation of channelrhodopsin into a light-activated chloride channel. Science 344, 420–424 (2014). [DOI] [PMC free article] [PubMed] [Google Scholar]
- 4.Wietek J et al. Conversion of channelrhodopsin into a light-gated chloride channel. Science 344, 409–412 (2014). [DOI] [PubMed] [Google Scholar]
- 5.Wietek J et al. An improved chloride-conducting channelrhodopsin for light-induced inhibition of neuronal activity in vivo. Sci. Rep 5, 14807 (2015). [DOI] [PMC free article] [PubMed] [Google Scholar]
- 6.Berndt A et al. Structural foundations of optogenetics: Determinants of channelrhodopsin ion selectivity. Proc. Natl Acad. Sci. USA 113, 822–829 (2016). [DOI] [PMC free article] [PubMed] [Google Scholar]
- 7.Govorunova EG, Sineshchekov OA, Janz R, Liu X & Spudich JL Natural light-gated anion channels: a family of microbial rhodopsins for advanced optogenetics. Science 349, 647–650 (2015). [DOI] [PMC free article] [PubMed] [Google Scholar]
- 8.Kim CK, Adhikari A & Deisseroth K Integration of optogenetics with complementary methodologies in systems neuroscience. Nat. Rev. Neurosci 18, 222–235 (2017). [DOI] [PMC free article] [PubMed] [Google Scholar]
- 9.Gunaydin LA et al. Ultrafast optogenetic control. Nat. Neurosci 13, 387–392 (2010). [DOI] [PubMed] [Google Scholar]
- 10.Yizhar O et al. Neocortical excitation/inhibition balance in information processing and social dysfunction. Nature 477, 171–178 (2011). [DOI] [PMC free article] [PubMed] [Google Scholar]
- 11.Kim YS et al. Crystal structure of a natural anion-conducting channelrhodopsin, GtACR1. Nature 10.1038/s41586-018-0511-6 (2018). [DOI] [PMC free article] [PubMed]
- 12.Deisseroth K Optogenetics: 10 years of microbial opsins in neuroscience. Nat. Neurosci 18, 1213–1225 (2015). [DOI] [PMC free article] [PubMed] [Google Scholar]
- 13.Allen WE et al. Thirst-associated preoptic neurons encode an aversive motivational drive. Science 357, 1149–1155 (2017). [DOI] [PMC free article] [PubMed] [Google Scholar]
- 14.Chung S et al. Identi cation of preoptic sleep neurons using retrograde labelling and gene pro ling. Nature 545, 477–481 (2017). [DOI] [PMC free article] [PubMed] [Google Scholar]
- 15.Mamad O et al. Place eld assembly distribution encodes preferred locations. PLoS Biol 15, e2002365 (2017). [DOI] [PMC free article] [PubMed] [Google Scholar]
- 16.Selimbeyoglu A et al. Modulation of prefrontal cortex excitation/inhibition balance rescues social behavior in CNTNAP2-de cient mice. Sci. Transl. Med 9, eaah6733 (2017). [DOI] [PMC free article] [PubMed] [Google Scholar]
- 17.Sineshchekov OA, Li H, Govorunova EG & Spudich JL Photochemical reaction cycle transitions during anion channelrhodopsin gating. Proc. Natl Acad. Sci. USA 113, E1993–E2000 (2016). [DOI] [PMC free article] [PubMed] [Google Scholar]
- 18.Takemoto M et al. Molecular dynamics of channelrhodopsin at the early stages of channel opening. PLoS One 10, e0131094 (2015). [DOI] [PMC free article] [PubMed] [Google Scholar]
- 19.VanGordon MR, Gyawali G, Rick SW & Rempe SB Atomistic study of intramolecular interactions in the closed-state channelrhodopsin chimera, C1C2. Biophys. J 112, 943–952 (2017). [DOI] [PMC free article] [PubMed] [Google Scholar]
- 20.Govorunova EG et al. The expanding family of natural anion channelrhodopsins reveals large variations in kinetics, conductance, and spectral sensitivity. Sci. Rep 7, 43358 (2017). [DOI] [PMC free article] [PubMed] [Google Scholar]
- 21.Jun JJ et al. Fully integrated silicon probes for high-density recording of neural activity. Nature 551, 232–236 (2017). [DOI] [PMC free article] [PubMed] [Google Scholar]
- 22.Yamashita K, Hirata K & Yamamoto M KAMO: towards automated data processing for microcrystals. Acta Crystallogr. D Struct. Biol 74, 441–449 (2018). [DOI] [PMC free article] [PubMed] [Google Scholar]
- 23.Kabsch W Xds. Acta Crystallogr. D Biol. Crystallogr 66, 125–132 (2010). [DOI] [PMC free article] [PubMed] [Google Scholar]
- 24.McCoy AJ et al. Phaser crystallographic software. J. Appl. Cryst 40, 658–674 (2007). [DOI] [PMC free article] [PubMed] [Google Scholar]
- 25.Murshudov GN et al. REFMAC5 for the re nement of macromolecular crystal structures. Acta Crystallogr. D Biol. Crystallogr 67, 355–367 (2011). [DOI] [PMC free article] [PubMed] [Google Scholar]
- 26.Adams PD et al. PHENIX: a comprehensive Python-based system for macromolecular structure solution. Acta Crystallogr. D Biol. Crystallogr 66, 213–221 (2010). [DOI] [PMC free article] [PubMed] [Google Scholar]
- 27.Emsley P, Lohkamp B, Scott WG & Cowtan K Features and development of Coot. Acta Crystallogr. D Biol. Crystallogr 66, 486–501 (2010). [DOI] [PMC free article] [PubMed] [Google Scholar]
- 28.Gradinaru V et al. Molecular and cellular approaches for diversifying and extending optogenetics. Cell 141, 154–165 (2010). [DOI] [PMC free article] [PubMed] [Google Scholar]
- 29.Zhang L & Hermans J Hydrophilicity of cavities in proteins. Proteins 24, 433–438 (1996). [DOI] [PubMed] [Google Scholar]
- 30.Lomize MA, Lomize AL, Pogozheva ID & Mosberg HI OPM: orientations of proteins in membranes database. Bioinformatics 22, 623–625 (2006). [DOI] [PubMed] [Google Scholar]
- 31.Betz R Dabble v.2.6.3 10.5281/zenodo.836914 (2004). [DOI]
- 32.Best RB, Mittal J, Feig M & MacKerell AD Jr. Inclusion of many-body effects in the additive CHARMM protein CMAP potential results in enhanced cooperativity of alpha-helix and beta-hairpin formation. Biophys. J 103, 1045–1051 (2012). [DOI] [PMC free article] [PubMed] [Google Scholar]
- 33.Best RB et al. Optimization of the additive CHARMM all-atom protein force field targeting improved sampling of the backbone ϕ, ψ and side-chain χ1 and χ2 dihedral angles. J. Chem. Theory Comput 8, 3257–3273 (2012). [DOI] [PMC free article] [PubMed] [Google Scholar]
- 34.Huang J & MacKerell AD Jr. CHARMM36 all-atom additive protein force field: validation based on comparison to NMR data. J. Comput. Chem 34, 2135–2145 (2013). [DOI] [PMC free article] [PubMed] [Google Scholar]
- 35.Klauda JB et al. Update of the CHARMM all-atom additive force field for lipids: validation on six lipid types. J. Phys. Chem. B 114, 7830–7843 (2010). [DOI] [PMC free article] [PubMed] [Google Scholar]
- 36.Huang J et al. CHARMM36m: an improved force field for folded and intrinsically disordered proteins. Nat. Methods 14, 71–73 (2017). [DOI] [PMC free article] [PubMed] [Google Scholar]
- 37.Zhu S, Brown MF & Feller SE Retinal conformation governs pKa of protonated Schif base in rhodopsin activation. J. Am. Chem. Soc 135, 9391–9398 (2013). [DOI] [PMC free article] [PubMed] [Google Scholar]
- 38.Salomon-Ferrer R, Gotz AW, Poole D, Le Grand S & Walker RC Routine microsecond molecular dynamics simulations with AMBER on GPUs. 2. Explicit solvent particle mesh Ewald. J. Chem. Theory Comput 9, 3878–3888 (2013). [DOI] [PubMed] [Google Scholar]
- 39.Case DA et al. AMBER 2017 (University of California, San Francisco, 2017). [Google Scholar]
- 40.Hopkins CW, Le Grand S, Walker RC & Roitberg AE Long-time-step molecular dynamics through hydrogen mass repartitioning. J. Chem. Theory Comput 11, 1864–1874 (2015). [DOI] [PubMed] [Google Scholar]
- 41.Roe DR & Cheatham TE III. PTRAJ and CPPTRAJ: software for processing and analysis of molecular dynamics trajectory data. J. Chem. Theory Comput 9, 3084–3095 (2013). [DOI] [PubMed] [Google Scholar]
- 42.Humphrey W, Dalke A & Schulten K VMD: visual molecular dynamics. J. Mol. Graph 14, 33–38 (1996). [DOI] [PubMed] [Google Scholar]
- 43.Vanommeslaeghe K et al. CHARMM general force eld: A force field for drug-like molecules compatible with the CHARMM all-atom additive biological force elds. J. Comput. Chem 31, 671–690 (2010). [DOI] [PMC free article] [PubMed] [Google Scholar]
- 44.Steinbrecher T, Latzer J & Case DA Revised AMBER parameters for bioorganic phosphates. J. Chem. Theory Comput 8, 4405–4412 (2012). [DOI] [PMC free article] [PubMed] [Google Scholar]
- 45.Paxinos G, Franklin KBJ The Mouse Brain in Stereotaxic Coordinates 2nd edn (Academic Press, San Diego, 2001). [Google Scholar]
- 46.Zhang F et al. Multimodal fast optical interrogation of neural circuitry. Nature 446, 633–639 (2007). [DOI] [PubMed] [Google Scholar]
- 47.Waterhouse A et al. SWISS-MODEL: homology modelling of protein structures and complexes. Nucleic Acids Res 46, W296–W303 (2018). [DOI] [PMC free article] [PubMed] [Google Scholar]
- 48.Dolinsky TJ, Nielsen JE, McCammon JA & Baker NA PDB2PQR: an automated pipeline for the setup of Poisson–Boltzmann electrostatics calculations. Nucleic Acids Res 32, W665–7 (2004). [DOI] [PMC free article] [PubMed] [Google Scholar]
Associated Data
This section collects any data citations, data availability statements, or supplementary materials included in this article.
Supplementary Materials
Data Availability Statement
The protein coordinates and atomic structure factors of iC++ at pH 8.5 and pH 6.5 have been deposited in the Protein Data Bank (PDB) under accession number 6CSN (pH 8.5) and 6CSO (pH 6.5), respectively. The raw dif-fraction images have been deposited in the SBGrid data repository (ID: 570 for pH 8.5 and 571 for pH 6.5). All other data are available from the corresponding authors upon reasonable request.


