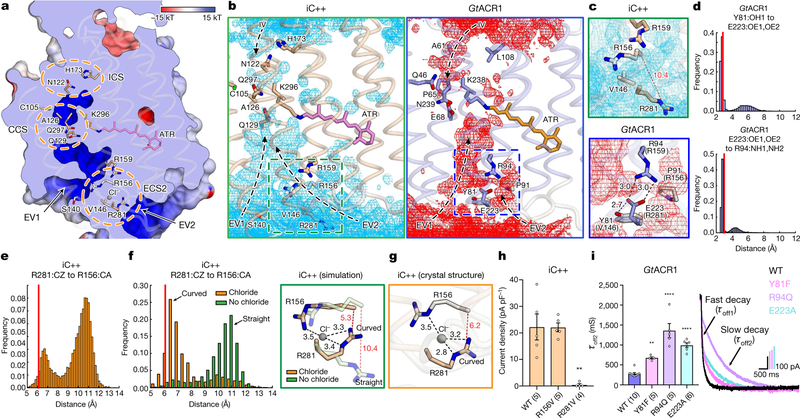
Fig. 2 |. Structural and functional characterization of the extracellular constrictions.
a, Anion-conducting pathway of iC++. Surface is coloured by the electrostatic potential and the orange dashed circles highlight constriction sites. b, Simulated water distribution for iC++ (cyan meshes, left) and GtACR1 (red meshes, right). The water density maps are contoured at a probability density of 0.016 molecules per Å3. Dashed boxes, ECS2; arrows, putative water or ion pathways. c, Magnified view of the boxed regions from b. Black and red dashed lines represent hydrogen - bonding and R156–R281 interactions, respectively, with distances shown in Å. d, e, Distance histograms for R281–R156 (e), Y81–E223 (d, top) and E223–R94 (d, bottom). f, Distance histograms for R156–R281 (left), and overlaid simulation structures at chloride-binding site with and without chloride (right). g, Crystal structure of the chloride-binding site as shown in f. h, i, Effects of mutations in the iC++ chloride-binding site (h, **P =0.0013) and GtACR1 ECS2 (i, **P =0.003, ****P =0.0001). Crystal structure distances are marked as red lines in histograms (d–f). Data are mean ±s.e.m.; one-way ANOVA followed by Dunnett’s test. Sample size (number of cells) indicated in parentheses.

