

Abstract
Pulmonary fissure detection in computed tomography (CT) is a critical component for automatic lobar segmentation. The majority of fissure detection methods use feature descriptors that are hand-crafted, low-level, and have local spatial extent. The design of such feature detectors is typically targeted towards normal fissure anatomy, yielding low sensitivity to weak and abnormal fissures that are common in clinical datasets. Furthermore, local features commonly suffer from low specificity, as the complex textures in the lung can be indistinguishable from the fissure when global context is not considered. We propose a supervised discriminative learning framework for simultaneous feature extraction and classification. The proposed framework, called FissureNet, is a coarse-to-fine cascade of two convolutional neural networks. The coarse-to-fine strategy alleviates the challenges associated with training a network to segment a thin structure that represents a small fraction of the image voxels. FissureNet was evaluated on a cohort of 3706 subjects with inspiration and expiration 3DCT scans from the COPDGene clinical trial and a cohort of 20 subjects with 4DCT scans from a lung cancer clinical trial. On both datasets, FissureNet showed superior performance compared to a deep learning approach using the U-Net architecture and a Hessian-based fissure detection method in terms of area under the precision- recall curve (PR-AUC). The overall PR-AUC for FissureNet, U-Net, and Hessian on the COPDGene (lung cancer) dataset was 0.980 (0.966), 0.963 (0.937), and 0.158 (0.182), respectively. On a subset of 30 COPDGene scans, FissureNet was compared to a recently proposed advanced fissure detection method called derivative of sticks (DoS) and showed superior performance with a PR-AUC of 0.991 compared to 0.668 for DoS.
Keywords: Lung, Segmentation, X-ray imaging and computed tomography, Machine learning, ConvNet, CNN
I. INTRODUCTION
COMPUTED Tomography (CT) measures X-ray projections of the body at different angles to reconstruct a volumetric image of the anatomy. The contrast produced in a CT image reflects differences in X-ray photon attenuation, which in the lungs broadly reflects tissue density. Technological advancements in CT hardware have made it possible to scan the entire thoracic cavity in less than one second and reconstruct images with submillimeter spatial resolution. These properties make CT imaging the standard modality for imaging the intricate structures of the lung. Pulmonary CT is routinely used for diagnostics, treatment planning and delivery, and post-intervention evaluation.
CT images provide a rich source of information regarding the extent and spatial distribution of pulmonary disease. Computer-aided systems are essential for objective quantification and characterization of the complex information present in the image. Algorithms have been developed for detection and classification of nodules [1], texture classification of obstructive disease [2], pulmonary embolism detection [3], and quantitative airway analysis [4]. Although CT is an anatomical imaging modality, functional information about the lung may be derived from CT scans collected at different inspiration levels using image registration [5].
The human lungs are composed of five lobar compartments, which are separated anatomically by three lobar fissures. The left oblique (major) fissure (LOF) separates the lower and upper lobes of the left lung. The right oblique (major) fissure (ROF) separates the lower lobe from the middle and upper lobes, and the right horizontal (minor) fissure (RHF) separates the middle and upper lobes of the right lung. It is often of clinical interest to perform quantitative analysis within each lobe individually. Boueiz et al. recently identified subgroups of upper-lobe-predominant emphysema and lower-lobe-predominant emphysema and found associations with clinical and imaging outcomes [6]. Accurate knowledge of lobar anatomy is critical for successfully treating severe emphysema with bronchoscopic lung volume reduction [7]. Lobar information also serves as a precursor to other image analysis algorithms including image registration. Currents- and varifolds-based registration algorithms rely on accurate surface representations of the lungs, lobes, and vessel trees [8].
The lobes are generally anatomically independent, but incomplete fissures are possible and the detection of incompleteness may be clinically relevant. An individual’s unique lobar structure is likely to influence lung tissue mechanics and patterns of regional ventilation. Fissure incompleteness and the resulting collateral ventilation reduces the efficacy of endobronchial valves [9–11]. Gopelmann et al. recently showed that apical vs. basal emphysema distribution varies with fissure integrity [12]. However, Pu et al. found no relationship between fissure integrity and COPD severity [13].
Natural variability in lobar anatomy has impeded the development of robust CT analysis methods for fissure and lobar segmentation. In cross-sectional CT images the fissures appear as thin surface-like structures (less than 1 mm thick) with higher image intensity than the surrounding lung parenchyma. This makes it difficult to identify fissures in low-dose or thick-slice CT scans. Fissure segmentation in pathological lungs is further complicated by diseases that locally resemble fissures, for example, bullous lung disease and fibrosis may locally resemble fissures.
Despite these challenges, many attempts have been made to design automatic methods for lobar segmentation [14–20]. The majority of these methods consist of four common modules: lung segmentation, fissure detection using local appearance information, removal of falsely identified fissures, and surface fitting to interpolate and/or extrapolate incomplete fissures. Doel et al. presented an extensive review on pulmonary lobe segmentation and proposed that these individual components should be independently developed and evaluated, opposed to comparing entire pipelines [21]. We follow this proposal and focus on the fissure detection in this work.
Several methods have been proposed for the detection of fissures in CT images. Eigenanalysis of the Hessian matrix is commonly used to exploit the characteristic property that plane-like structures have one direction with large curvature in the intensity profile and two orthogonal directions with vanishing intensity curvature [19, 22–25]. Zhang et al. used a ridgeness operator based on 2D multi-local level set extrinsic curvature measure with structure tensor analysis (MLSEC-ST) [14, 26]. Other works use knowledge of fissure appearance on 2D cross sections to design a filter bank of 2D line filters to detect fissure structures [27–29]. Traditional machine learning approaches use domain-specific hand-crafted features and labeled training data to train a classifier. van Rikxoort et al. used a feature set including intensity, Gaussian derivatives, gradient, and Hessian eigenvalues with labeled training data to build a kNN classifier [30]. The authors showed superior performance compared to conventional unsupervised fissure detection. Wei et al. trained an artificial neural network using texture-derived image features. However, a limitation of this method is that it requires extensive post-processing and only works on major fissures [31].
These existing fissure detection methods are limited to local descriptors of fissure shape and appearance. Although local information is necessary for the precise localization of the fissure, we argue that it is not sufficient. Weak and incomplete fissures diminish local response, and pulmonary disease can locally resemble fissures. We hypothesize that knowledge of global and contextual information can improve specificity by providing guidance when the fissure signal is low or noisy. However, it is far more challenging to design abstract features, such as those that capture global context, compared to low-level features, such as edges. Additionally, hand-crafting features requires domain expertise, and generalizing such a framework to other tasks is not trivial. Alternatively, convolutional neural networks (ConvNets or CNNs) are capable of learning abstract features directly from training data.
Several ConvNet architectures have been proposed for semantic segmentation; the majority are symmetrical networks consisting of an encoder and corresponding decoder [32–34]. Compared to a classification ConvNet which yields a single prediction for each class, a segmentation ConvNet produces a prediction map that has the same spatial resolution as the input. U-Net and SegNet are notable encoder-decoder networks, each of which incorporate skip connections between corresponding encoder and decoder elements to preserve precise localization information that would otherwise be lost with pooling operations [32, 33]. These symmetrical networks are memory intensive and cannot be trained on entire volumetric medical images due to current GPU memory limitations. The majority of ConvNet methods use either 2D slices or small image crops to accommodate memory limitations thereby compromising the capacity of the network to learn large-scale 3D features or global patterns.
For the task of fissure segmentation, both 3D structure and global context are critical for accurate segmentation. Therefore 2D slices or patchwise approaches are not ideal. Furthermore, directly training a network to segment fissures is challenging due to the large class imbalance between fissure and non fissure voxels. High accuracy could be achieved by learning the trivial classifier that always predicts the majority class (i.e. non-fissure).
To address these challenges, we propose a new coarse-to-fine deep learning segmentation approach called FissureNet. FissureNet achieves superior segmentation performance compared to other methods by concatenating two Seg3DNet ConvNets. The new Seg3DNet1 architecture is less memoryintensive compared to U-Net and SegNet, enabling it to learn global contextual information from entire lung images. Seg3DNet is a generic 3D segmentation network suitable for many applications. Within FissureNet, the first Seg3DNet is trained to detect an approximate fissure region of interest (ROI) and the second Seg3DNet is trained to detect precise fissure location within the ROI. The coarse-to-fine approach used by FissureNet overcomes the challenges associated with training a network to segment a thin structure that represents a very small fraction of the total voxel count.
II. Methods
A. Overview
We model fissure detection as a probabilistic classification problem. Given a dataset X and a finite class set Y, a probabilistic classifier models the conditional probability distribution P(Y|X). That is, given a feature vector x ∈ X, the classifier predicts a probability distribution over the class set Y. The features and the conditional probability distribution are learned jointly through end-to-end training of a Seg3DNet.
For pulmonary fissure classification the class set Y consists of the three fissures and a non-fissure class, such that all voxels that are not fissure are assigned to the non-fissure class. The number of fissure voxels is very small compared to the number of non-fissure voxels; there is approximately one fissure voxel for every 100 non-fissure voxels within the lung mask (at the image resolution used in this study). FissureNet uses a coarse-to-fine approach by cascading two Seg3DNets (Fig. 1). The first Seg3DNet is trained to detect an approximate fissure region of interest (ROI) and the second Seg3DNet is trained to detect the precise fissure location within the ROI. Separate pipelines are trained for the left and right lungs, yielding four total Seg3DNet classifiers: left fissure ROI, right fissure ROI, left fissure, and right fissure. The proposed Seg3DNet architecture is illustrated in Fig 2.
Fig. 1:
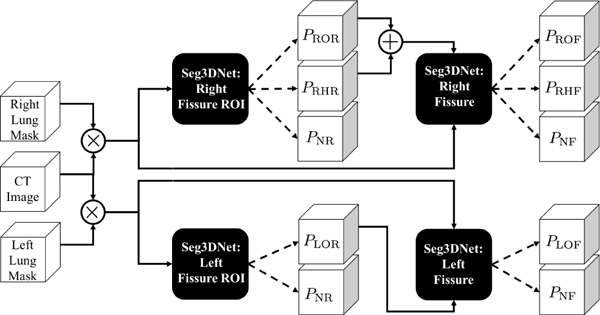
FissureNet: coarse-to-fine network cascade. Black boxes represent four Seg3DNet classifiers, each trained for a differentclassification task as indicated in the box. For the right lung pipeline (top), the CT image is masked with the right lung mask and input to the right fissure ROI Seg3DNet. The output of the ROI Seg3DNet represents the probability that each voxel is right oblique ROI (PROR), right horizontal ROI (PRHR), and non-fissure ROI (PNR). The input to the right fissure Seg3DNet is the masked CT image and the probability maps PROR or PRHR. The output of the right fissure Seg3DNet gives the probability that each voxel is right oblique fissure (PROF ), right horizontal fissure (PRHF ), and non-fissure (PN F ). The left lung pipeline (bottom) is similar, except each classifier only predicts two classes corresponding to left oblique fissure and non-fissure.
Fig. 2:
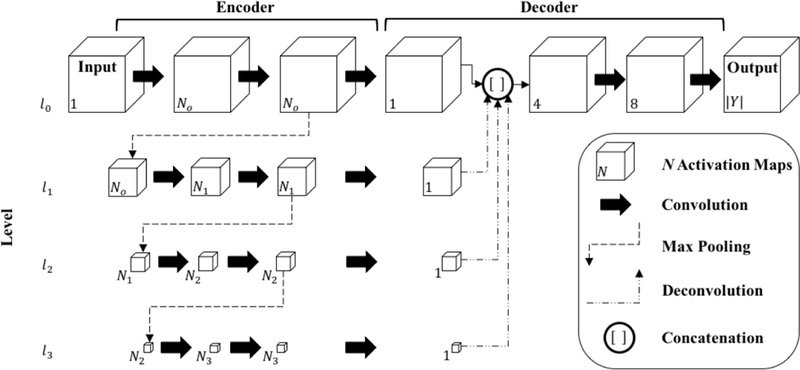
Proposed Seg3DNet architecture. Each arrow represents an operation performed by a layer and each cube represents the intermediate feature representations produced by a layer. For visualization purposes, only the spatial dimensions of the feature representations are illustrated. The number of activation maps (size of channel dimension) is denoted in the lower left corner. For the encoder module, we define Ni = 2i+5 o that the number of activation maps increases by a factor of two at each level. The number of kernels used in each convolutional layer can be inferred by the number of activation maps in the layer’s output representation, e.g., the first convolutional layer has N0 = 20+5 = 32 kernels. The relative spatial size of the activation maps are drawn to scale. At each level the feature representation is spatially downsampled by a factor of two. Batch normalization and ReLU nonlinearity are performed after each convolution except the last.
B. Convolutional Neural Network
A ConvNet is a specialized neural network model designed to exploit patterns in spatially correlated data, such as images and videos. At a high level, a ConvNet has multiple layers of learned feature detectors arranged hierarchically. The feature detectors in each layer are local, however, the composition of layers allows the spatial extent defined on the input image, called receptive field, to grow with layer depth. This design gives the network the capacity to learn global features, without the computational overhead and increased number of parameters required for large feature detectors. The feature detectors are shared spatially, making a given feature relevant at any location in the image. Layers with feature detectors are called convolutional layers. The feature detectors, or kernels, are not explicitly encoded but are the parameters being learned through optimization. Convolutional layers are typically followed by an elementwise nonlinearity and interleaved with pooling layers which serve to reduce the spatial resolution.
Each layer in a ConvNet takes a feature representation as input, performs an operation to transform the input, and produces a new feature representation as the output. The layers are arranged hierarchically: the output feature representation of one layer serves as the input to the following layer. Each feature representation consists of a set of spatial activation maps, each representing a different feature type. The activation maps are concatenated along a non-spatial dimension, i.e. the channel dimension, to form the feature representation. Therefore, in a 3D ConvNet the intermediate feature representations are all 4D images. The channel dimension is analogous to that of an RGB image, i.e., the voxels are vector-valued and each vector element represents a different feature type.
The ConvNet parameters (feature detectors) are learned from labeled training data using backpropagation [35]. Starting with randomly initialized parameters, a training example is propagated through the network and a prediction is made. The dissimilarity between the prediction and the true label is quantified with a loss function. The gradient on the loss with respect to each parameter is calculated using backpropagation, which is a recursive application of the chain rule. All parameters are updated to decrease the error using stochastic gradient descent, or some variant thereof.
C. Seg3DNet
In this work, we propose a 3D ConvNet architecture for image segmentation called Seg3DNet (Fig. 2). Seg3DNet consists of an encoder which generates a high dimensional feature representation of the image, and a decoder which decodes the features to produce a segmentation. Unlike many segmentation architectures, the encoder and decoder modules in Seg3DNet are asymmetrical. The encoder module consists of L resolution levels li for i = 0,1, ...,L — 1, where the activation maps in level li are downsampled by a factor of 2i relative to the full resolution level l0. Each level of the encoder has two convolutional layers followed by a max-pooling layer. All convolutional layers use 3 × 3 × 3 voxel kernels, and the number of kernels in level li is given by Ni = 2i+5. After the second convolution layer of each level, max pooling with kernel size 2×2×2 and stride of 2 produces the downsampling factor of 2 between levels. While recent ConvNet architectures have eliminated pooling layers, downsampling is necessary to achieve a global receptive field on large input volumes. To mitigate the loss of precise localization information from the pooling layers, the decoder network combines representations from all scale levels.
The decoder module condenses the representation at each scale level to a single activation map using a convolutional layer with a single voxel kernel of size 1 × 1 × 1 x Ni. The lower resolution activation maps are upsampled to full resolution using nearest neighbor interpolation followed by a convolution with filter size 2i + 1, effectively performing a variant of deconvolution [36]. The resulting activation maps, one from each scale level, are concatenated along the feature dimension to form a multi-scale representation. Two more convolutional layers are used to combine information from different scales.
The representation at the last layer of the Seg3DNet has |Y | activation maps each with the same spatial dimensions as the input volume. The output at spatial location x of activation map y, fy (x), is interpreted as an unnormalized log probability of x belonging to class y. The softmax vector nonlinearity is used to obtain the conditional probability distribution, given by:
| (1) |
We denote the probability for each class y ∈ Y as Py(x). By construction, Y is a valid probability distribution function with Py (x) ∈ [0,1] ∀y ∈ Y, and . For the right lung ConvNets, we define separate classes to distinguish between oblique and horizontal fissures. Therefore, the class set cardinality for the left and right lung ConvNets is | Y| = 2 and |Y | = 3, respectively.
Batch normalization [37] and ReLU nonlinearities [38] are used after each convolution layer with the exception of the last layer. All convolutional layers use zero-padding to prevent reduction in spatial dimensions.
D. FissureNet
As shown in Fig. 1, FissureNet has two parallel pipelines, each of which is a coarse-to-fine cascade of two Seg3DNets. The first Seg3DNet is trained to detect a fissure ROI. The original ground truth fissure segmentations are modified to produce the fissure ROI training labels. A voxel belongs to the fissure ROI if it is located within 5 mm of the corresponding fissure, otherwise it is non-fissure. This dilation of the singlevoxel ground truth reduces the class skewness. Additionally, by dilating the ground truth fissure the network is able to focus on global patterns rather than precise fissure appearance. As a result, the network is more robust to weak and radiograph-ically incomplete fissures. The fissure ROI allows for small imperfections in the training data which are expected due to the nature of manually tracing a single voxel curve.
For training the first Seg3DNet, we define the loss associated with each voxel using categorical cross entropy of the form
| (2) |
where ty (x) represents a one-hot encoding of the target label for voxel x and class y, i.e., ty (x) is one when y corresponds to the true class and zero for all other classes The total loss for an input image is given by
| (3) |
where Ω is the input image domain and YROI is ROI classifier class set.
The second Seg3DNet is trained to detect the precise fissure location. The original ground truth fissure segmentations are used as training labels. The loss associated with each voxel is the same as the first Seg3DNet (2). However, the total loss is a weighted average using the probability that the voxel is in a fissure ROI
| (4) |
where PNR (X) is the probability that voxel x is non-fissure ROI as predicted by the first Seg3DNet and YF is the fissure classifier class set. This weighting limits the contribution of the large number of non-fissure voxels to the loss function, mitigating the class imbalance problem while allowing for precise fissure localization.
E. Implementation
FissureNet was implemented using the open source frameworks Theano [39] and Lasagne [40]. Training was performed using a P40 NVIDIA GPU with 24 GB of RAM. Adam optimization was used with an initial learning rate of 5 × 10⁻⁴ [41]. All parameters were initialized using Xavier normal initialization [42]. Each network was trained for six epochs, which took approximately 48 hours. Inference time with the trained network is 10 seconds per lung on a consumer grade GPU card.
III. Experimental Methods
A. Datasets and Preprocessing
Training and testing data were acquired from the COPDGene study, a large multi-center clinical trial with over 10,000 subjects with chronic obstructive pulmonary disease (COPD) [43]. COPD which includes emphysema and chronic bronchitis, is characterized by airway inflammation and large regions of trapped gas on CT.
The COPDGene image datasets were acquired across 21 imaging centers using a variety of scanner makes and models. Each patient had two breath-hold 3D CT scans acquired, one at total lung capacity (TLC) with a dose of 200 mAs and one at functional residual capacity (FRC) with a dose of 50 mAs. Original slice thicknesses ranged from 0.625 mm to 0.9 mm. see [43] for the complete image acquisition protocol.
A subset of 1601 subjects was selected for training and a separate disjoint subset of 3706 subjects was selected for testing. The TLC scan and FRC scan for each subject were utilized, producing a training dataset with 3202 scans and a testing dataset with 7412 scans. All COPD GOLD levels [44] were used for training and evaluation; see Table I for distribution of disease severity in training and testing datasets. Each subject in COPDGene has a unique identifier consisting of five numbers and one letter, e.g., 10005Q. Subjects with identifiers that begin with values in the range 10–12 were included in the training dataset and subjects with identifiers that begin with values in the range 13–19 were included in the testing dataset.
TABLE I:
Disease stratification for the training and testing datasets. GOLD0-GOLD4 defined in [44]. No PFT: spirometry data not available; PRISm: Preserved Ratio Impaired Spirometry [45]
| Training | Testing | |
|---|---|---|
| GOLD0 | 583 | 1625 |
| GOLD1 | 133 | 309 |
| GOLD2 | 350 | 617 |
| GOLD3 | 235 | 360 |
| GOLD4 | 135 | 186 |
| No PFT | 28 | 53 |
| Non-Smoker | 0 | 90 |
| PRISm | 137 | 466 |
| Total | 1601 | 3706 |
An additional dataset of 20 4-dimensional computed tomography (4DCT) scans from a lung cancer clinical trial were used were used for evaluation. The 4DCT scans were acquired on a Siemens EDGE CT scanner with parameters of 120 kV tube voltage, 100 mAs tube current, 0.5 second tube rotation period, 0.09 pitch, 76.8 mm beam collimation, 128 detector rows, and a reconstructed slice thickness of 0.6 mm. The 4DCT scans were acquired with audio guidance. The image data was retrospectively sorted and reconstructed into ten phase images. A single phase from each subject was selected for fissure evaluation, the selected phases were chosen to represent an assorted range of tidal volumes and phases. There were no scans of this type included in the training dataset.
Due to memory constraints on the GPU, all images were resampled to isotropic 1 mm3 voxels. For each lung, subvolumes of size 64 × 200 × 200 voxels were extracted for training. For the majority of subjects, this crop size covers the entire sagittal view of the lung, however, it may not cover all sagittal slices. Therefore, for training we extracted three subvolumes centered at different sagittal slices to ensure the entire lung was covered.
For preprocessing, CT intensity values were clamped to the range of interest for fissure detection (i.e. −1024 HU and −200 HU) which also removes outliers caused by calcification and metal artifacts. Voxels outside of the lung mask were set to −1024 HU. After clamping and masking, the CT image intensities were linearly rescaled according to , where μHU and σHUare the mean and standard deviation of HU values calculated over the entire training dataset and I(x) and I’(x) are the original HU values and rescaled image intensities, respectively, for a given voxel x.
B. Ground Truth
Lung and lobar segmentations in the COPDGene study were obtained using a commercial software package (Apollo, VIDA Diagnostics, Coralville, IA), followed by manual inspection and editing as needed. The Apollo software calculates a fissure probability measure using local fissure appearance and anatomical information from the airways and vasculature and then uses surface fitting to interpolate and extrapolate a complete fissure. The manual correction was performed by trained analysts (professional research assistants) with experience levels ranging from 0–4 years. Corrections were supervised by an experienced radiologist. Manual analysts were instructed to interpolate and extrapolate when necessary to completely divide the lung into five lobes. Fissure segmentations were extracted automatically from the lobar segmentations by identifying adjacent voxels with different lobe labels, producing a two-voxel thin fissure segmentation.
Fissure segmentations for the lung cancer 4DCT dataset were defined manually by an experienced medical physics PhD student using MimVista 6.4.7 software (MIM Software, Cleveland, OH). For this dataset, both complete fissures (forming full lobar boundaries) and visible fissures were identified. The visible fissures were first identified and subsequently interpolated and extrapolated to separate lobes when necessary.
C. Comparison of Fissure Detection Methods
We compared the proposed FissureNet to three other fissure detection methods: a conventional Hessian-based method [25], the derivative of sticks (DoS) method [29], and a deep learning approach using the popular U-Net architecture [32]. The Hessian-based and U-Net methods were evaluated on the entire testing dataset (7412 scans). For comparison to DoS, a subset of 30 scans from the testing dataset was used. For this subset, three subjects were randomly selected from each GOLD level. Both the TLC scan and the FRC scan were used for each subject. The DoS method consists of a fissure filtering step (DoS1) and a post-processing step (DoS2). The aim of the post-processing step is to remove falsely detected fissure voxels, particularly those that are connected to the true fissure. This is done using a pipeline consisting of global multi-thresholding, junction detection and removal, and connected component analysis. The aim of the Hessian-based and DoS methods is the detection of visible fissures and thus no interpolation or extrapolation is performed. For the U-Net method, the depth of the U-Net was set to three levels and the branching factor was set to four to accommodate the increased memory demand of the decoder network. To mitigate the class imbalance, we used the approach from [32], which weights the underrepresented class to have higher misclassification cost.
D. Evaluation Metrics
Receiver operating characteristic (ROC) curves are commonly used to evaluate the performance of a binary classifier by measuring the tradeoff between true positive rate (TPR) and false positive rate (FPR) at different thresholds. Similarly, precision-recall (PR) curves measure the tradeoff between precision and recall (recall is the same as TPR). Recent studies have demonstrated that PR curves are better at evaluating and comparing binary classifiers in problems with a skewed prior class probability [46]. In such cases, ROC curves tend to be overly optimistic and do not distinguish between methods with different false positive behavior. The prior probability of fissure voxels is very small, so we report PR results to better discriminate between methods.
For PR evaluation, we use a 3 mm margin as described in [29]. Briefly, for calculating precision, predicted fissure voxels are categorized as true positive (TP) or false positive (FP): TP if the voxel is within 3 mm of the ground truth fissure or otherwise FP. Likewise, for calculating recall, ground truth fissure voxels are categorized as TP or false negative (FN): TP if the voxel is within 3 mm of the predicted fissure or otherwise FN. The 3 mm margin accounts for the subjectivity in manual delineation of a thin structure with low contrast. All voxels within the lung mask are considered for PR calculation and the ground truth is a two-voxel thin fissure. We report the PR curve and the area under the PR curve (PR-AUC). The optimal operating point on a PR curve is the upper right corner, and PR-AUC has values ranging from 0 to 1, with 1 describing a perfect classifier.
We evaluated the surface distance between predicted fissure and nearest ground truth fissure. For this analysis, we obtained hard fissure predictions by thresholding the probability output. The optimal threshold was determined separately for each method and was defined as the threshold on the PR curve where precision is equal to recall using a dataset of 20 COPDGene subjects (using both TLC and FRC scans) that were not included in the training or testing datasets. For each scan the average surface distance (ASD) and standard deviation of surface distances (SDSD) was calculated.
IV. Results
We compared FissureNet against three other fissure detection methods: Hessian-based [25], DoS [29], and U-Net [32]. The Hessian and the DoS methods do not distinguish between the right oblique and horizontal fissures. Therefore, only an aggregated right fissure (RF) measure is made for the right lung. For comparison, the RF measure is evaluated on FissureNet and U-Net by adding the ROF and RHF probabilities.
Fig. 3 compares PR curves for FissureNet and U-Net methods on 3706 subjects (TLC and FRC scans for each subject) from COPDGene and 20 lung cancer subjects with 4DCT scans. PR-AUCs for FissureNet, U-Net, and Hessian are displayed in Tables II and III for the COPDGene and lung cancer datasets, respectively. Overall, PR-AUC for FissureNet, U-Net, and Hessian methods were 0.980, 0.963, and 0.158, respectively, on the COPDGene dataset and 0.966, 0.937, and 0.182, respectively, on the lung cancer dataset. All methods had similar performance on the COPDGene and the lung cancer datasets and FissureNet performed best with regards to PR-AUC. Table IV shows PR-AUCs on the lung cancer dataset using a ground truth which only indicates radiographically visible fissures. FissureNet and U-Net performed slightly better using the visible-only ground truth, while Hessian performed slightly worse. Table V shows PR-AUCs for FissureNet and DoS evaluated on a subset of 15 subjects (30 scans). The post-processing in the DoS method greatly improves the PR-AUC from 0.177 (DoS1) to 0.668 (DoS2), however, FissureNet consistently performed better than DoS2 without any post processing with an overall PR-AUC of 0.991. In Tables II-V, only LOF and RF fissures are included in mean calculation to avoid over-weighting right lung results.
Fig. 3:
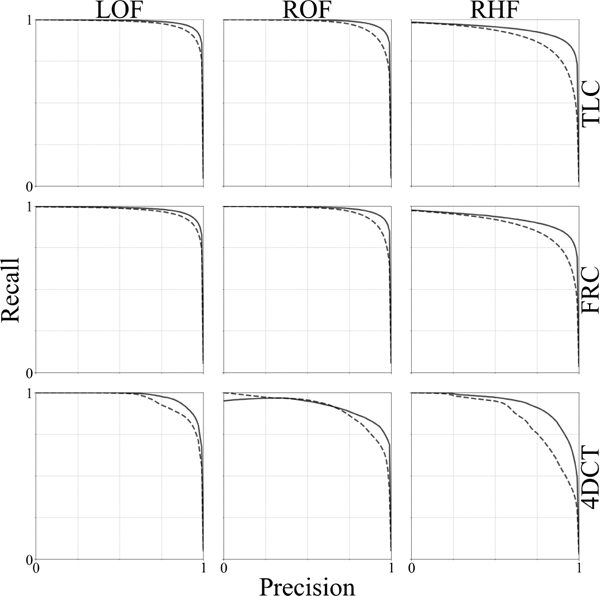
Precision-Recall curves for FissureNet (—) U-Net(₋₋₋) evaluated on the testing dataset of 3706 COPDGene subjects (TLC and FRC scans for each subject) and 20 lung cancer subjects (4DCT).
TABLE II:
PR-AUC for 3706 subject (7412 scan) testing dataset from COPDGene
| Phase | Fissure | PR-AUC |
||
|---|---|---|---|---|
| Hessian | U-Net | FissureNet | ||
| TLC | LOF | 0.145 | 0.973 | 0.985 |
| RF | 0.216 | 0.959 | 0.982 | |
| ROF | –– | 0.967 | 0.987 | |
| RHF | –– | 0.891 | 0.939 | |
| FRC | LOF | 0.108 | 0.968 | 0.979 |
| RF | 0.165 | 0.952 | 0.975 | |
| ROF | –– | 0.964 | 0.983 | |
| RHF | –– | 0.878 | 0.919 | |
| Mean | 0.158 | 0.963 | 0.980 | |
TABLE III:
PR-AUC for 20 lung cancer subjects with 4DCT scans. Non-visible fissures were interpolated and extrapolated to form complete boundaries between lobes
| Fissure | PR-AUC |
||
|---|---|---|---|
| Hessian | Unet | FissureNet | |
| LOF | 0.171 | 0.950 | 0.972 |
| RF | 0.193 | 0.924 | 0.961 |
| ROF | –– | 0.899 | 0.916 |
| RHF | –– | 0.848 | 0.926 |
| Mean | 0.182 | 0.937 | 0.966 |
TABLE IV:
PR-AUC for 20 lung cancer subjects with 4DCT scans. Only visible fissures were marked in the ground truth
| Fissure | PR-AUC |
||
|---|---|---|---|
| Hessian | Unet | FissureNet | |
| LOF | 0.113 | 0.978 | 0.992 |
| RF | 0.137 | 0.985 | 0.988 |
| ROF | –– | 0.965 | 0.953 |
| RHF | –– | 0.917 | 0.946 |
| Mean | 0.125 | 0.982 | 0.990 |
TABLE V:
PR-AUC for 15 subject (30 scan) testing subset from COPDGene
| Phase | Fissure | PR-AUC |
||
|---|---|---|---|---|
| DoS1 | DoS2 | FissureNet | ||
| TLC | LOF | 0.167 | 0.706 | 0.993 |
| RF | 0.155 | 0.652 | 0.992 | |
| ROF | –– | –– | 0.995 | |
| RHF | –– | –– | 0.968 | |
| FRC | LOF | 0.191 | 0.704 | 0.987 |
| RF | 0.196 | 0.610 | 0.990 | |
| ROF | –– | –– | 0.994 | |
| RHF | –– | –– | 0.967 | |
| Mean | 0.177 | 0.668 | 0.991 | |
Table VI shows ASD and SDSD averaged over all subjects. On average, the ASD for FissureNet was less than U-Net for all scan types and fissures. Fig. 4 shows a histogram of the differences in ASD between U-Net and FissureNet on a subject-by-subject basis; 97% of the histogram area is to the right of the vertical line corresponding to cases where FissureNet has a lower ASD compared to U-Net.
TABLE VI:
Average surface distance (ASD) and standard deviation of surface distances (SDSD) averaged over 3706 subject COPDGene testing dataset (TLC and FRC) and lung cancer testing dataset (4DCT). Distances reported in mm
| Dataset | Fissure | ASD |
SDSD |
||
|---|---|---|---|---|---|
| U-Net | FissureNet | U-Net | FissureNet | ||
| TLC | LOF | 3.75 | 0.65 | 10.56 | 2.14 |
| ROF | 4.83 | 0.57 | 12.78 | 2.06 | |
| RHF | 7.23 | 2.39 | 13.64 | 5.49 | |
| FRC | LOF | 2.32 | 0.66 | 6.93 | 1.66 |
| ROF | 4.03 | 0.53 | 10.38 | 1.43 | |
| RHF | 5.57 | 1.96 | 9.79 | 3.85 | |
| 4DCT | LOF | 2.97 | 0.62 | 9.06 | 1.36 |
| ROF | 6.50 | 1.97 | 13.86 | 2.88 | |
| RHF | 9.31 | 1.90 | 15.27 | 4.93 | |
Fig. 4:
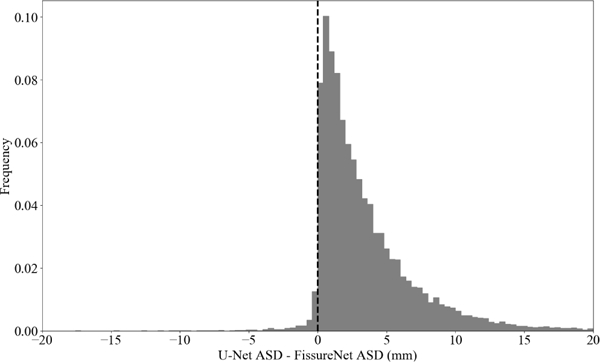
Histogram of differences in ASD between U-Net and FissureNet on a subject-by-subject basis.
Statistical testing was performed to test for significant differences in performance between methods with regards to evaluation metrics. Paired t-tests showed that FissureNet had a significantly greater PR-AUC and a significantly lower ASD compared to U-Net on both the COPDGene and lung cancer datasets (p < 0.001). Additionally, FissureNet had a significantly greater PR-AUC compared to Hessian on both the COPDGene and lung cancer datasets (p < 0.001).
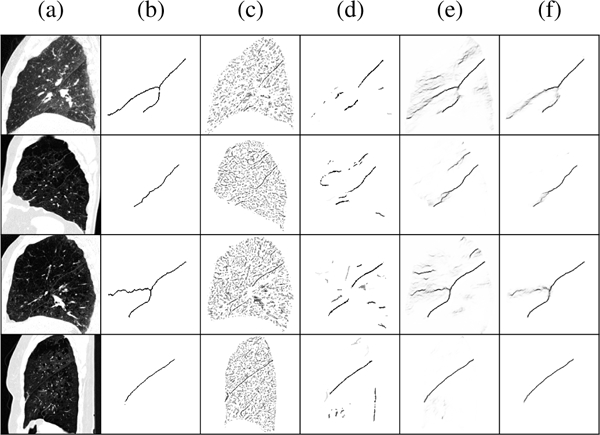
Representative fissure detection results are displayed in Fig. 5 for the COPDGene dataset and Fig. 6 for the lung cancer dataset. These results show DoS2 and U-Net have far fewer false positives compared to Hessian, however, FissureNet produces the fewest false positives while maintaining high sensitivity. The difference in false positive behavior between FissureNet and U-Net is further emphasized in Fig. 7, where surface renderings are annotated in red to depict false positives. The only post-processing performed to generate the renderings was thresholding at the optimal PR-AUC thresholds.
Fig. 5:

Representative results for four COPDGene subjects in rows one to four. (a) CT sagittal slice, (b) ground truth, (c) Hessian, (d) DoS2, (e) U-Net, (f) FissureNet. Top to bottom: GOLD1 FRC, GOLD3 TLC, GOLD3 FRC, GOLD4 TLC. DoS2 greatly reduces the number of false positives compared to Hessian, however, for these cases it fails to detect the horizontal fissure (rows 1 and 3). FissureNet and U-Net results are similar with high sensitivity and few false positives,however, FissureNet has fewer false positives.
Fig. 6:
Representative results for four lung cancer subjects in rows one to four. (a) CT sagittal slice, (b) ground truth, (c) Hessian, (d) U-Net, (e) FissureNet. Row 4 has a dense pathology superior to the horizontal fissure that is falsely detected by Hessian and U-Net, however, FissureNet correctly classifies this as non-fissure.
Fig. 7:
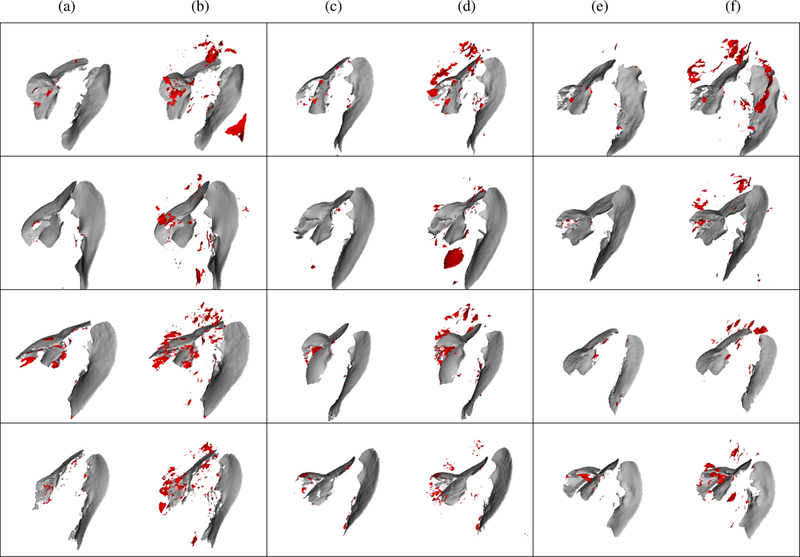
Surface renderings of FissureNet (a, c, e) and U-Net (b, d, f) results for six COPDGene subjects (rows 1 and 2) and six lung cancer subjects (rows 3 and 4). True positives and false positives are depicted in gray and red, respectively. Probability output was thresholded at optimal threshold for each method as determined by PR curve.
V. DISCUSSION
Existing fissure detection methods are limited to handcrafted and local features. These features typically suffer from low specificity as it is difficult to differentiate fissures from the other structures in the lung without global context. Additionally, it is difficult to design features that are robust against all fissure variations, especially for global compared to local features. To overcome the challenge of designing robust and discriminative features we use a deep learning approach to learn the feature detectors from labeled training cases. The main challenges associated with training a ConvNet to detect fissures in CT images are the size of the input images and the highly skewed class distributions.
The majority of ConvNets used in medical imaging applications use 2D image slices or use a sliding window approach with small image crops to overcome limitations in GPU memory. While this is a reasonable approach for some tasks, for fissure segmentation it is not desirable. The 3D appearance of a fissure is important to distinguish it from other structures that would otherwise appear similar on 2D slices. Global information provides additional context which is especially important when the fissure signal is weak, however, this information is not considered by patch-based approaches.
Compared to other segmentation architectures, Seg3DNet is an asymmetrical encoder-decoder network which uses less memory in order to accommodate a 3D network, larger input images, and more network levels. This allows for global information to be learned and results in higher specificity. By training separate Seg3DNets for the left and right lungs, we were able to reduce the size of the input image by a factor of two. This optimization does not degrade performance, as information from one lung does not provide global information for fissure detection in the other lung.
To handle the class imbalance, we use a coarse-to-fine ConvNet cascade: the first ConvNet learns the fissure ROI and the second ConvNet learns the precise fissure location. In addition to mitigating the effect of class imbalance, the fissure ROI classifier is more sensitive to weak and incomplete fissures. Since the second training phase weights the voxel misclassification costs by the probability of being in the fissure ROI, the contribution of costs from the large number of non fissure voxels is limited. Therefore, the class imbalance problem is mitigated while allowing for precise fissure prediction. A similar, and more elegant, approach would be to train a single network with two outputs: one for the fissure ROI and one for precise fissure prediction. However, current limitations on GPU memory do not allow for this.
Fully-connected layers are not used in Seg3DNet, making it a fully-convolutional network (FCN) [34]. This greatly reduces the number of parameters and makes the network less prone to overfitting; the proposed network has 3 million parameters compared to the popular VGG-16 network which has 138 million parameters. Furthermore, in a FCN the number of parameters is not dependent on the input image size, so the network can be trained and deployed on images of different sizes. Our network was trained on fixed-size image crops of 64×200×200 due to limited GPU memory, however, in some cases the entire lung field does not fit in this crop. At test time there is more memory available as mini-batches are not used and gradients do not need to be stored for backpropagation. As a result, at test time much larger inputs can be used. In fact, the entire lung region, regardless of size, can be used as input and inference can be done in one forward pass per image. This is extremely efficient compared to patchwise approaches. In addition, Seg3DNet can accommodate different input image sizes, avoiding aggressive rescaling and interpolation that might degrade the fissure signal.
This is the first study to evaluate a fissure detection method on a dataset of this size and diversity: 3706 COPDGene subjects with TLC and FRC scans and 20 lung cancer subjects with 4DCT scans. The COPDGene data used for training and evaluation came from 21 different institutions. Different scanner makes and models were used, as well as different reconstruction algorithms. The diversity of the evaluation set was further enriched with a lung cancer dataset of 4DCT scans. These scans were acquired at a lower dose during breathing, resulting in poorer image quality, motion blurring, and/or artifacts which were not present in the training dataset. Robustness to such diversity is generally a challenge when designing rule-based algorithms for image segmentation: it can be difficult to achieve similar performance across different scanning protocols and diseases.
Fissure detection performance was evaluated on four methods: Hessian-based, DoS, a deep learning approach using the U-Net architecture, and the proposed FissureNet. FissureNet and U-Net both greatly outperformed the Hessian and DoS methods on all datasets. Hessian and DoS methods were not able to detect weak fissures and produced many false positives at blood vessels and diseased regions. FissureNet consistently outperformed U-Net; while both methods demonstrated high sensitivity for fissure detection, FissureNet predicted fewer false positives. This can be attributed to the larger input patches and coarse-to-fine cascade, allowing the network to use more global context to differentiate true fissures from disease that resembles fissures.
On the COPDGene evaluation dataset, all methods performed better on TLC scans compared to FRC scans in terms of PR-AUC. However, in the COPDGene trial the TLC scans were acquired at a higher dose and thus the image quality was better, so better performance was expected. In the future, comparing images of the lung at different inspiration levels acquired using the same dose would help determine which inspiration level is best for fissure detection. Although the performance on FRC images was worse, the FissureNet results are nonetheless impressive for lower dose scans. This demonstrates the ability of FissureNet to generalize across different scanning protocols. The COPDGene dataset consisted of subjects with a wide range of disease severity, encompassing all GOLD stages. It is more challenging to detect fissures in heavily diseased cases as alterations in the underlying tissue can resemble the fissure and/or result in abnormal tissue appearance. Performance of FissureNet was robust to these challenges.
Training a multi-class network for the right lung results in the ability to distinguish between oblique and horizontal fissures. This is the first fissure detection method to make this distinction. Since the ultimate goal is to divide the lungs into lobes, unique predictions for different fissures facilitates straightforward post-processing. A limitation of training FissureNet using a ground truth containing only oblique and horizontal fissures is an inability to detect accessory fissures. While accessory fissures have exhibit similar local appearance compared to the major fissures, the proposed FissureNet learns high level information encoded in the particular shapes and orientations of the oblique and horizontal fissures. However, introducing an accessory fissure class and providing additional annotation in the training data could extend the network’s capability.
Detection of the right horizontal fissure was consistently worse than the oblique fissures for the COPDGene dataset. The orientation of the horizontal fissure is often parallel with the axial imaging plane, potentially obscuring the fissure in CT images. It is not uncommon for horizontal fissures to be ra-diographically incomplete or missing, hindering identification even by human analysts. Interestingly, on the 4DCT dataset the ROF has a higher ASD compared to the RF.
The COPDGene ground truth fissures used for evaluation have several limitations. The fissures were automatically extracted from lobar segmentations resulting in complete fissure boundaries for all cases even those with radiographically incomplete or missing fissures. In such cases, the extrapolated or interpolated fissure location is highly subjective and evaluating the performance of any automated method using such a ground truth is limited in these regions. Furthermore, the ground truth fissures in the COPDGene evaluation dataset were generated using the same method as the training dataset (Apollo software followed by manual correction). This introduces a bias for learning-based methods to identify complete fissures in unseen subjects regardless of actual fissure integrity. An additional possible bias may be attributed to the FissureNet and U-Net methods being trained on the COPDGene dataset, while the Hessian and DoS methods were developed on an independent dataset.
To address these limitations, evaluation was performed on a dataset of lung cancer subjects with 4DCT scans. The ground truth fissure segmentations for this dataset were generated manually. Additionally, both complete and visible-only fissures were annotated. All fissure detection methods performed worse on the 4DCT dataset compared to the COPDGene dataset. The 4DCT scans use a lower dose and commonly have motion artifacts and blurring, resulting in decreased fissure visibility. All methods performed better using the visible-only fissure ground truth.
A drawback of our method, and of deep learning in general, is the requirement of a large training dataset with ground truth segmentations. Manual segmentation is tedious, timeconsuming, and typically performed by a medical imaging expert analyst. Additionally, a high-end GPU card was required for training the network and such a card may not be available on a standard workstation. However, once the network is trained, it can be deployed on a low-end consumer GPU. Although there is a large overhead in training time (48 hours), processing time is only 20 seconds per image.
Tajbakhsh et al. [47] analyzed how well networks trained on natural images transferred to medical images and found pretraining resulted in improved or equal performance compared to random initialization. No transfer learning was used in this study due to limited availability of pretrained weights for 3D architectures. This is an area for potential further development.
The proposed method is designed exclusively for fissure detection and does not provide a complete lobar segmentation. However, the high specificity of our method facilitates lobar segmentation with simple post-processing (i.e. thresholding, morphological operations, and connected component analysis). For challenging cases with incomplete fissures, a more sophisticated surface-fitting technique might be used for postprocessing. For example, optimal surface finding graph search could be used to divide the lung into lobes, defining the graph costs by fissure probabilities.
VI. Conclusion
We have proposed a method for automatic detection of pulmonary fissures in CT images using a deep learning framework. We presented a novel coarse-to-fine cascade of ConvNets called FissureNet, and a novel 3D segmentation architecture called Seg3DNet. Fissure detection was evaluated with two rule-based methods (Hessian and DoS) and two learning-based methods (FissureNet and U-Net). The learning-based methods outperformed the rule-based methods. Furthermore, FissureNet outperformed U-Net as it was capable of learning larger-scale global features. FissureNet achieves high sensitivity for fissure detection while producing very few false positives, allowing for straightforward post-processing to obtain a final lobar segmentation. The results show that FissureNet is robust to different CT scanners, scanning protocols (low-dose and normal-dose), inspiration levels (TLC and FRC), imaging modalities (breath-hold vs. 4DCT), and severities of pulmonary disease.
Acknowledgment
This work was supported in part by NIH grant CA166703. S.E. Gerard received support from a Presidential Fellowship through the University of Iowa Graduate College and from a NASA Iowa Space Grant Consortium Fellowship.
We thank the COPDGene investigators for providing the image datasets used in this study. The COPDGene study is supported by NIH grants R01 HL089897 and R01 HL089856.
We gratefully acknowledge the support of NVIDIA for their donation of computer time on the NVIDIA PSG Cluster.
We would like to thank Yuanyuan Peng and Changyan Xiao for providing results from the DoS filter.
We gratefully acknowledge Jacob Herrmann for technical editing, language editing, and proofreading.
Footnotes
While Seg3DNet and the existing SegNet [33] are similar in name, the proposed Seg3DNet uses a different architecture and is not related to SegNet
Contributor Information
Sarah E. Gerard, Department of Biomedical Engineering, University of Iowa, Iowa City, IA, 52242 USA (joe-reinhardt@uiowa.edu).
Taylor J. Patton, Department of Medical Physics, University of Wisconsin-Madison, Madison, WI, 53705 USA.
Gary E. Christensen, Departments of Electrical and Computer Engineering and Radiation Oncology, University of Iowa, Iowa City, IA, 52242 USA..
John E. Bayouth, Department of Radiation Oncology, University of Wisconsin-Madison, Madison, WI, 53792 USA.
Joseph M. Reinhardt, Department of Biomedical Engineering, University of Iowa, Iowa City, IA, 52242 USA (joe-reinhardt@uiowa.edu)..
References
- [1].Valente IRS, Cortez PC, Neto EC, Soares JM, de Albuquerque VHC, and Tavares JMR, “Automatic 3D pulmonary nodule detection in CT images: A survey,” Computer methods and programs in biomedicine, vol. 124, pp. 91–107, 2016. [DOI] [PubMed] [Google Scholar]
- [2].Sorensen L, Shaker SB, and de Bruijne M, “Quantitative analysis of pulmonary emphysema using local binary patterns,” IEEE Transactions on Medical Imaging, vol. 29, no. 2, pp. 559–569, 2010. [DOI] [PubMed] [Google Scholar]
- [3].Remy-Jardin M, Remy J, Deschildre F, Artaud D, Beregi JP, Hossein-Foucher C, Marchandise X, and Duhamel A, “Diagnosis of pulmonary embolism with spiral CT: Comparison with pulmonary angiography and scintigraphy.” Radiology, vol. 200, no. 3, pp. 699–706, 1996. [DOI] [PubMed] [Google Scholar]
- [4].Coxson HO, “Quantitative computed tomography assessment of airway wall dimensions: Current status and potential applications for phenotyping chronic obstructive pulmonary disease,” Proceedings of the American Thoracic Society, vol. 5, no. 9, pp. 940–945, 2008. [DOI] [PMC free article] [PubMed] [Google Scholar]
- [5].Reinhardt JM, Ding K, Cao K, Christensen GE, Hoffman AA, and Bodas SV, “Registration-based estimates of local lung tissue expansion compared to xenon-CT measures of specific ventilation,” Med. Imag. Analysis, vol. 12, no. 6, pp. 752–763, December 2008. [DOI] [PMC free article] [PubMed] [Google Scholar]
- [6].Boueiz A, Chang Y, Cho MH, Washko GR, Estepar RSJ, Bowler RP, Crapo JD, DeMeo DL, Dy JG, Silverman EK, Castaldi PJ, and COPDGene Investigators, “Lobar emphysema distribution is associated with 5-year radiological disease progression,” Chest, 2017. [DOI] [PMC free article] [PubMed] [Google Scholar]
- [7].National Emphysema Treatment Trial Research Group, “Patients at high risk of death after lung-volume-reduction surgery,” N Engl J Med, vol. 2001, no. 345, pp. 1075–1083, 2001. [DOI] [PubMed] [Google Scholar]
- [8].Pan Y, Christensen GE, Durumeric OC, Gerard SE, Reinhardt JM, and Hugo GD, “Current- and varifold-based registration of lung vessel and airway trees,” in 7th International Workshop on Biomedical Image Registration, June 2016. [Google Scholar]
- [9].Koster TD and Slebos DJ, “The fissure: Interlobar collateral ventilation and implications for endoscopic therapy in emphysema,” Int J Chron Obstruct Pulmon Dis, vol. 11, pp. 765–773, 2016. [DOI] [PMC free article] [PubMed] [Google Scholar]
- [10].Koster TD, van Rikxoort EM, Huebner RH, Doellinger B, Klooster K, Charbonnier JP, Radhakr- ishnan S, Herth FJ, and Slebos DJ, “Predicting Lung Volume Reduction after Endobronchial Valve Therapy Is Maximized Using a Combination of Diagnostic Tools,” Respiration, vol. 92, no. 3, pp. 150–157, 2016. [DOI] [PubMed] [Google Scholar]
- [11].Eberhardt R, Gompelmann D, Herth FJ, and Schuhmann M, “Endoscopic bronchial valve treatment: Patient selection and special considerations,” Int J Chron Obstruct Pulmon Dis, vol. 10, pp. 2147–2157, 2015. [DOI] [PMC free article] [PubMed] [Google Scholar]
- [12].Gompelmann D, Schuhmann M, Kontogianni K, Heussel C, Tschirren J, Eberhardt R, and Herth FJF, “Fissure integrity and emphysema distribution in patients with severe chronic obstructive pulmonary disease,” Amer. J. Respiratory and Critical Care Medicine, p. A4985, 2017, (abstract). [Google Scholar]
- [13].Pu J, Wang Z, Gu S, Fuhrman C, Leader JK, Meng X, Tedrow J, and Sciurba FC, “Pulmonary fissure integrity and collateral ventilation in COPD patients,” PLoS ONE, vol. 9, no. 5, p. e96631, 2014. [DOI] [PMC free article] [PubMed] [Google Scholar]
- [14].Zhang L, Hoffman E, and Reinhardt JM, “Lung lobe segmentation in volumetric X-ray CT images,” IEEE Trans. Medical Imaging, vol. 25, no. 1, pp. 1–16, 2006. [DOI] [PubMed] [Google Scholar]
- [15].van Rikxoort EM, Prokop M, de Hoop B, Viergever MA, Pluim JP, and van Ginneken B, “Automatic segmentation of pulmonary lobes robust against incomplete fissures,” IEEE Transactions on Medical Imaging, vol. 29, no. 6, pp. 1286–1296, 2010. [DOI] [PubMed] [Google Scholar]
- [16].Kuhnigk J-M, Dicken V, Zidowitz S, Bornemann L, Kuemmerlen B, Krass S, Peitgen H-O, Yuval S, Jend HH, Rau WS et al. , “New tools for computer assistance in thoracic CT. Part 1. Functional analysis of lungs, lung lobes, and bronchopulmonary segments,” Radiographics, vol. 25, no. 2, pp. 525–536, 2005. [DOI] [PubMed] [Google Scholar]
- [17].Zhou X, Hayashi T, Hara T, Fujita H, Yokoyama R, Kiryu T, and Hoshi H, “Automatic segmentation and recognition of anatomical lung structures from highresolution chest CT images,” Computerized Medical Imaging and Graphics, vol. 30, no. 5, pp. 299–313, 2006. [DOI] [PubMed] [Google Scholar]
- [18].Ukil S and Reinhardt JM, “Anatomy-guided lung lobar surface detection in X-ray CT images,” IEEE Trans. Medical Imaging, vol. 28, no. 2, pp. 202–214, 2009, pMID: . [DOI] [PMC free article] [PubMed] [Google Scholar]
- [19].Lassen B, van Rikxoort EM, Schmidt M, Kerk- stra S, van Ginneken B, and Kuhnigk J-M, “Automatic segmentation of the pulmonary lobes from chest CT scans based on fissures, vessels, and bronchi,” IEEE Transactions on Medical Imaging, vol. 32, no. 2, pp. 210–222, 2013. [DOI] [PubMed] [Google Scholar]
- [20].Pu J, Zheng B, Leader JK, Fuhrman C, Knollmann F, Klym A, and Gur D, “Pulmonary lobe segmentation in CT examinations using implicit surface fitting,” IEEE Transactions on Medical Imaging, vol. 28, no. 12, pp. 1986–1996, 2009. [DOI] [PMC free article] [PubMed] [Google Scholar]
- [21].Doel T, Gavaghan DJ, and Grau V, “Review of automatic pulmonary lobe segmentation methods from CT,” Computerized Medical Imaging and Graphics, vol. 40, pp. 13–29, 2015. [DOI] [PubMed] [Google Scholar]
- [22].Frangi AF, Niessen WJ, Vincken KL, and Viergever MA, “Multiscale vessel enhancement filtering,” in International Conference on Medical Image Computing and Computer-Assisted Intervention Springer, 1998, pp. 130–137. [Google Scholar]
- [23].Sato Y, Nakajima S, Shiraga N, Atsumi H, Yoshida S, Koller T, Gerig G, and Kikinis R, “Three-dimensional multi-scale line filter for segmentation and visualization of curvilinear structures in medical images,” Medical Image Analysis, vol. 2, no. 2, pp. 143–168, 1998. [DOI] [PubMed] [Google Scholar]
- [24].Li Q, Sone S, and Doi K, “Selective enhancement filters for nodules, vessels, and airway walls in two-and threedimensional CT scans,” Medical Physics, vol. 30, no. 8, pp. 2040–2051, 2003. [DOI] [PubMed] [Google Scholar]
- [25].Wiemker R, Bulow T, and Blaffert T, “Unsupervised extraction of the pulmonary interlobar fissures from high resolution thoracic CT data,” in International Congress Series, vol. 1281 Elsevier, 2005, pp. 1121–1126. [Google Scholar]
- [26].Lopez AM, Lloret D, Serrat J, and Villanueva JJ, “Multilocal creaseness based on the level-set extrinsic curvature,” Computer Vision and Image Understanding, vol. 77, no. 2, pp. 111–144, 2000. [Google Scholar]
- [27].Klinder T, Wendland H, and Wiemker R, “Lobar fissure detection using line enhancing filters.” in Medical Imaging: Image Processing, 2013, p. 86693C. [Google Scholar]
- [28].Xiao C, Staring M, Wang J, Shamonin DP, and Stoel BC, “A derivative of stick filter for pulmonary fissure detection in CT images,” in SPIE Medical Imaging. International Society for Optics and Photonics, 2013, pp. 86 690V–86 690V. [Google Scholar]
- [29].Xiao C, Stoel BC, Bakker ME, Peng Y, Stolk J, and Staring M, “Pulmonary fissure detection in CT images using a derivative of stick filter,” IEEE Transactions on Medical Imaging, vol. 35, no. 6, pp. 1488–1500, 2016. [DOI] [PubMed] [Google Scholar]
- [30].van Rikxoort EM, van Ginneken B, Klik M, and Prokop M, “Supervised enhancement filters: Application to fissure detection in chest CT scans,” IEEE Transactions on Medical Imaging, vol. 27, no. 1, pp. 1–10, 2008. [DOI] [PubMed] [Google Scholar]
- [31].Wei Q, Hu Y, MacGregor JH, and Gelfand G, “Automatic recognition of major fissures in human lungs,” International Journal of Computer Assisted Radiology and Surgery, vol. 7, no. 1, pp. 111–123, 2012. [DOI] [PubMed] [Google Scholar]
- [32].Ronneberger O, Fischer P, and Brox T, “U-net: Convolutional networks for biomedical image segmentation,” in International Conference on Medical Image Computing and Computer-Assisted Intervention Springer, 2015, pp. 234–241. [Google Scholar]
- [33].V. Badrinarayanan, A. Kendall, and R. Cipolla, “SegNet: A deep convolutional encoder-decoder architecture for image segmentation,” arXiv preprint arXiv:1511.00561, 2015. [DOI] [PubMed]
- [34].Shelhamer E, Long J, and Darrell T, “Fully convolutional networks for semantic segmentation,” IEEE Transactions on Pattern Analysis and Machine Intelligence, vol. 39, no. 4, pp. 640–651, 2017. [DOI] [PubMed] [Google Scholar]
- [35].Rumelhart DE, Hinton GE, and Williams RJ, “Learning representations by back-propagating errors,” Nature, vol. 323, no. 6088, p. 533, 1986. [Google Scholar]
- [36].Noh H, Hong S, and Han B, “Learning deconvolution network for semantic segmentation,” in Proceedings of the IEEE International Conference on Computer Vision, 2015, pp. 1520–1528. [Google Scholar]
- [37].Ioffe S and Szegedy C, “Batch normalization: Accelerating deep network training by reducing internal covariate shift,” in International Conference on Machine Learning, 2015, pp. 448–456. [Google Scholar]
- [38].Nair V and Hinton GE, “Rectified linear units improve restricted boltzmann machines,” in Proceedings of the 27th international conference on machine learning (ICML-10), 2010, pp. 807–814. [Google Scholar]
- [39].Theano Development Team, “Theano: A Python framework for fast computation of mathematical expressions,” arXiv e-prints, vol. abs/1605.02688, May 2016. [Online]. Available: http://arxiv.org/abs/1605.02688
- [40].Dieleman S, Schlter J, Raffel C, Olson E, Snderby SK, Nouri D et al. , “Lasagne: First release.” Aug. 2015. [Online]. Available: 10.5281/zenodo.27878 [DOI]
- [41].D. Kingma and J. Ba, “Adam: A method for stochastic optimization,” arXiv preprint arXiv:1412.6980, 2014.
- [42].Glorot X and Bengio Y, “Understanding the difficulty of training deep feedforward neural networks,” in Proceedings of the Thirteenth International Conference on Artificial Intelligence and Statistics, 2010, pp. 249–256. [Google Scholar]
- [43].Regan EA, Hokanson JE, Murphy JR, Make B, Lynch DA, Beaty TH, Curran-Everett D, Silverman EK, and Crapo JD, “Genetic epidemiology of COPD (COPDGene) study design,” COPD: Journal of Chronic Obstructive Pulmonary Disease, vol. 7, no. 1, pp. 32–43, 2011. [DOI] [PMC free article] [PubMed] [Google Scholar]
- [44].Buist AS, Vollmer WM, and McBurnie MA, “Worldwide burden of COPD in high- and low-income countries. Part I. The burden of obstructive lung disease (BOLD) initiative,” Int. J. Tuberc. Lung Dis., vol. 12, no. 7, pp. 703–708, July 2008. [PubMed] [Google Scholar]
- [45].Wan ES, Castaldi PJ, Cho MH, Hokanson JE, Regan EA, Make BJ, Beaty TH, Han MK, Curtis JL, Curran-Everett D, Lynch DA, DeMeo DL, Crapo JD, and Silverman EK, “Epidemiology, genetics, and subtyping of preserved ratio impaired spirometry (PRISm) in COPDGene,” Respiratory research, vol. 15, no. 1, p. 89, 2014. [DOI] [PMC free article] [PubMed] [Google Scholar]
- [46].Saito T and Rehmsmeier M, “The precision-recall plot is more informative than the ROC plot when evaluating binary classifiers on imbalanced datasets,” PloS one, vol. 10, no. 3, p. e0118432, 2015. [DOI] [PMC free article] [PubMed] [Google Scholar]
- [47].Tajbakhsh N, Shin JY, Gurudu SR, Hurst RT, Kendall CB, Gotway MB, and Liang J, “Convolutional neural networks for medical image analysis: Full training or fine tuning?” IEEE Transactions on Medical Imaging, vol. 35, no. 5, pp. 1299–1312, 2016. [DOI] [PubMed] [Google Scholar]