Abstract
The inherent heterogeneity of tumor tissue presents a major challenge to nanoparticle-mediated drug delivery. This heterogeneity spans from the molecular (genomic, proteomic, metabolomic) to the cellular (cell types, adhesion, migration) and to the tissue (vasculature, extra-cellular matrix) scales. In particular, tumor vasculature forms abnormally, inducing proliferative, hypoxic, and necrotic tumor tissue regions. As the vasculature is the main conduit for nanotherapy transport into tumors, vasculature-induced tissue heterogeneity can cause local inadequate delivery and concentration, leading to subpar response. Further, hypoxic tissue, although viable, would be immune to the effects of cell-cycle specific drugs. In order to enable a more systematic evaluation of such effects, here we employ computational modeling to study the therapeutic response as a function of vasculature-induced tumor tissue heterogeneity. Using data with three-layered gold nanoparticles loaded with cisplatin, nanotherapy is simulated interacting with different levels of tissue heterogeneity, and the treatment response is measured in terms of tumor regression. The results quantify the influence that varying levels of tumor vascular density coupled with the drug strength have on nanoparticle uptake and washout, and the associated tissue response. The drug strength affects the proportion of proliferating, hypoxic, and necrotic tissue fractions, which in turn dynamically affect and are affected by the vascular density. Higher drug strengths may be able to achieve stronger tumor regression but only if the intra-tumoral vascular density is above a certain threshold that affords sufficient transport. This study establishes an initial step towards a more systematic methodology to assess the effect of vasculature-induced tumor tissue heterogeneity on the response to nanotherapy.
Keywords: Cancer nanotherapy, gold nanoparticles, mathematical modeling, cancer simulation, cisplatin, tumor heterogeneity, lung cancer
INTRODUCTION
Although nanoparticle-mediated drug delivery offers the promise of more targeted and effective treatment of cancer, few of the myriad of formulations evaluated in the laboratory have reached clinical application. Major hurdles have included concerns about toxicity, lower than expected efficacy, and off-target effects 36. In particular, the tumor microenvironment can present a formidable barrier that not only hinders the transport of drug molecules but also that of nano-sized vehicles 20, 39, 45. In order to be effective, nanoparticle-mediated drug delivery needs to avoid uptake by the reticulo-endothelial system (RES), utilize the vascular network to preferentially reach the tumor site and penetrate into cancerous tissue, diffuse through the extra-cellular matrix (ECM) mesh of proteins, remain close or be uptaken by the cancer cells, and efficiently release the payload of drug molecules to achieve cytotoxicity. To address these requirements and increase the efficacy of chemotherapy, nanoparticles can be functionalized in various ways to help reduce systemic distribution and avoid intrinsic cellular resistance mechanisms 1, 25. Yet uncoordinated angiogenic stimuli by cancer and stromal cells in the tumor microenvironment induce a heterogeneous vascular response, characterized by tortuous vessels with abnormal structure and irregular flow 22, 37. The inadequacy of the vascular network promotes intra-tumoral tissue regions with heterogeneous proliferative, hypoxic, and apoptotic states, while severely impairing the transport of and the response to systematically-administered drugs and nanoparticles.
The efficacy of nanoparticles in cancer treatment is typically evaluated with in vitro and in vivo experimental models, indispensable for pre-clinical evaluation. However, in vitro models lack key features of cancerous tissue found in vivo, including a vascular network, while in vivo models present challenges due to systemic interactions that may be difficult to tease apart. As a complement to these experimental approaches, computational simulation of cancer nanotherapy has aimed to provide the capability for system-level analysis 9, 16, 18, 19, 24, 27–30, 43, 44, 46. In particular, we have recently studied via mathematical modeling the extravasation, uptake, and distribution of nanoparticles subject to heterogeneous tumor tissue and vascular conditions 5, 6, 40.
The distribution and penetration of 2- and 3-layered gold nanoparticles were recently evaluated in vitro 14 and in vivo 12. The purpose of these nanoparticles was to increase chemotherapy efficacy 10, 13 via enhanced distribution and penetration into heterogeneous tumor tissue. The 3-layer gold nanoparticles were functionalized with phosphatidylcholine, hexadecanethiol and high-density lipoprotein 14. Computational modeling was employed 5 to simulate the performance of these nanoparticles in vivo given measurements in vitro, with the goal to begin bridging the gap from the pre-clinical to the clinical setting. The model parameters were set from experimental measurements with 2D and 3D cultures of A549, H358, and PC9 Non-Small Cell Lung Cancer (NSCLC) cells 13, 14.
In this study, computational simulation is employed to evaluate the role of vascular density-induced heterogeneity on the distribution of 3-layered gold nanoparticles in tumor tissue and the associated drug release. Small metastatic lesions are simulated in a well vascularized organ, such as the lung, and cisplatin is chosen as the model drug. The nanoparticle effectiveness is evaluated for tumors of various blood vessel densities after bolus administration of the drug loaded nanoparticles. The fractions of control are defined to be the smallest tumor size after nanoparticles are introduced into the system divided by the tumor size immediately before the start of treatment. Tumor therapy is simulated with various drug inhibitory concentrations calibrated to achieve a 50% reduction in tumor size (IC50) at four timepoints (24hr, 48hr, 72hr, 96hr) post treatment initiation, thus respectively defining four levels of decreasing drug strength. This work represents a first step towards quantifying tumor response to drug-loaded nanoparticles based on vascular-network induced tissue heterogeneity.
MATERIALS AND METHODS
Nanoparticle Synthesis and Characterization
Three-layered nanoparticles were previously created in 14. Briefly, citrate-stabilized gold nanoparticles were synthesized by reducing chloroauric acid with trisodium citrate 15. The first layer applied was 1-Hexadecanethiol (TL), followed by phosphatidylcholine (PC), and then HDL. Nanoparticles were characterized via extinction spectra using ultraviolet-visible (UV-Vis) spectrometry, zeta potential measurements, DLS (dynamic light scattering) to determine hydrodynamic size (intensity distribution) in solution, determination of shape and size with scanning electron microscopy (SEM), and confirmation of presence of lipids on the particle cores using a Fourier transform infrared (FTIR) instrument. Cisplatin (7.5 mg) was then added to the nanoparticles in solution and allowed to react for 2 h 14.
Experimental Nanoparticle Data
The 3-layer gold nanoparticles were previously characterized as having a maximum wavelength of 5.35 nm, a hydrodynamic diameter of 80.2 ± 12.4 nm, and a zeta potential of −6 mV 5. Cisplatin loading efficiency was 78.9 ± 0.7% 5. The nanoparticles released 59.1 ± 2.0% of drug within the first 3 hours, 76.7 ± 1.84% within 48 h, and 78.9 ± 2.1% by 96 h 13.
Experimental Cytotoxicity Data
As described in 14, A-549 cells were maintained in standard culture conditions, and used to form 3D tumor spheroids. Cytotoxicity was first measured in 3D cell culture with free drug at varying concentrations (1024, 256, 64, 16, 4, 1, 0.25, 0.0625 µM) for 48 h. The spheroids were exposed to varying concentrations of drug-loaded nanoparticles calculated by considering two parameters: (1) the loading efficiency from HPLC data showing the exact concentration of drug encapsulated onto the nanoparticles 13 and (2) the percent of drug released over the 48-hour period.
Computational Modeling
1. Tumor Growth
The tumor growth component is based on 34, 47, for which tumor tissue is divided into three regions: a proliferating region where cells have sufficient oxygen and nutrients to proliferate, a hypoxic region where cells have sufficient oxygen and nutrients to survive but insufficient for proliferation, and a necrotic region where cells lack sufficient oxygen and nutrients for survival. The tumor growth velocity vc follows a generalized Darcy’s Law 34:
| [Equation 1] |
where μ is cell-mobility, P is oncotic pressure, χE is haptotaxis, and E is the density of the extracellular matrix (ECM). Refer to 34 for a more detailed description of E and χE. The overall tumor growth can be associated with the rate of volume change by assuming that the cell density within the proliferating region remains constant:
| [Equation 2] |
where λp is the net proliferation rate (described below).
2. Angiogenesis
The angiogenesis component is based on 35 to represent blood flow, vascular leakage and vascular network remodeling resulting from wall shear stress and mechanical stress imposed by the tumor tissue as it spatially evolves in time. Briefly, as the tumor grows within a vascularized environment, the tissue has access to oxygen and nutrients diffusing from the vasculature. The interstitial flow of oxygen and nutrients is influenced by tissue pressure and by distance from the nearest vessel. Refer to 34, 47 for a more detailed description of the angiogenesis model.
3. Transport of oxygen and nutrients
Oxygen and nutrients σ are transported to the tumor from the location of extravasation from the vasculature. The extravasation represents the rate that σ are supplied from the vasculature. These substances, diffusing with diffusivity Dσ, are taken up by host tissue, proliferating tumor regions and hypoxic tissue with rates , , and qs, respectively, and decay with rate in the necrotic region. Under steady-state conditions, the formulation of oxygen and nutrient uptake and decay is 34, 44, 47:
| [Equation 3] |
where x is position, t is time, 1vessel is the characteristic function for the vasculature (equals 1 at vessel locations and 0 otherwise), pi is interstitial pressure, h is the hematocrit in the vascular network, and λσ is the rate of uptake and decay of σ as defined above 34. Extravasation is modulated by the extravascular interstitial pressure pi, scaled by the effective pressure pe. The weight of the convective transport component of small molecules is 44:
| [Equation 4] |
and hmin are constants that represent the normal and minimum hematocrit necessary for oxygen extravasation, respectively. represents the constant transfer rate from pre-existing and tumor-induced vessels.
4. Transport of nanoparticles
Nanoparticle transport s through the tumor tissue is simulated from the point of extravasation from the vasculature. The uptake rate of nanoparticles by host and tumor cells is 44, 46:
| [Equation 5] |
Under the assumption that the transfer rate from vessels is constant, nanoparticle extravasation is: represented by 44, 46:
| [Equation 6] |
where diffusion of particles into the tumor tissue is modulated by the interstitial pressure 44. Particle extravasation is assumed to be , where is the initial concentration 44. The extravasation is concentration dependent, simulating first order kinetics. The decay constant α is measured from previous in vivo experiments, in which the particle half-life is estimated to be 12 hours 11. The diffusivity Ds was calibrated from the combination of nanoparticle charge and size properties, based on measurements obtained in vitro 14.
5. Transport of drug
Drug G is released at the point of extravasated particles and diffuses through the tumor tissue with diffusivity DG. The rate combines the effects of drug uptake by tumor and normal cells and the wash-out from the interstitial space, and reflects the half-life of the drug 5:
| [Equation 7] |
The drug release from the particles is approximated by 5:
| [Equation 8] |
is the release of drug, fitted in time to follow the results obtained from the in vitro experiments in 13. The drug release rate thus combines the effect of particle concentration and the drug release profile. All diffusion equations are subject to the boundary condition where B is the diffusible substance.
6. Drug effect on tumor
Cisplatin is a cell cycle dependent drug; hence, its cytotoxic effect is only exerted on proliferating cells. Drug effect is included into the proliferation term λp, where is the rate of drug-induced cell death 46:
| [Equation 9] |
Here, λA is the apoptosis rate, λM is the mitosis rate, and GN is the non-dimensional rate of volume loss in the necrotic tumor core (assuming that cellular debris is constantly degraded and the fluid is removed34). This pharmacodynamic model assumes that cell proliferation and apoptosis rates are similar before and after drug therapy, and that cell death is instantaneous.
7. Calibration of Rate of Drug-Induced Cell Death
The model parameters for oxygen, drug effect and tumor growth were calibrated using data obtained experimentally with NSCLC tumor spheroids to find an 48hr IC50 for simulated avascular spheroids (in vitro simulations) 14. A detailed description of the in vitro experiments used to calibrate the simulations can be found in 5, which includes the synthesis, functionalization, characterization, drug loading, and drug release of the nanoparticles and cytotoxicity experiments in 2D and 3D cell cultures. The free drug concentration after 48 h of exposure was set based on the data from our previous study 5. The drug effect was determined via interpolation (running multiple simulations with different values) to obtain a tumor that had shrunk by half within the 48h of simulated drug exposure. This value was assigned the units of the drug concentration that had achieved the 50% regression with the tumor spheroids in the experiments in vitro 5. The 24hr, 72hr, and 96hr IC50 avascular treatment drug concentrations were scaled by the same proportion as the change in the drug effect. The trapezoid method was used to calculate the corresponding areas-under the-curve (AUC’s) to quantify the avascular IC50’s. Thus, the AUC’s are proportional to the drug effect at each IC50.
8. Tumor Tissue Heterogeneity
The values for drug-induced cell death used for the avascular IC50’s were employed in therapy simulations with vascularized lesions (simulations of in vivo condition). To link the differences in drug effect to the effects of heterogeneous vascularization density, the in vivo simulations used the same nanoparticle concentration in a bolus dose as was needed in the in vitro simulations to achieve the IC50. Simulated tumors were grown to the same initial radius of 0.57 mm with the same pre-existing vessel densities, but different oxygen thresholds for hypoxia and necrosis. In vivo simulations were run for a sufficient amount of time to obtain the smallest tumor radii following NP bolus injection, and were used to compare the efficacy of cisplatin-loaded nanoparticles among the various cases. The tumor blood vessel density was calculated by dividing vessel surface area (vessel length x vessel cross sectional area) by the tumor area. The tumor, nanoparticle, and drug main parameters and their values are summarized in Table 1.
Table 1:
Computational model main parameters and associated values. All other model parameters are as in 47.
| Parameter | Value | Reference |
|---|---|---|
| Tumor proliferation rate (λp ) | 1 day−1 | Measured in 5 |
| Oxygen diffusivity (Dσ) | 1 (*) | 47 |
| Oxygen transfer rate from vasculature |
5 (*) | 47 |
| Oxygen uptake rate by proliferating tumor cells |
1.5 (*) | 47 |
| Oxygen uptake rate by hypoxic tumor cells (qs) |
1.3 (*) | 47 |
| Oxygen uptake rate by tumor microenvironment |
0.12 (*) | 47 |
| Oxygen decay rate (λσ) | 0.35 (*) | 47 |
| NP extravasation from angiogenic vs. normal vessels |
10 | Estimated |
| NP diffusivity (Ds) | 0.3 (*) | 14 |
| NP decay (α) | 12hr half-life | Estimated |
| CDDP diffusivity (DG) | 0.6 (*) | Estimated |
| CDDP drug effect | 27, 9.45, 5.6, 4.0 (for 24, 48, 72, and 96 h IC50) |
Calibrated to experimental data |
| CDDP decay rate | 0.5hr half-life | 26 |
| CDDP release profile from NP | Data shown in Figure 5B in 13 |
Measured in 13 |
| CDDP in vitro IC50 (48 h) for A549 cells (spheroid) |
15.9 ± 1.2 μM | Measured in 5 |
Four levels of tissue heterogeneity were obtained, respectively labeled VERY LOW, LOW, MEDIUM and HIGH, by varying the angiogenesis-induced tissue vascularization based on the response to tumor angiogenic factors (TAF) released in proportion to the tumor tissue hypoxic level. In Table 2, the hypoxic threshold defines the oxygen level at which tissue becomes hypoxic (quiescent but still viable) and ceases to proliferate, while the necrotic threshold defines the oxygen level at which the tissue becomes necrotic (not viable).
Table 2:
Definition of levels of tumor tissue heterogeneity based on the thresholds for inducing hypoxia and necrosis.
| Level of Tissue Heterogeneity | Tumor hypoxic threshold | Tumor necrotic threshold |
|---|---|---|
| VERY LOW | 0.305 | 0.300 |
| LOW | 0.405 | 0.400 |
| MEDIUM | 0.485 | 0.480 |
| HIGH | 0.575 | 0.570 |
The values for HIGH were based on the previously calibrated tumors simulated in 47, set so that the vasculature network provides sufficient oxygen (σ ranging from 0.76 to 1.00) to support normal tissue metabolism. These values led to a highly vascularized tumor microenvironment and, consequently, to high tissue heterogeneity. At the other end of the spectrum, the values for VERY LOW were chosen so that no more than 95% of the tumor was proliferating. In this case, vascularization was minimized along with the tissue heterogeneity. The intermediate LOW and MEDIUM conditions were defined by growing tumors to the same size and finding values for these thresholds so that the respective proliferative fractions were incrementally in between the VERY LOW and HIGH cases.
9. Numerical Methods
The numerical implementation is detailed in 47 and references therein. Briefly, in all equations that involve a diffusion term, a fully nonlinear diffusion solver was used to solve the equation, . The equations were discretized in space using centered finite difference approximations and the backward Euler time-stepping algorithm. The equations were then solved using a nonlinear adaptive Gauss-Seidel iterative method 32, 33. This system of equations was iteratively solved together to steady state at each timestep, to obtain the concentration of diffusible elements and the tumor oncotic pressure. The level set method was used to update the tumor viable/necrotic region as well as the interfaces between the tumor viable–necrotic and tumor–host tissue regions. The model implementation in C/C++ was run on a Asus PC with an Intel Core i7 processor and 24 Gb RAM.
RESULTS
Simulation of heterogeneous tumor growth
Tumors were first grown to the same size under the conditions of VERY LOW, LOW, MEDIUM and HIGH heterogeneity, as defined in Table 2. The simulated tumors during the initial growth phase are shown in Figure 1. Depending on the level of heterogeneity, this growth took varying amounts of time, with the HIGH case taking the longest (22.7 simulated days). The tissue heterogeneity is characterized in Figure 2 as a function of the tumor radius. Lower oxygen thresholds for hypoxia and necrosis, as in the case of VERY LOW heterogeneity, allow the tumor to have more proliferative tissue because a lower concentration of oxygen/nutrients is required for the tissue to thrive. In cases of higher oxygen thresholds, as with HIGH heterogeneity, more oxygen is required for the tissue to thrive. The angiogenesis component of the model is thus activated to generate more blood vessels, which supplies the tumor tissue with increased oxygen and nutrients. Angiogenesis is stimulated by the concentration of tumor angiogenic factors, which are released by the tumor hypoxic regions. Tumors with a higher fraction of hypoxic tissue (higher oxygen threshold), as in the case of HIGH heterogeneity, would be expected to release more tumor angiogenic factors.
Figure 1.
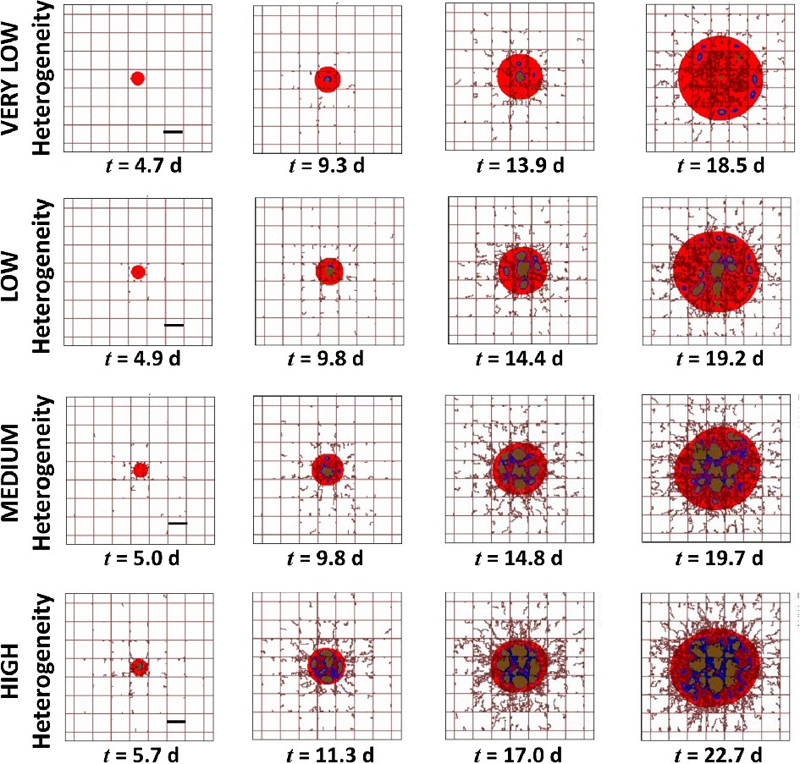
Simulation of tumor nodules growing in time with different levels of vasculature-induced tissue heterogeneity. Red color denotes the proliferating region, blue indicates hypoxia, and brown means necrosis. The pre-existing capillary grid is shown as rectangular lines along with irregular sprouts growing from them due to the angiogenesis process. Bar: 250 μm.
Figure 2.
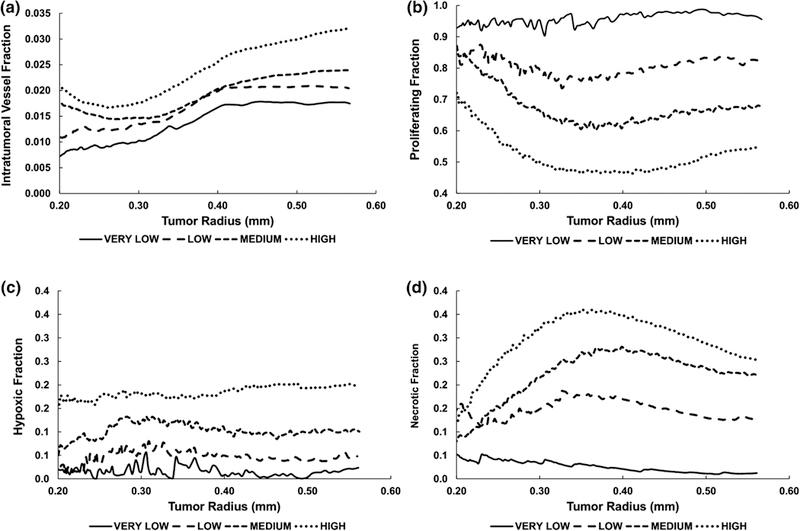
Characterization of tumor tissue heterogeneity, defining the four levels of heterogeneity in this study. (A) Intra-tumoral vascular fraction (vascular surface area divided by tumor area); (B) Proliferating fraction; (C) Hypoxic fraction; (D) Necrotic fraction.
While the intra-tumoral vessel density initially increased for the VERY LOW and LOW cases, it plateaued for radii beyond 0.40 mm (Figure 2A). In contrast, the density for MEDIUM and HIGH conditions first decreased for radii below 0.31 and 0.28 mm, respectively, before becoming larger. The angiogenesis model was calibrated in previous work 47 based on experimental data of tumor growth, and these results are consistent with this calibration. The proliferative tissue fraction corresponding to these vascular densities indicates that for a radius of 0. 57 mm at the start of treatment, these fractions were 0.96, 0.82, 0.68, and 0.55 for VERY LOW, LOW, MEDIUM and HIGH conditions, respectively (Figure 2B). At this radius, the hypoxic tissue fractions were correspondingly lower, at 0.02, 0.05, 0.10, and 0.20 (Figure 2C), while the necrotic fractions were 0.01, 0.12, 0.22, and 0.25, respectively. Compared to the more stable values for the proliferating and hypoxic fractions as the tumor radius increased, the necrotic fractions (Figure 2D) (except for the VERY LOW condition) exhibited an initial steep increase followed by a gentle decline past 0.350 mm as the proliferating portion slowly started gaining in value. The proliferating fractions increased while the necrotic fractions decreased due to the higher vessel density (more oxygen being transported into the tissue as it grew; Figure 2A). The hypoxic fractions remained relatively stable over time due to the level of angiogenic activity, as previously calibrated. The tumor viable (proliferating and hypoxic) fractions at the start of treatment are summarized in Table 3.
Table 3.
Tumor viable (proliferating and hypoxic) fractions at the start of treatment as a function of tissue heterogeneity.
| Level of Tissue Heterogeneity |
Tumor Viable Fraction |
|---|---|
| VERY LOW | 0.98 |
| LOW | 0.87 |
| MEDIUM | 0.78 |
| HIGH | 0.75 |
Calibration of drug effect
A simulated tumor growing in the dish in vitro, surrounded by plentiful oxygen and nutrients, is shown in Figure 3A. This in silico tumor was exposed after 30 d to drug for 48 h to determine the value for the drug effect to achieve a 50% reduction in tumor size (Figure 3B). A range of area-under-the-curve values was obtained for different exposure times, as described in Methods, and summarized in Table 4.
Figure 3.
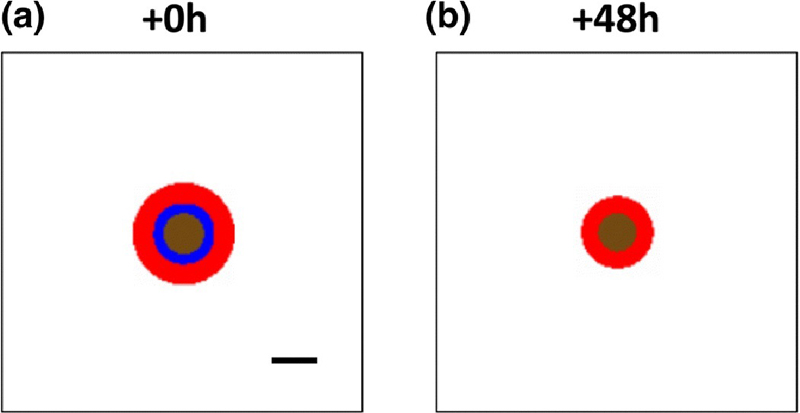
Simulated tumor growing in avascular conditions in vitro. Red: proliferating tissue; blue: hypoxic tissue; brown: necrotic tissue. Bar: 250 μm.
Table 4.
Area-under-curve (AUC) calculated for the IC50 obtained at four different ranges of time for a simulated tumor spheroid growing in in vitro conditions.
| IC50 Range of Time | AUC (μM.h) |
|---|---|
| 24hr IC50 | 1082 |
| 48hr IC50 | 760 |
| 72hr IC50 | 676 |
| 96hr IC50 | 644 |
Simulation of nanoparticle-mediated drug delivery
Representative simulation images of vascularized tumors at the start of treatment (the time immediately after the bolus injection) with the various levels of tissue heterogeneity are shown in Figure 4. As the heterogeneity increases from VERY LOW to HIGH, the penetration and spatial distribution of nanoparticles and the drug released from them correspondingly becomes more heterogeneous. The deepest nanoparticle penetration is achieved with the VERY LOW case, for which the drug release is concentrated in the inner core of the tumor. In contrast, in the HIGH case the nanoparticles become stuck in the tumor periphery, unable to penetrate into the tissue. This is consistent with previous modeling work showing that tumor tissue heterogeneity leads to inhomogeneous small molecular and nanoparticle distribution, with the highest concentrations occurring on the periphery 8, 17. Interestingly, although in the LOW case the nanoparticles penetrate deeper, their concentration is more heterogeneously distributed than in the MEDIUM case, suggesting that the relationship between heterogeneity and nanoparticle penetration is not linear 8, 17.
Figure 4.
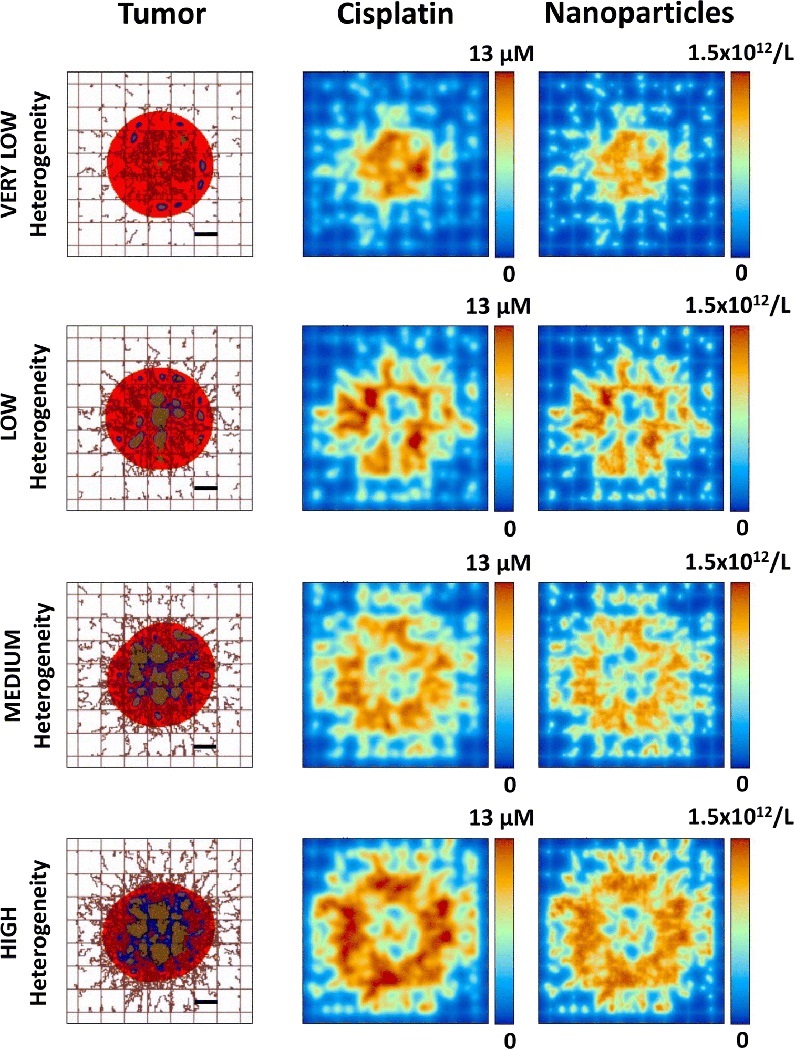
Representative simulation images of vascularized tumors with various levels of heterogeneity shown at the start of treatment (immediately after bolus injection) with cisplatin-loaded nanoparticles. At this time, nanoparticles and drug can be seen within the system but the tumor tissue has not yet responded to the effect of the drug. Red: proliferating tissue; blue: hypoxic tissue; brown: necrotic tissue. Bar: 250 μm.
It is to be noted that the spatial distribution of the neo-vasculature in the simulations (e.g., as in Figures 1 and 4) is stochastic because randomness is built into the method of migration of the endothelial cells along the gradient of angiogenic factors 34, 47, in order to more accurately simulate the angiogenesis process. Hence, running multiple simulations using the same parameters will result in tumors with slightly different vasculature layouts and tissue fractions. These differences are very small, and running multiple simulations (n=3) with the same parameters has confirmed that there is no significant difference between the obtained results.
The nanoparticle concentration within tumor tissue for each value of the drug strength (respectively based on 24, 48, 72, and 96 h IC50 values in vitro) is shown in Figure 5. The initial sharp increase in nanoparticle concentration reflects the bolus injection of nanoparticles into the system. In the case of the 24 h IC50 value, the concentrations are similar regardless of level of tissue heterogeneity, with an initial sharp peak at 2.5 h post-treatment initiation followed by a sharp drop to 35% of initial concentration within 4 h. The concentration then declines slowly afterwards, to 10% of initial by 30 h. For the other three drug strengths, the LOW case exhibits the highest concentration of nanoparticles overall, with 30% still in tissue after 30 h. For the 48h IC50 case, the VERY LOW case retains the second highest concentration, while for both 72 and 96 h, it is similar to the MEDIUM and HIGH conditions, decreasing to 20% of initial value by 30 h. Noticeably, the nanoparticle concentrations are more heterogeneous in time for the 48 and 72 h cases, while the 24 and 96 h evince more consistent profiles. This suggests that the drug strength is also a key parameter that influences the nanoparticle concentration as the tissue responds temporally and spatially to the drug, and is consistent with recent findings from an optimization model applied to this tumor model system 3.
Figure 5.
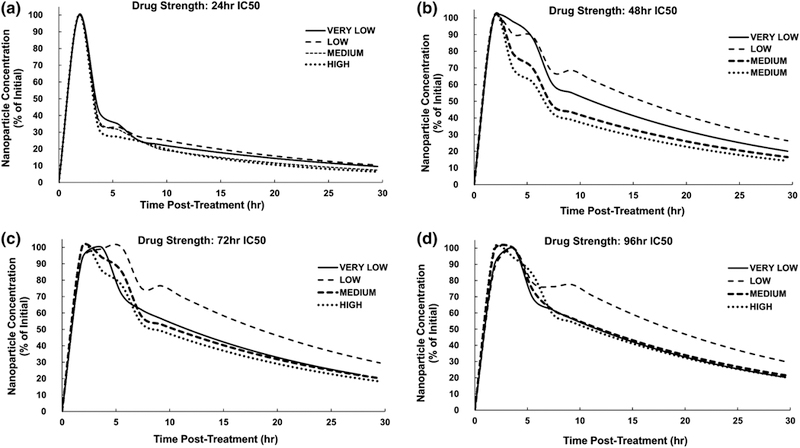
Nanoparticle concentration (as a percent of initial amount) within tumor tissue after injection, for each level of tissue heterogeneity at the various IC50-based drug strength values.
The drug release from the nanoparticles within the first 4 h for the various drug strengths is shown in Figure 6. Consistently, the highest concentrations were achieved for HIGH tissue heterogeneity and the lowest for the VERY LOW heterogeneity. The 24 h IC50 strength exhibited the greatest differential between the various levels of heterogeneity, with 7 μM for HIGH and 5 μM for VERY LOW, in contrast to the 96 h IC50, which evinced 1 μM for HIGH and 0.75 μM for VERY LOW.
Figure 6.
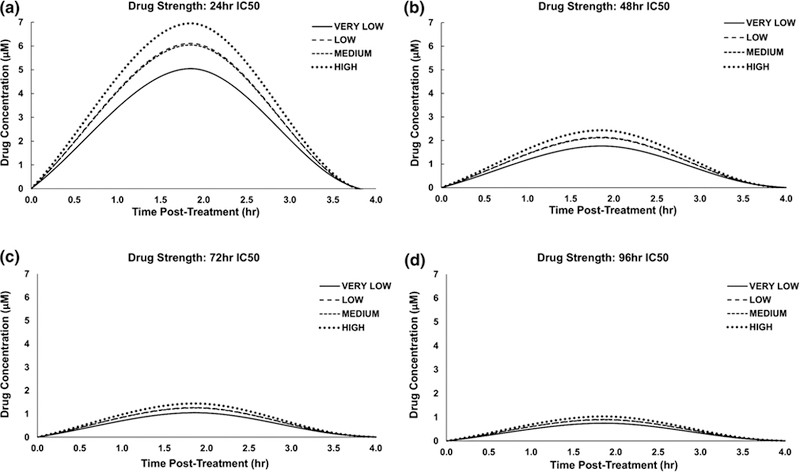
Drug release from nanoparticles within the first 4 h after injection for each level of tissue heterogeneity at the various IC50-based drug strength values. As the half-life for cisplatin is 30 min, values beyond 4 h are negligible.
The area-under-the-curve (AUC) for the nanoparticles within tumor tissue is shown in Figure 7. For all IC50 conditions, the lowest values were obtained for the HIGH level of heterogeneity, while the highest values were obtained for the LOW level. At this level, the 72 h IC50 predominated overall at 1750 %initial.h. In contrast, the highest AUC for the other levels were achieved for the 96 h IC50, with 1530 for VERY LOW, 1410 for MEDIUM and 1380 %initial.h for HIGH conditions, respectively. These inhomogeneous outcomes reflect the variations in concentration as shown in Figure 5. In contrast, the intratumoral AUC for the drug released from them had a more consistent pattern across the levels of heterogeneity and drug strength (Figure 7B), following the levels of drug release (Figure 6). The 24 h IC50 evinced the highest values overall, increasing from 9.6 μM.h to 13.1 μM.h for the VERY LOW and HIGH levels, respectively. The values for the other drug strengths followed a similar increasing trend but with lower values, ranging for the VERY LOW to HIGH levels from 3.5 to 4.7, 2.1 to 2.8, and 1.5 to 2.0 μM.h for the 48, 72, and 96 h IC50 strengths, respectively. Thus, the 96 h IC50 had the lowest drug AUC values.
Figure 7.

AUC values for intratumoral accumulation of (A) nanoparticles and (B) drug. Drug strength increases with shorter IC50 times.
Figure 8 shows the minimum tumor radius achieved for each level of tissue heterogeneity, as a function of the intratumoral drug AUC. In all cases, there was a nearly linear relationship between tumor radius and AUC, with radius decreasing as the AUC values increased. The largest radius reduction was achieved by the VERY LOW case with the 24 h IC50 drug strength, yielding 52% shrinkage from the initial tumor radius, while the smallest decrease at this drug strength was 41% for the MEDIUM case. On the other hand, the 96 h IC50 drug strength was equally ineffective across all levels of heterogeneity, achieving at best a 9% reduction in tumor radius for the HIGH case. This information is summarized in Figure 9, highlighting the decrease in tumor radius for the different drug strengths across the four levels of heterogeneity. While higher drug strengths, as represented by lower IC50 values, yielded higher response, the magnitude of this response was dependent on the level of tissue heterogeneity.
Figure 8.
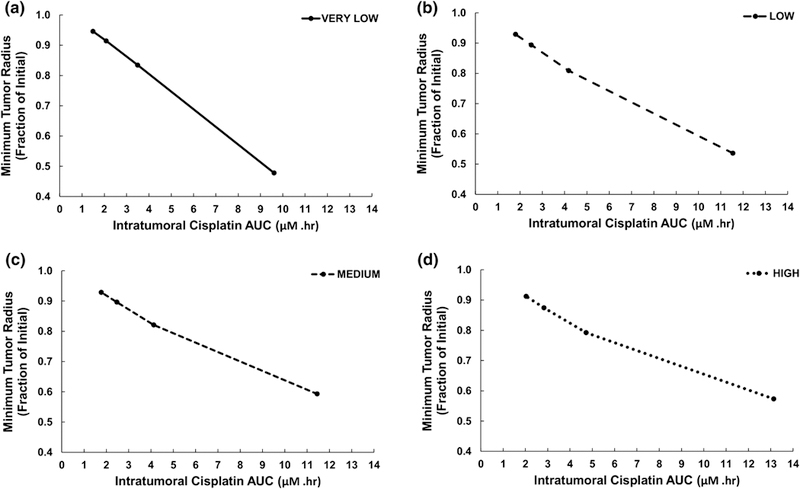
Minimum tumor radius for each level of tissue heterogeneity as a function of the intratumoral drug AUC. The points along each curve represent, from left to right, 96, 72, 48, and 24 IC50-based drug strength values (AUC increases with shorter IC50 times).
Figure 9.
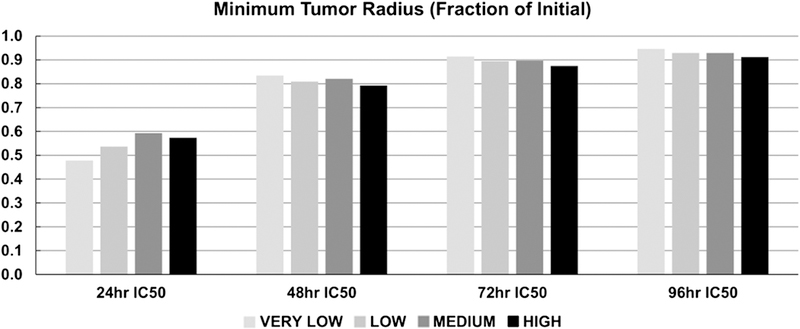
Minimum tumor radius achieved during therapy as a function of drug strength and tissue heterogeneity (strength increases with shorter IC50 times).
Figure 10 shows the minimum tumor radius as a function of drug strength dependent on the size of the tumor tissue viable (proliferating and hypoxic) fraction and intratumoral vascular density, both calculated at the start of the treatment. As expected, as the drug strength increases (represented by lowering IC50 values), the tumor regression is correspondingly higher. For the highest strength (24 h IC50), this regression was maximized by higher values of the viable tumor tissue fraction (Figure 10A) and lower values of the intratumoral vascular density (Figure 10B), together representing lower tumor heterogeneity. For the other drug strengths, the regression was less dependent on viable fraction and vascular density.
Figure 10.

Minimum tumor radius achieved during treatment as a function of drug strength dependent on (A) size of tumor tissue viable (proliferating and hypoxic) fraction and (B) intratumoral vascular fraction (vascular surface area divided by tumor area), both calculated at the start of the treatment. The tumor vasculature-induced tissue heterogeneity increases from VERY LOW (leftmost point) to HIGH (rightmost point), while the drug strength increases with shorter IC50 times.
DISCUSSION
This study builds upon previous experimental 13, 14 and modeling work 5 to evaluate the effect of vascular density-driven tissue heterogeneity on NSCLC tumor response to cisplatin delivered via 3-layered gold nanoparticles. As such, this work represents a first step towards the development of a principled approach to predict nanotherapy efficacy using patient-tumor-specific characteristics, such as proliferative index and vascular density. Tumors with different intra-tumoral vascular densities (Figure 1) were first generated in silico by varying the oxygen thresholds for hypoxia and necrosis to yield different proportions of proliferating, hypoxic and necrotic tissue (Figure 2), thus defining various levels of tissue heterogeneity. Next, using experimentally-obtained data with 3-layered gold nanoparticles loaded with cisplatin 13, 14, the magnitude of the drug effect in silico was calibrated for inhibitory drug concentrations to achieve 50% tumor tissue remission over 24, 48, 72, and 96 h (Figure 3). The simulated vascularized tumors were then treated with these drug concentrations. Figure 4 illustrates the nanoparticle and drug concentrations at the time immediately following bolus injection in Figure 5, showing representative images of these concentrations within the tumor tissue with various levels of heterogeneity. In Figures 5 through 10, the information is summed over the whole tumor space for each case of drug strength and tumor heterogeneity. The resulting inhomogeneous intratumoral nanoparticle and drug AUC values (Figure 7) yield correspondingly heterogeneous tumor regressions (Figures 8, Figure 9). This system was then used to determine the expected tumor size based on the fraction of viable tumor tissue and intratumoral vascular density (Figure 10).
The results show that tumor vascular density coupled with the drug strength non-trivially influences the nanoparticle uptake and washout (Figure 5), and the associated tissue response (Figure 8). The regions of the system with high vascular density also have locally high nanoparticle and drug concentrations. Although regression generally correlated with drug strength, the level of vasculature-driven tissue heterogeneity additionally modulates this regression. The drug strength affects the proportion of proliferating, hypoxic, and necrotic tissue fractions, which in turn dynamically affect and are affected by the vascular density. The drug strength was varied in the model through the “drug effect” term, which is related to the pharmacodynamic model that drives the tumor growth. The simulations help to quantify the nonlinear relationship between drug strength and response, showing that the response becomes more insensitive to variation in the drug strength as this strength decreases or the tissue heterogeneity increases (Figure 9). Higher drug strengths may be able to achieve a stronger tumor regression but only if the intra-tumoral vascular density is below a certain threshold (Figure 10B). In contrast, drug strengths of lower magnitude may yield similar responses regardless of vascular density. Since drug strength is a key clinical parameter underlying both response and systemic toxicity, the overall results support the notion that drug strength remains a critical modeling parameter for predictive evaluation. This is consistent with recent modeling work that combined an optimization approach to determine optimal nanoparticle sizes for maximum tumor regression 3.
This modeling platform, while supporting the intuitive outcome that tumor heterogeneity and drug strength influence the tumor response, provides a means to quantify the understanding of these effects, e.g., to help define nanoparticle formulation and delivery methods. For instance, if tumor heterogeneity could be measured in terms of vascular density, drug efficacy in cases of higher drug strength is predicted to be highest against tumors with the lowest levels of heterogeneity (Figure 8 and Figure 9). In this case, the viable tissue fraction remains the same as at the start of treatment while the tumor shrinks, since most of the tumor is proliferating (Figure 2B) and responsive to the drug. When using weaker drug strengths, in contrast, drug efficacy is predicted highest against tumors with high vascular heterogeneity. In this case, a smaller viable fraction lessens the tissue responsiveness. Future work examining the balance between tumor vascular heterogeneity and nanotherapy efficacy is expected to further help elucidate the underlying mechanisms in order to maximize the tumor response for specific drug strengths and vehicle formulations.
This study establishes a more systematic methodology to assess the effect of tumor tissue vascular density on the response to nanotherapy. With specific tumor- and nanotherapy-parameter values, the system could be expanded to evaluate other types of nanoparticles and drugs. In particular for non-small cell lung cancer (NSCLC), parameters such as vascular density could be measured via imaging or histological analysis 31. Vascular permeability and blood volume could be quantified by positron emission tomography 4. Additionally, there exist methods for detecting tumor hypoxia, including the detection of hypoxia-induced proteins 2, 48. The concept of manipulating the vascular density to achieve improved response (e.g., “vascular normalization” 23), as has been tried for NSCLC with small molecule tyrosine kinase inhibitors or monoclonal antibodies that target VEGF 21, may find further utility if coupled with consideration of the chemotherapeutic drug strength. Clinically, angiogenesis inhibitors have been shown to improve overall survival when combined with standard first line and second line therapy 21. In cases where tumor vascular density were predicted by the model to be inadequate for a desired level of response, manipulation of angiogenesis might be explored as a means to change this density to augment the nanotherapy efficacy.
The interaction between vasculature, cells, nanoparticles, and drug molecules is a complex kinetic process in need of further consideration by computational modeling and simulation studies. Recently, a vascularized tumor model system evaluated the drug kinetics of combination chemotherapy among various cellular compartments 7. Future studies could combine drug kinetics with a nanoparticle delivery model. The model used herein simulates cell death as an instantaneous process. However, cell cycle dependent drugs such as cisplatin rely on processes that may take several hours before cytotoxic effects are realized 41. Thus, accounting for the delay in the drug cytotoxic action may yield more accurate results. Additionally, there are several well characterized drug resistance mechanisms, such as decreased intracellular transport, enzymatic deactivation, and alteration in proteins involved in apoptotic pathways 42.These mechanisms could be integrated to create a more comprehensive pharmacodynamics model, with the ultimate goal to predictively determine optimal nanotherapy customized to patient-specific tumor vasculature conditions.
ACKNOWLEDGEMENTS
HBF acknowledges partial support by the National Institutes of Health/National Cancer Institute Grant R15CA203605.
Footnotes
CONFLICE OF INTERESTS STATEMENT
The authors declare no known conflicts of interest.
REFERENCES
- 1.Bertrand N, Wu J, Xu X, Kamaly N and Farokhzad OC. Cancer nanotechnology: the impact of passive and active targeting in the era of modern cancer biology. Adv Drug Deliv Rev 66: 2–25, 2014. [DOI] [PMC free article] [PubMed] [Google Scholar]
- 2.Brahimi-Horn MC and Pouyssegur J. The hypoxia-inducible factor and tumor progression along the angiogenic pathway. Int Rev Cytol 242: 157–213, 2005. [DOI] [PubMed] [Google Scholar]
- 3.Chamseddine IM, Frieboes HB and Kokkolaras M. Design Optimization of Tumor Vasculature-Bound Nanoparticles. Scientifc Reports (in press): 2018. [DOI] [PMC free article] [PubMed]
- 4.Chen H, Tong X, Lang L, Jacobson O, Y. BC , Yang X, Bai R, Kiesewetter DO, Ma Y, Wu H, Niu G and Chen X. Quantification of Tumor Vascular Permeability and Blood Volume by Positron Emission Tomography. Theranostics 7: 2363–2376, 2017. [DOI] [PMC free article] [PubMed] [Google Scholar]
- 5.Curtis LT, England CG , Wu M, Lowengrub J and Frieboes HB. An interdisciplinary computational/experimental approach to evaluate drug-loaded gold nanoparticle tumor cytotoxicity. Nanomedicine (Lond) 11: 197–216, 2016. [DOI] [PMC free article] [PubMed] [Google Scholar]
- 6.Curtis LT, Rychahou P, Bae Y and Frieboes HB. A Computational/Experimental Assessment of Antitumor Activity of Polymer Nanoassemblies for pH-Controlled Drug Delivery to Primary and Metastatic Tumors. Pharm Res 2016. [DOI] [PubMed]
- 7.Curtis LT, van Berkel VH and Frieboes HB. Pharmacokinetic/pharmacodynamic modeling of combination-chemotherapy for lung cancer. Journal of Theoretical Biology 448: 38–52, 2018. [DOI] [PMC free article] [PubMed] [Google Scholar]
- 8.Curtis LT, Wu M, Lowengrub J, Decuzzi P and Frieboes HB. Computational Modeling of Tumor Response to Drug Release from Vasculature-Bound Nanoparticles. PLoS One 10: e0144888, 2015. [DOI] [PMC free article] [PubMed] [Google Scholar]
- 9.Decuzzi P, Pasqualini R, Arap W and Ferrari M. Intravascular delivery of particulate systems: does geometry really matter? Pharm Res 26: 235–243, 2009. [DOI] [PubMed] [Google Scholar]
- 10.England CG, Gobin AM and Frieboes HB. Evaluation of uptake and distribution of gold nanoparticles in solid tumors. Eur Phys J Plus 130: 2015. [DOI] [PMC free article] [PubMed] [Google Scholar]
- 11.England CG, Huang JS, James KT, Zhang GD, Gobin AM and Frieboes HB. Detection of Phosphatidylcholine-Coated Gold Nanoparticles in Orthotopic Pancreatic Adenocarcinoma using Hyperspectral Imaging. PLoS One 10: 2015. [DOI] [PMC free article] [PubMed] [Google Scholar]
- 12.England CG, Huang J,S James KT, Zhang X, Gobin AM, Frieboes HB Detection of Phosphatidylcholine-Coated Gold Nanoparticles in Orthotopic Pancreatic Adenocarcinoma using Hyperspectral Imaging. PLoS One 10: e0129172, 2015. [DOI] [PMC free article] [PubMed] [Google Scholar]
- 13.England CG, Miller MC, Kuttan A, Trent JO, Frieboes HB Release Kinetics of Paclitaxel and Cisplatin from Two and Three Layered Gold Nanoparticles. Eur J Pharm Biopharm 92: 120–129, 2015. [DOI] [PMC free article] [PubMed] [Google Scholar]
- 14.England CG, Priest T, Zhang G, Sun X, Patel DN, McNally LR, van Berkel V, Gobin AM and Frieboes HB. Enhanced penetration into 3D cell culture using two and three layered gold nanoparticles. Int J Nanomedicine 8: 3603–3617, 2013. [DOI] [PMC free article] [PubMed] [Google Scholar]
- 15.Frens G Controlled Nucleation for the Regulation of the Particle Size in Monodisperse Gold Solutions. Nature Physical Sciences 241: 20–22, 1973. [Google Scholar]
- 16.Frieboes HB, Sinek JP, Nalcioglu O, Fruehauf JP and Cristini V. Nanotechnology in Cancer Drug Therapy: A Biocomputational Approach. In: BioMEMS and Biomedical Nanotechnology, edited by Ferrari M, Lee AP and Lee LJ. New York: Springer-Verlag, 2006, pp. 435–460. [Google Scholar]
- 17.Frieboes HB, Wu M, Lowengrub J, Decuzzi P and Cristini V. A computational model for predicting nanoparticle accumulation in tumor vasculature. PLoS One 8: e56876, 2013. [DOI] [PMC free article] [PubMed] [Google Scholar]
- 18.Gao Y, Li M, Chen B, Shen Z, Guo P, Wientjes MG and Au JL. Predictive models of diffusive nanoparticle transport in 3-dimensional tumor cell spheroids. AAPS J 15: 816–831, 2013. [DOI] [PMC free article] [PubMed] [Google Scholar]
- 19.Godin B, Driessen WH, Proneth B, Lee SY, Srinivasan S, Rumbaut R, Arap W, Pasqualini R, Ferrari M and Decuzzi P. An integrated approach for the rational design of nanovectors for biomedical imaging and therapy. Adv Genet 69: 31–64, 2010. [DOI] [PMC free article] [PubMed] [Google Scholar]
- 20.Hait WN and Hambley TW. Targeted cancer therapeutics. Cancer Res 69: 1263–1267, 2009. [DOI] [PubMed] [Google Scholar]
- 21.Hall RD, Le TM, Haggstrom DE and Gentzier RD. Angiogenesis inhibition as a therapeutic strategy in non-small cell lung cancer (NSCLC). Translational Lung Cancer Research 4: 515–523, 2015. [DOI] [PMC free article] [PubMed] [Google Scholar]
- 22.Izuishi K, Kato K, Ogura T, Kinoshita T and Esumi H. Remarkable tolerance of tumor cells to nutrient deprivation: possible new biochemical target for cancer therapy. Cancer Res 60: 6201–6207, 2000. [PubMed] [Google Scholar]
- 23.Jain RK Normalizing tumor vasculature with anti-angiogenic therapy: a new paradigm for combination therapy. Nature Medicine 7: 987–989, 2001. [DOI] [PubMed] [Google Scholar]
- 24.Kaddi CD, Phan JH and Wang MD. Computational nanomedicine: modeling of nanoparticle-mediated hyperthermal cancer therapy. Nanomedicine (Lond) 8: 1323–1333, 2013. [DOI] [PMC free article] [PubMed] [Google Scholar]
- 25.Koziara JM, Whisman TR, Tseng MT and Mumper RJ. In-vivo efficacy of novel paclitaxel nanoparticles in paclitaxel-resistant human colorectal tumors. J Control Release 112: 312–319, 2006. [DOI] [PubMed] [Google Scholar]
- 26.Leighl NB Treatment paradigms for patients with metastatic non-small-cell lung cancer: first-, second-, and third-line. Curr Oncol 19: S52–58, 2012. [DOI] [PMC free article] [PubMed] [Google Scholar]
- 27.Li M, Al-Jamal KT, Kostarelos K and Reineke J. Physiologically based pharmacokinetic modeling of nanoparticles. Acs Nano 4: 6303–6317, 2010. [DOI] [PubMed] [Google Scholar]
- 28.Li M, Czyszczon EA and Reineke JJ. Delineating intracellular pharmacokinetics of paclitaxel delivered by PLGA nanoparticles. Drug Deliv Transl Res 3: 551–561, 2013. [DOI] [PubMed] [Google Scholar]
- 29.Li M, Panagi Z, Avgoustakis K and Reineke J. Physiologically based pharmacokinetic modeling of PLGA nanoparticles with varied mPEG content. Int J Nanomedicine 7: 1345–1356, 2012. [DOI] [PMC free article] [PubMed] [Google Scholar]
- 30.Li M and Reineke J. Mathematical modelling of nanoparticle biodistribution: extrapolation among intravenous, oral and pulmonary administration routes. Int J Nano Biomaterials 3: 222–238, 2011. [Google Scholar]
- 31.Ma E, Ren A, Baoxiang G, Yang M, Zhao C, Wang W and Li K. ROI for outlining an entire tumor is a reliable approach for quantification of lung cancer tumor vascular parameters using CT perfusion. Oncotargets and Therapy 9: 2377–2384, 2016. [DOI] [PMC free article] [PubMed] [Google Scholar]
- 32.Macklin P and Lowengrub J. Nonlinear simulation of the effect of microenvironment on tumor growth. Journal of Theoretical Biology 245: 677–704, 2007. [DOI] [PubMed] [Google Scholar]
- 33.Macklin P and Lowengrub JS. A New Ghost Cell/Level Set Method for Moving Boundary Problems: Application to Tumor Growth. J Sci Comput 35: 266–299, 2008. [DOI] [PMC free article] [PubMed] [Google Scholar]
- 34.Macklin P, McDougall S, Anderson AR, Chaplain MA, Cristini V and Lowengrub J. Multiscale modelling and nonlinear simulation of vascular tumour growth. J Math Biol 58: 765–798, 2009. [DOI] [PMC free article] [PubMed] [Google Scholar]
- 35.McDougall SR, Anderson AR and Chaplain MA. Mathematical modelling of dynamic adaptive tumour-induced angiogenesis: clinical implications and therapeutic targeting strategies. Journal of Theoretical Biology 241: 564–589, 2006. [DOI] [PubMed] [Google Scholar]
- 36.Miele E, Spinelli GP, Miele E, Di Fabrizio E, Ferretti E, Tomao S and Gulino A. Nanoparticle-based delivery of small interfering RNA: challenges for cancer therapy. Int J Nanomedicine 7: 3637–3657, 2012. [DOI] [PMC free article] [PubMed] [Google Scholar]
- 37.Minchinton AI and Tannock IF. Drug penetration in solid tumours. Nat Rev Cancer 6: 583–592, 2006. [DOI] [PubMed] [Google Scholar]
- 38.Nugent LJ and Jain RK. Extravascular diffusion in normal and neoplastic tissues. Cancer Res 44: 238–244, 1984. [PubMed] [Google Scholar]
- 39.Primeau AJ, Rendon A, Hedley D, Lilge L and Tannock IF. The Distribution of the Anticancer Drug Doxorubicin in Relation to Blood Vessels in Solid Tumors. Clinical Cancer Research 11: 8782–8788, 2005. [DOI] [PubMed] [Google Scholar]
- 40.Reichel D, Curtis LT, Ehlman E, Mark Evers B, Rychahou P, Frieboes HB and Bae Y. Development of Halofluorochromic Polymer Nanoassemblies for the Potential Detection of Liver Metastatic Colorectal Cancer Tumors Using Experimental and Computational Approaches. Pharm Res 34: 2385–2402, 2017. [DOI] [PMC free article] [PubMed] [Google Scholar]
- 41.Siddik ZH Cisplatin: mode of cytotoxic action and molecular basis of resistance. Oncogene 22: 7265–7279, 2003. [DOI] [PubMed] [Google Scholar]
- 42.Stewart DJ Mechanisms of resistance to cisplatin and carboplatin. Crit Rev Oncol Hematol 63: 12–31, 2007. [DOI] [PubMed] [Google Scholar]
- 43.van de Ven AL, Abdollahi B, Martinez CJ, Burey LA, Landis MD, Chang JC, Ferrari M and Frieboes HB. Modeling of nanotherapeutics delivery based on tumor perfusion. New Journal of Physics 15: 2013. [DOI] [PMC free article] [PubMed] [Google Scholar]
- 44.van de Ven AL, Wu M, Lowengrub J, McDougall SR, Chaplain MA, Cristini V, Ferrari M and Frieboes HB. Integrated intravital microscopy and mathematical modeling to optimize nanotherapeutics delivery to tumors. AIP Adv 2: 11208, 2012. [DOI] [PMC free article] [PubMed] [Google Scholar]
- 45.Warren KE Novel therapeutic delivery approaches in development for pediatric gliomas. CNS Oncol 2: 427–435, 2013. [DOI] [PMC free article] [PubMed] [Google Scholar]
- 46.Wu M, Frieboes HB, Chaplain MAJ, McDougall SR, Cristini V and Lowengrub J. The effect of interstitial pressure on therapeutic agent transport: Coupling with the tumor blood and lymphatic vascular systems. Journal of Theoretical Biology 355: 194–207, 2014. [DOI] [PMC free article] [PubMed] [Google Scholar]
- 47.Wu M, Frieboes HB, McDougall SR, Chaplain MA, Cristini V and Lowengrub J. The effect of interstitial pressure on tumor growth: Coupling with the blood and lymphatic vascular systems. Journal of Theoretical Biology 320: 131–151, 2013. [DOI] [PMC free article] [PubMed] [Google Scholar]
- 48.Zhong H, De Marzo AM, Laughner E, Lim M, Hilton DA, Zagzag D, Buechler P, Isaacs WB, Semenza GL and Simons JW. Overexpression of hypoxia-inducible factor 1alpha in common human cancers and their metastases. Cancer Res 59: 5830–5835, 1999. [PubMed] [Google Scholar]


