Abstract
Ewing sarcoma is an aggressive paediatric cancer of the bone and soft tissue. It results from a chromosomal translocation, predominantly t(11;22)(q24:q12), that fuses the N-terminal transactivation domain of the constitutively expressed EWSR1 protein with the C-terminal DNA binding domain of the rarely expressed FLI1 protein1. Ewing sarcoma is highly sensitive to genotoxic agents such as etoposide, but the underlying molecular basis of this sensitivity is unclear. Here we show that Ewing sarcoma cells display alterations in regulation of damage-induced transcription, accumulation of R-loops and increased replication stress. In addition, homologous recombination is impaired in Ewing sarcoma owing to an enriched interaction between BRCA1 and the elongating transcription machinery. Finally, we uncover a role for EWSR1 in the transcriptional response to damage, suppressing R-loops and promoting homologous recombination. Our findings improve the current understanding of EWSR1 function, elucidate the mechanistic basis of the sensitivity of Ewing sarcoma to chemotherapy (including PARP1 inhibitors) and highlight a class of BRCA-deficient-like tumours.
EWSR1 is a RNA-binding protein that affects RNA metabolism, presumably through its regulation of RNA polymerase II (RNAPII) and coupling with the splicing machinery2. There is also evidence that EWSR1 is involved in genome stability3. Despite extensive research on the transcription targets of the fusion of EWSR1 and FLI1 (EWS–FLI1), factors that mediate the chemosensitivity of Ewing sarcoma or the effect of EWSR1 have not been well characterized. Compared to control cell lines (Extended Data Fig. 1a), Ewing sarcoma cell lines were acutely sensitive to most forms of damage, including etoposide (topoisomerase II inhibitor) (Fig. 1a). Notably, EWS–FLI1 conferred this chemosensitization (Fig. 1b), beyond the decreased viability caused by knockdown of the oncogene (Extended Data Fig. 1b). Conversely, EWS–FLI1 expression increased chemosensitivity in U2OS osteosarcoma cells (Extended Data Fig. 1c). As independent validation of this finding, the half maximal inhibitory concentration (IC50) of drugs that induced transcription and replication blocks was nearly fivefold lower in EWS–FLI1-associated cancers than others in a pan-cancer dataset from the Genomics of Drug Sensitivity in Cancer database4 (Extended Data Fig. 1d).
Figure 1 |. Ewing sarcoma dysregulates transcription in response to damage.
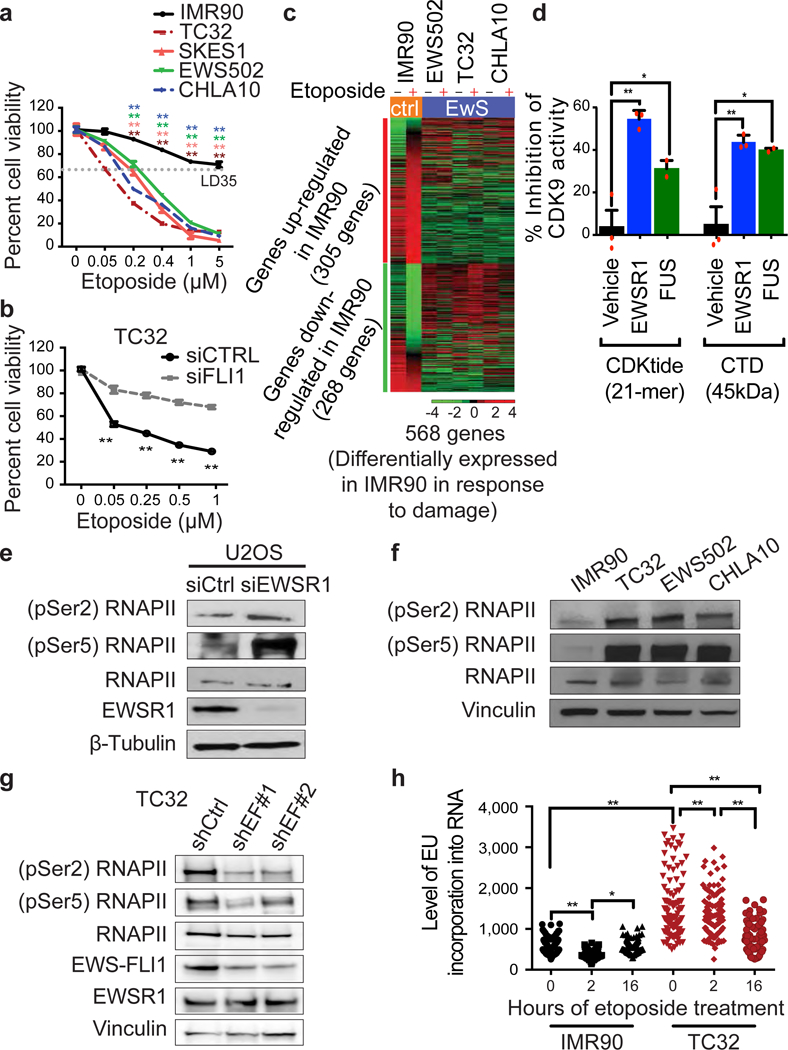
a, Cell viability following etoposide treatment. Etoposide dose causing 35% lethality (LD35, dotted grey line) was used for further experiments. Mean ± s.d., n = 4 technical replicates, one-way ANOVA. b, Etoposide-induced TC32 cytotoxicity after EWS–FLI1 knockdown (siFLI1). n = 4 transfection replicates, two-tailed t-tests. c, Heatmap of damage-induced differential gene expression. d, CDK9 kinase activity inhibition by recombinant EWSR1 and FUS proteins on CDKtide or CTD substrates. n = 3 technical replicates, one-way ANOVA. e–g, Levels of phosphorylated Ser2/Ser5 RNAPII in U2OS cells with EWSR1 knockdown (e), IMR90 cells versus TC32 cells (f), and TC32 cells with EWS–FLI1 knockdown (g). h, Transcriptional activity after etoposide treatment. Centre at median, n = 100 cells, two-way ANOVA. Mean ± s.e.m., *P < 0.05, **P < 0.005.
Aberrant regulation of transcription is an important source of endogenous DNA damage5. To identify pathways that contribute to the chemosensitivity of Ewing sarcoma, we examined gene expression over time after exposure to etoposide. Gene set enrichment analysis contrasting gene expression in Ewing sarcoma and control cells under basal conditions extracted the expected Ewing sarcoma profile along with defects in replication, transcription and repair pathways (Extended Data Fig. 1e–g). We also identified a subset of genes that were significantly altered in response to damage in IMR90 human lung cells but not Ewing sarcoma (Fig. 1c, Supplementary Table 1); functional annotation analysis revealed significant enrichment for transcription regulation and RNA metabolism genes (Extended Data Table 1a, b). Notably, comparison with genome-wide RNA inhibition (RNAi) survival screens in Drosophila Kc167 cells exposed to various damaging agents consistently highlighted RNA metabolism (Extended Data Fig. 1h, Supplementary Table 2), implicating it as a conserved and critical damage survival component.
EWS–FLI1 and EWSR1 are known to interact with each other6,7 and with sub-components of the transcriptional machinery8,9. It has been suggested that EWS–FLI1 acts in a dominant-negative manner to wild-type EWSR1 in splicing7,9. However, the role of these two proteins in directly controlling RNAPII activity has not been actively studied. The largest subunit of RNAPII is hyperphosphorylated at Ser2 and Ser5 of the heptapeptide repeats in the C-terminal domain (CTD) during active transcription10; Ser5 phosphorylation (by CDK7/cyclin H) occurs early during initiation and Ser2 phosphorylation (by CDK9/cyclin T1) triggers elongation. FUS, an EWSR1 homologue, has been reported to regulate RNAPII Ser2 phosphorylation11. Therefore, the dysregulated transcriptional response of Ewing sarcoma could be due to EWS–FLI1 interfering with wild-type EWSR1 in regulating transcription. In an in vitro kinase assay using purified recombinant proteins, EWSR1 inhibited phosphorylation of the RNAPII CTD by CDK9 (Fig. 1d, Extended Data Fig. 2a) whereas EWS–FLI1 did not (Extended Data Fig. 2b). EWSR1 depletion in U2OS cells increased RNAPII phosphorylation, confirming the results of the kinase assay (Fig. 1e). Immunoblotting of Ewing sarcoma cell lysates indicated high levels of phosphor-Ser2/Ser5 RNAPII compared to IMR90 cells (Fig. 1f), while depletion of EWS–FLI1 in TC32 cells significantly decreased RNAPII phosphorylation (Fig. 1g). Notably, wild-type EWSR1 levels were not affected by EWS–FLI1 knockdown. These data suggest that EWS–FLI1 increased basal levels of transcription, either directly, or indirectly by interfering with EWSR1 activity. Accordingly, EWSR1-depleted cells and Ewing sarcoma cell lines and tumours were more sensitive to blockade of transcription by camptothecin (a topoisomerase I inhibitor) (Extended Data Fig. 2c, d).
DNA damage induces global suppression of transcription (involving BRCA112) followed by gradual recovery. We therefore evaluated the transcription response and recovery following etoposide exposure using incorporation of ethynyl uridine (EU) into RNA (Fig. 1h). Unlike IMR90 cells, which displayed a characteristic decrease in EU incorporation two hours post-damage followed by recovery, TC32 Ewing sarcoma cells showed a significantly higher basal transcription level, similar to that seen in EWSR1-depleted cells (Extended Data Fig. 2e), and a delayed decrease in transcription.
Alterations in regulation of transcription could result in the accumulation of R-loops (three-stranded nucleic acid structures comprising a DNA–RNA hybrid and non-template single-stranded DNA)13. Several pieces of evidence advocate a potential role for EWSR1 and EWS-FLI1 in regulating R-loop accumulation: both proteins regulate RNAPII elongation9 and interact with splicing machinery9,14,15, each of which is conducive to R-loop formation16. Using the RNA–DNA hybrid-specific S9.6 antibody to probe genomic DNA, we discovered that Ewing sarcoma cell lines displayed nearly fourfold higher levels of R-loops compared to IMR90 cells (Fig. 2a). RNaseH treatment (Fig. 2a) or RNaseH1 expression (Extended Data Fig. 3a) substantially decreased the R-loop signal. R-loop accumulation was induced by EWSR1 depletion (Fig. 2b) or by EWS–FLI1, as shown by expression in U2OS cells (Fig. 2b) or knockdown in TC32 cells (Extended Data Fig. 3b). A DNA-binding mutant EWS–FLI1 (Extended Data Fig. 3c) also induced accrual of R-loops, suggesting that the N-terminal protein interaction domain that is common to EWSR1 and EWS–FLI1 is important in promoting R-loop accumulation. Notably, Ewing sarcoma cells did not display a damage-induced reduction in R-loops to the same extent as IMR90 cells (Extended Data Fig. 3d, e), consistent with the EU-incorporation data (Fig. 1h). These results were corroborated by immunofluorescence analysis of nucleoplasmic R-loops (Fig. 2c, Extended Data Fig. 3f).
Figure 2 |. R-loop accumulation in Ewing sarcoma.
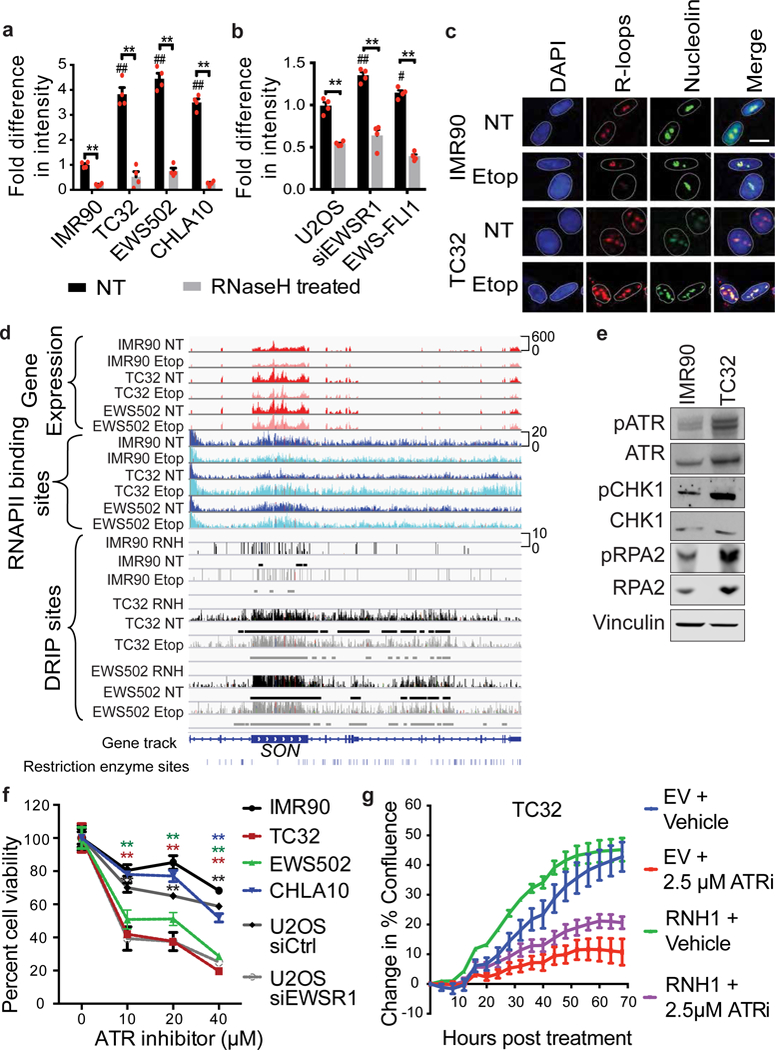
a, b, Fold-difference in genomic R-loops in IMR90 versus Ewing sarcoma cells (a) and U2OS cells with indicated transfections (b); n = 4 technical replicates. c, Representative immunofluorescence images of nuclei (DAPI), R-loops (S9.6) and nucleoli (nucleolin). Scale bar, 25 μm. d, Thirty-five-kilobase region surrounding the SON gene containing RNA-seq (red), RNAPII ChIP–seq (blue), DRIP–seq (black) and RNaseH-treated (RNH) tracks. Etop, etoposide-treated. Track height represents read counts. e, Immunoblots of indicated replication stress proteins. f, Cell viability response to ATR inhibitor; n = 4 technical replicates. g, Proliferation rate of TC32 cells overexpressing RNaseH1 (RNH1) after ATR inhibition (ATRi). EV, empty vector; n = 3 transfection replicates. Mean ± s.e.m., one-way ANOVA compared to IMR90 control, two-tailed t-test within each cell line. #,*P < 0.05; ##,**P < 0.005, # shows significance compared to control (NT).
To further characterize the R-loops present in Ewing sarcoma, we conducted high-throughput sequencing and analysis of genomic DNA–RNA hybrids by immunoprecipitation (DRIP–seq)17 in Ewing sarcoma and control cell lines with or without damage. RNaseH-treated DNA served as a negative control. We found extensive R-loops throughout the genome in EWSR1-depleted cells compared to control cells (by read coverage and depth), and this difference was greater in Ewing sarcoma cells (Fig. 2d, Extended Data Fig. 4a). Comparison of DRIP–seq and RNA sequencing (RNA-seq) data indicated a predominance of R-loops in regions containing highly expressed genes?](Extended Data Fig. 4b). We examined the co-occurrence of reported EWS–FLI1 binding sites18 with R-loops and found very strong enrichment (Extended Data Fig. 4c), especially at highly expressed genes (top 16%). We also observed an increased propensity for RNAPII binding (by RNAPII chromatin immunoprecipitation and sequencing, ChIP–seq) in the same regions as R-loops compared to surrounding genomic regions (Extended Data Fig. 4c), which was confirmed at well-established R-loop sites (Extended Data Fig. 4d).
Unresolved R-loops are deleterious to the cell, as they potentially block replication machinery progression and result in stalled or collapsed replication forks13,16. Analysis of well-known markers of replication stress indicated elevated basal levels of activated (phosphorylated) ATR, CHK1 and RPA2 in Ewing sarcoma cells (Fig. 2e). Significant sensitivity to ATR inhibition was observed not only in Ewing sarcoma cells (as previously reported19), but also in EWSR1-depleted U2OS cells (Fig. 2f). RNaseH1 overexpression suppressed ATR pathway activation (Extended Data Fig. 5a) and increased the rate of cell proliferation (Fig. 2g), confirming that R-loops induced replication stress.
R-loop accumulation is generally associated with increased DNA damage and homologous recombination13. Ewing sarcoma cells exhibit high levels of DNA damage20 (measured by the P53-binding protein TP53BP1 foci; Fig. 3a, b) compared to IMR90 cells. However, there was an absence of ionizing radiation-induced RAD51 foci (Fig. 3a, c). Interestingly, basal levels of RAD51 foci were higher in Ewing sarcoma cells than in IMR90 cells (Fig. 3c), although this may reflect increased replication stress21. We used the direct-repeat GFP assay (DR-GFP; Extended Data Fig. 5b) integrated into U2OS cells to evaluate endonuclease-induced double strand break (DSB) repair by homologous recombination22. Expression of either EWS–FLI1 or EWS–ERG (the second most common Ewing sarcoma translocation23) significantly reduced homologous recombination capacity (Fig. 3d). As EWS–FLI1 binds EWSR1 through their shared N-terminal domain6, we investigated whether the suppression of homologous recombination was due to a loss of EWSR1 function. As suspected, either expression of the EWSR1 N-terminal domain alone (Fig. 3d) or expression of two independent small inhibitory RNAs (siRNAs) against EWSR1 (Fig. 3e) also reduced homologous recombination frequency.
Figure 3 |. Functional loss of EWSR1 impairs homologous recombination.
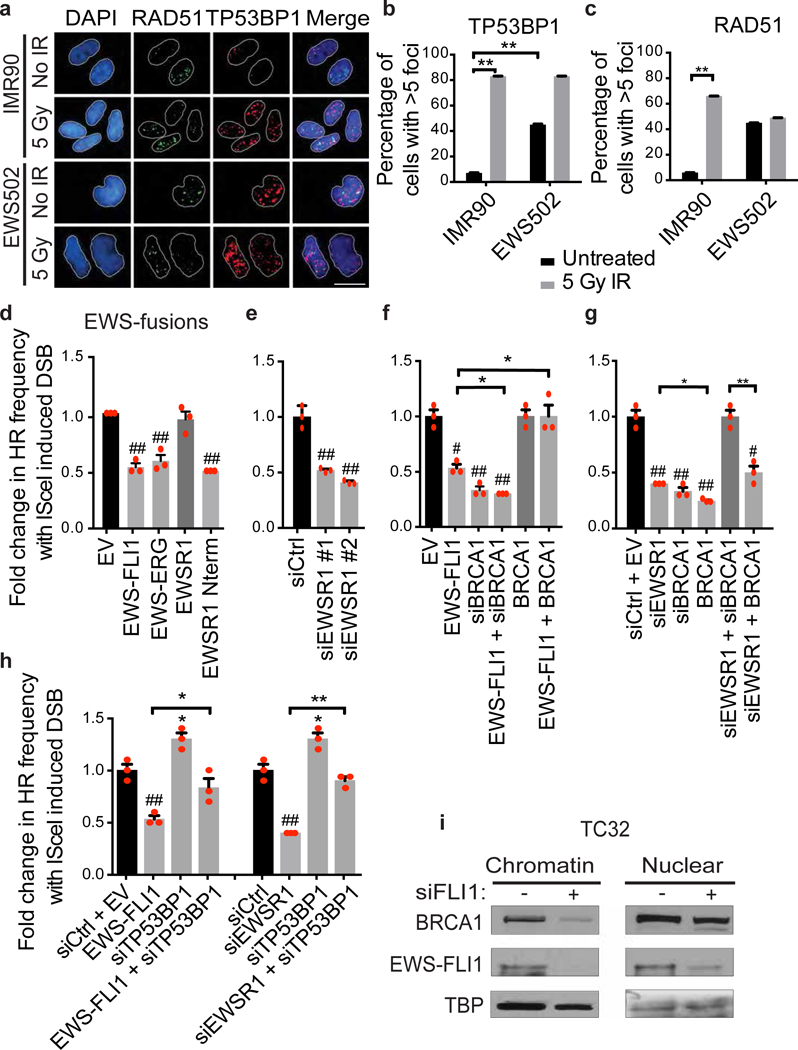
a, Representative immunofluorescence images of TP53BP1 and RAD51 foci. Scale bar, 25 μm. b, c, Number of cells with more than five TP53BP1 (b) or RAD51 (c) foci. n = 85 cells, two-tailed t-test. d–h, Homologous recombination (HR) frequency with indicated transfections (efficiency demonstrated in Extended Data Figs 5d, 6d). n = 3 transfection replicates, one-way ANOVA. i, Immunoblots for BRCA1 and EWS–FLI1 in subcellular fractions of TC32 cells with EWS–FLI1 knockdown. Mean ± s.e.m.; #,*P < 0.05; ##,**P < 0.005, # shows significance relative to control (black bar).
Given the similarity in phenotypes between Ewing sarcoma and BRCA1/2 mutant breast cancer (Extended Data Table 2), we investigated whether BRCA1 function was altered in Ewing sarcoma. It is noteworthy that our gene expression analysis, comparing Ewing sarcoma and control cells, identified significant enrichment for a BRCA1-mutated gene set (Extended Data Fig. 1g). Ewing sarcoma cells have robust BRCA1 expression (Extended Data Fig. 5c) with no known mutations. Overexpression of BRCA1 restored homologous recombination in the context of EWS–FLI1 expression (Fig. 3f), suggesting a functional impairment, but surprisingly did not do so when EWSR1 was depleted (Fig. 3g).
PARP1 inhibition is synthetic lethal with BRCA1 deficiency in replicating cells24,25 owing to the absence of homologous recombination. Thus, impaired BRCA1 function could provide a molecular basis for the high sensitivity of Ewing sarcoma to PARP1 inhibitors such as Olaparib20 (Extended Data Fig. 6a–c) and etoposide-induced DNA breaks. Mutation of TP53BP1 circumvents the need for BRCA1 in homologous recombination, partially restoring homologous recombination and conferring some resistance to chemotherapy26. Depletion of TP53BP1 restored homologous recombination in the presence of either EWSR1 knockdown or EWS–FLI1 expression (Fig. 3h), consistent with a functional deficiency of BRCA1. Knockdown of TP53BP1 also moderately increased resistance to etoposide in Ewing sarcoma cells (Extended Data Fig. 6e). Together, our data indicate that Ewing sarcoma phenocopies BRCA1-deficient tumours and suggests that secondary mutations in TP53BP1 are a potential chemoresistance mechanism.
BRCA1 has been shown to associate with the elongating transcription complex27 and with R-loops28. Sequestration of BRCA1 with transcription complexes could prevent its redistribution to exogenous damage and therefore explain its functional absence in Ewing sarcoma. While overall levels of BRCA1 protein were similar between Ewing sarcoma and control cells (Extended Data Fig. 6f), comparison of the subcellular fractionations of U2OS versus TC32 cells revealed redistribution of BRCA1. Chromatin-bound BRCA1 was particularly enriched in Ewing sarcoma (Fig. 3i), but was substantially reduced by EWS–FLI1 knockdown. EWSR1 depletion did not result in a similar sequestration of BRCA1 in the chromatin fraction, again highlighting the difference between EWSR1 loss and EWS–FLI1 expression with regard to BRCA1 function (Extended Data Fig. 6g).
BRCA1 preferentially associates with phospho-RNAPII in undamaged cells27. Considering the increased amount of phospho-RNAPII in Ewing sarcoma cells, we examined the interaction between endogenous phospho-RNAPII and BRCA1 by co-immunoprecipitation (Fig. 4a, Extended Data Fig. 7a) in nuclear lysates. An increased proportion of phospho-RNAPII was immunoprecipitated by BRCA1 in Ewing sarcoma, highlighting the redistribution of BRCA1 to transcription complexes. This interaction did not diminish following damage as expected27 and seen in control cell lines. We also confirmed the lack of interaction between BRCA1 and unphosphorylated RNAPII. Subsequent to release from the transcription machinery, the association of BRCA1 with the retinoblastoma binding protein 8 RBBP8 or CtIP increases to promote removal of TP53BP129 and DSB repair by homologous recombination. An increase in damage-induced interaction between BRCA1 and CtIP was observed in control but not Ewing sarcoma cells. Confirming the functional impairment of BRCA1 in DSB repair, we performed BRCA1 ChIP in U2OS cells after endonuclease-induced DSB at the DR-GFP locus and observed a loss of BRCA1 recruitment in cells transfected with EWS–FLI1 compared to vector-transfected controls (Fig. 4b).
Figure 4 |. BRCA1 is retained at transcriptional complexes in Ewing sarcoma.
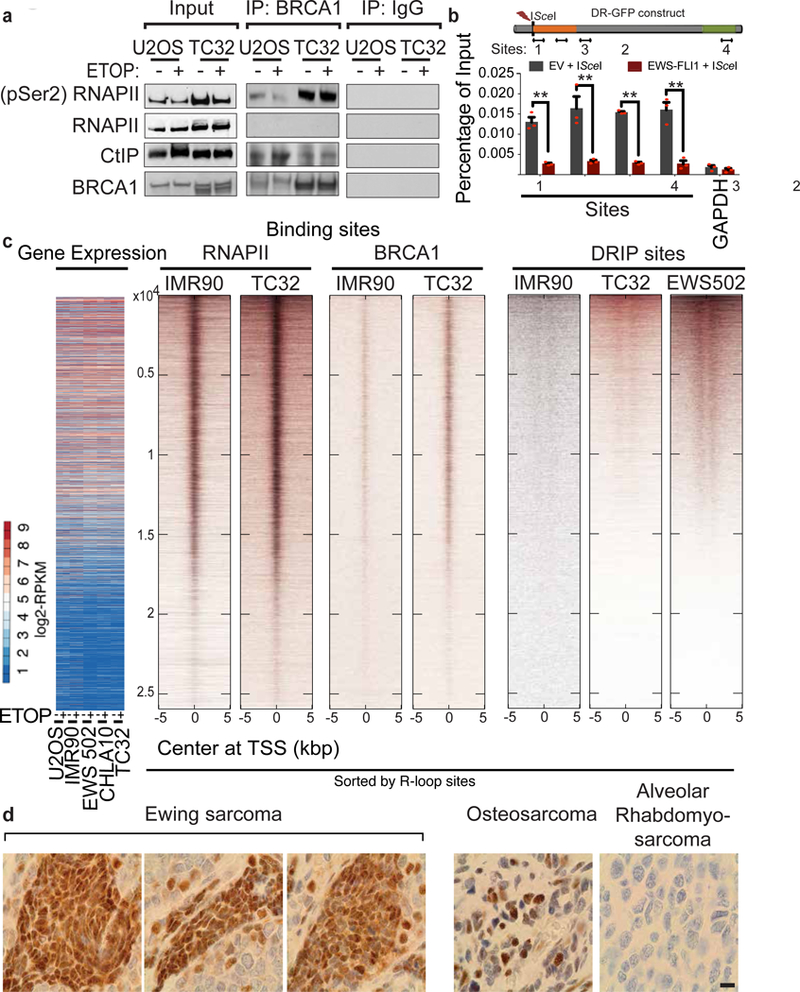
a, Immunoblots of indicated proteins after BRCA1 immunoprecipitation. b, Schematic of qPCR sites within DR-GFP locus relative to break site used to measure BRCA1 occupancy after EWS–FLI1 overexpression (graph below); GAPDH serves as negative control. Mean ± s.e.m., n = 3 technical replicates; **P < 0.005, two-tailed t-test. c, Whole-genome heatmaps representing correlation between gene expression, RNAPII, BRCA1 binding sites, and DRIP loci ordered by DRIPs, centred on transcription start site (TSS). d, Representative immunohistochemistry images showing R-loop staining across a sarcoma tissue microarray. Scale bar, 10 μm.
Finally, we performed an in-depth analysis of the association of BRCA1 with R-loops in control and Ewing sarcoma cell lines with and without exposure to damage (BRCA1 ChIP–seq, Fig. 4c, Extended Data Fig. 8a). BRCA1 binding (Extended Data Fig. 7b, c), decreased significantly upon damage in control cells, but not as much in Ewing sarcoma cells. We detected BRCA1 binding at a well-known R-loop region17 (Extended Data Fig. 7d, e), with a significant damage-dependent decrease in controls but not in Ewing sarcoma cell lines. Conversely, we also confirmed the presence of R-loops at BRCA1 binding sites (Extended Data Fig. 7f). Genome-wide maps of BRCA1 sites centred on transcription start sites (TSS) indicated that highly expressed gene loci were associated with both BRCA1 and RNAPII localization (Fig. 4c, Extended Data Fig. 8b). There was strong enrichment for BRCA1 and RNAPII binding at R-loops, particularly in the Ewing sarcoma cells (Extended Data Fig. 8c). We found increased co-localization between BRCA1- and RNAPII-bound transcription start sites in Ewing sarcoma (2,569 genes) compared to IMR90 cells (269 genes) (Extended Data Fig. 9a–d), corroborating the co-immunoprecipitation data. We also observed an increase in enrichment (peak height) of these two proteins in TC32 compared to IMR90 cells. Collectively, the above results indicate that in Ewing sarcoma, BRCA1 is retained at stalled transcription complexes associated with R-loops, presumably to mitigate associated damage.
In summary, our work provides a detailed examination of basal and damage-responsive R-loops in Ewing sarcoma. We confirmed the prevalence of accumulated R-loops in primary Ewing sarcoma tumours compared to other sarcomas by immunohistochemical analysis on a sarcoma tissue microarray stained with the S9.6 antibody (Fig. 4d, Extended Data Fig. 10). We further delineate the basis for EWS-FLI1 mediated tumorigenesis and chemosensitivity and conclude that interference with wild-type EWSR1 function is responsible for a large part of EWS-FLI1 function. Mutations in EWSR1 and its homologues are associated with several therapeutically challenging cancers30. It is tempting to speculate that the causal transcription stress phenotypes may extend to these tumours. We envision the use of agents that induce transcription or replication stress as potentially effective augmentative treatment strategies in various tumours30 associated with EWSR1 translocations.
METHODS
Cell culture and transfections
Ewing sarcoma cell lines (TC32, CHLA10 and CHLA258) were obtained from Children’s Oncology Group; EWS502 was obtained from S. Lessnick; and SKES1 and RDES were obtained from S. Mooberry. As controls, IMR90 (CCL-186, primary human fetal fibroblast) and U2OS (HTB-96, paediatric osteosarcoma) cell lines were obtained from the American Type Culture Collection (ATCC). IMR90 and U2OS cells were cultured in DMEM (Corning); TC32, EWS502 and RDES cells in RPMI-40 (Corning); SKES1 cells in McCoys (Corning); and CHLA10 and CHLA258 cells in IMDM (HyClone); all cultured media were supplemented with 10% heat-inactivated fetal bovine serum (Atlanta Biologicals) and 1% antibiotic/antimycotic solution (Corning). Drosophila melanogaster Kc167 cells were purchased from the Drosophila Genomics Resource Center and maintained in Schneider medium (Invitrogen) supplemented with 10% heat-inactivated fetal bovine serum at 22 °C in a humidified chamber. Human cells were maintained at 37 °C in a humidified atmosphere with 5% CO2 and tested for mycoplasma contamination. Cell lines were procured from reliable sources and additionally TC32, CHAL10, U2OS and DR-GFP U2OS cell lines were authenticated by STR analysis.
All transfections were carried out using Lipofectamine RNAiMax or Lipofectamine 3000 (Invitrogen) following the manufacturer’s instructions. For RNaseH1 transfections, 3 × 10⁶ TC32 cells were transfected with 13 μg of plasmid DNA using Amaxa nucleofection (program X-001). Gene knockdowns were performed by reverse transfection whereas plasmid transfections were performed 24 h after seeding. The siRNAs used in this study include: BRCA1 and EWSR1 (Life Technologies), EWSR1, BRCA1, FLI1 and TP53BP1(Santa Cruz). For some experiments, lentiviral transduction of TC32 cells with control short hairpin RNA (shCtrl) (clone RHZ4743, Life Technologies) or shFLI1 (clone V2THS227524 or V3THS414176, Life Technologies) was performed. EWS–FLI1, EWS–FLI1 R2L2, EWS–ERG, EWSR1 (full length) and shEWSR1 in pMSCV vector were obtained from S. Lessnick. The EWSR1 N-terminal domain in pLX304 vector was purchased from DNASU. GFP–RNaseH1 and FLAG–RNaseH1 plasmids31 were a gift from R. Crouch (Eunice Kennedy Shriver National Institute of Child Health and Human Development). HA-BRCA1 was obtained from Y. Shiio (UTH-SA). ISceI in pCAGGS vector was a gift from M. Jasin (Memorial Sloan Kettering Cancer Center) and J. Stark (City of Hope Cancer Center). All siRNA and plasmid transfections were accompanied with control siRNA or empty vector respectively.
Cell viability
Cells were seeded at 30% confluence in 96- or 384-well plates with or without reverse transfection with siRNA. For plasmid expression, cells were transfected in 60-mm dishes first and then split into 96- or 384-well plates. Cells were treated with different drugs or inhibitors on the next day, and cell viability was evaluated after 48–72 h using Celltiter-Glo (Promega). An etoposide dose causing 35% cell death (LD35) was used for most experiments unless indicated otherwise. Each condition was tested at least in triplicate. Chemicals used in cell viability experiments include etoposide (E1383, Sigma), camptothecin (C9911, Sigma), VE-821 (ATR inhibitor, Selleck Chemicals) and Olaparib (PARP1 inhibitor, Selleck Chemicals). Drug screening data from an independently published study4 were obtained from http://www.cancerrxgene.org/.
Immunoblotting and immunoprecipitation
Whole-cell lysates were prepared using RIPA buffer according to standard protocols. A subcellular protein fractionation kit for cultured cells (ThermoFisher Scientific) was used to extract nuclear and chromatin fractions. Cell lysates were separated on either precast 3–8% or 4–12% gradient gels (Invitrogen) or laboratory-prepared gels and transferred onto nitrocellulose membrane. All blots were incubated with primary antibodies overnight and developed using enhanced chemiluminescence (Super ECL, ThermoFisher). Antibodies used in this study include FLI1 (ab15289, Abcam), EWSR1 (ab133288 and ab54708, Abcam), RNAPII phospho Ser2 (MMS-129R-200, Covance), RNAPII phospho Ser5 (61085, Active Motif), RNAPII (ab817, Abcam), RNA–DNA hybrids (S9.6, ENH001, Kerafast), single-stranded DNA (ssDNA, MAB3034, Millipore), RNaseH1 (15606–1-AP, Proteintech), nucleolin (sc-13057, Santa Cruz), TP53BP1 (A300–272A, Bethyl labs), RAD51 (70–005-EX, Cosmo), ATR phospho Ser428 (cs28539, Cell Signaling), ATR (sc-1887, Santa Cruz), CHK1 phospho Ser317 (cs2344, Cell Signaling), CHK1 (cs2345, Cell Signaling), RPA2 phospho Ser33 (A300–246A, Bethyl labs), RPA2 (ab2175, Abcam), BRCA1 (sc642, Santa Cruz and 07–434, Millipore), CtIP (cs9201, Cell Signaling), FLAG-tag (ab1162, Abcam), Tata-binding protein (TBP, ab818, Abcam), β-actin (ab16039, Abcam), β-tubulin (cs2128, Cell Signaling), vinculin (cs13901, Cell Signaling), GAPDH (cs5174, Cell Signaling), lamin B1 (cs9087, Cell Signaling), Sp1 (sc-59, Santa Cruz), histone H3 (cs9715, Cell Signaling) and secondary antibodies goat anti-mouse IgG-HRP (sc-2060, Santa Cruz), goat anti-rabbit IgG-HRP (sc-2030, Santa Cruz) and goat anti-rat IgG-HRP (sc-2065, Santa Cruz). Western blot experiments were repeated with independent sample preparations three to five times.
All co-immunoprecipitation experiments were done with endogenous proteins. In brief, cells from nearly confluent 15-cm plates treated with either vehicle or an LD50 dose of etoposide for 2 h were harvested and lysed in cytosolic extraction buffer (low salt buffer: 20 mM Hepes, pH 7.4, 0.5% Nonidet P-40, 10 mM NaCl supplemented with Halt protease and phosphatase inhibitors) for 30 min on ice. The nuclei were subsequently extracted in a high salt buffer (20 mM Hepes, 0.5% Nonident P-40, 1.5 mM MgCl2, 0.5 M NaCl) for 45 min on a rocker at 4 °C. The lysates were then diluted to physiological salt concentration (150 mM NaCl) and incubated for another 45 min. The nuclear lysates (0.5–0.75 mg) were pre-cleared using protein A/G beads and incubated overnight with 2 μg antibody on a rocker at 4 °C. Settled equilibrated protein A/G beads (25 μl) (or protein L for IgM antibody) were then added to the antibody–lysate mixture and incubated for further 6 h. Bound complexes were washed three times in lysis buffer before elution with Invitrogen NuPage loading buffer. Eluted proteins were evaluated by immunoblotting and compared to inputs (10% of the amount used for immunoprecipitation). Co-immunoprecipitation experiments were repeated with biological replicates at least three times in independent sample preparations.
In vitro RNAPII phosphorylation assay
The following purified recombinant proteins were purchased: RNAPII CTD fragment (POLR2A-1149H, Creative BioMart), EWSR1 (TP303709, Origene), FUS (TP301808, Origene) and CDK9/cyclin T1 (PV4131, ThermoFisher Scientific). The in vitro kinase assay was performed using the Adapta kinase assay (PV5099, ThermoFisher Scientific) according to the manufacturer’s instructions. The template used for kinase activity was either 50 μM CDK7/9tide (triheptad repeat peptide) provided in the kit (PV5090, ThermoFisher Scientific), or 12 ng RNAPII CTD fragment. EWSR1 or FUS (1 μM) was added to the substrate and 10 μM ATP kinase buffer and pre-incubated for 15 min. CDK9/cyclin T1 (1.77 μg/ml) was then added and the kinase reaction was allowed to proceed for a further 45 min. ADP and ATP (10 μM each) served as positive and negative controls, respectively. Finally, Eu-labelled antibody and Alexa Fluor-647-labelled tracer were added and the level of ATP consumption was measured 30 min later using BMG Labtech Pherastar microplate reader. Each condition was tested with technical quadruplicates and the overall experiment was repeated at least twice for independent validation.
Transcription recovery assay
Cells grown on fibronectin-coated coverslips were treated with LD50 doses of etoposide for 0, 2 or 16 h, followed by incubation in medium containing 0.5mM 5-ethynyl uridine (EU, ThermoFisher Scientific) for 30 min. After incubation, cells were fixed, permeabilized and subjected to Click-iT RNA reaction (Click-iT RNA Alexa Flour 598 Imaging kit, ThermoFisher Scientific) according to the manufacturer’s instructions. Washed coverslips were mounted onto glass slides using ProLong Antifade Mounting Solution with DAPI (ThermoFisher Scientific) and imaged using a Zeiss microscope at 63×. A minimum of 100 cells was analysed for each condition. Image analysis was performed using ImageJ. The overall experiment was independently verified three times.
Dot blot for R-loops
Restriction enzyme-digested genomic DNA (0.5 μg) was loaded on to pre-wet H+ nylon membrane. The membrane was washed twice with dH2O, rinsed in 2× SSC buffer and then left to air dry at room temperature. For ssDNA, an additional denaturation step (incubation in 0.5 N NaOH, 1.5 M HCl for 10 min), followed by a 10 min incubation in neutralization buffer (1 M NaCl, 0.5 M Tris-HCl pH 7) was performed. The membrane was then blocked with 1× TBS containing 5% non-fat dry milk and incubated with the primary antibody (R-loops S9.6 antibody and ssDNA) in blocking buffer overnight. The blots were analysed using ImageJ software or LI-COR Image Studio to measure signal intensity from genomic DNA, RNaseH-treated DNA and ssDNA. ssDNA signal was used to normalize R-loop signal. Dot blot experiments were performed with technical quadruplicates and repeated at least twice with independent sample preparation for validation.
Immunofluorescence
Cells were seeded on fibronectin-coated coverslips. Following knockdown and/or 6-h etoposide treatment, cells were fixed with 4% paraformaldehyde. For R-loops, a pre-extraction step was carried out by treating the cells with 0.1% triton-X 100 in PBS for 30 s at room temperature. After permeabilization with triton-X 100 for 10 min, cells were blocked for 1 h with 1% BSA, 4% goat serum followed by overnight incubation with primary antibodies in blocking buffer. Coverslips were then incubated with Alex Fluor 488/568 conjugated secondary antibodies (Life Technologies). The cells were then stained with DAPI and coverslips were mounted on slides using Vectashield (Vector Labs). Cells were imaged using a Zeiss microscope at 40× or 63×. At least 100 nuclei per data set were sampled and a minimum of 80 nuclei per condition was used for quantification of immunofluorescence intensity or foci counting. Image analysis was done using Adobe Photoshop software. Immunofluorescence experiments were repeated for validation.
Immunohistochemistry
The sarcoma tissue microarray (T264) was purchased from US Biomax Inc. Tissue microarrays were treated with 1 mM EDTA pH 8 for 40 min at 95 °C followed by a 20-min cool down step. To confirm antibody specificity, slides were incubated with RNaseH (M0297, New England Biolabs) and RNaseA (EN0531, Thermo Fisher Scientific) enzymes for 1 h and 24 h at 37 °C, respectively, as previously described32. Slides were then rinsed in 1× Tris buffered saline (TBS) three times. Following endogenous peroxidase blocking, the slides were incubated with S9.6 (1:20,000) for 2 h at room temperature in a moist humidity chamber. Anti-mouse Powervision-HRP Conjugated Polymer from Leica (Cat #PV6114) for 30 min was used for detection. Slides were then developed with DAB for 5 min, rinsed with TBS and counterstained with haematoxylin, dehydrated, cleared and mounted with a synthetic mounting medium. Images were taken on an Olympus sc-100 at 60× magnification or a Motic Digital Slide Scanning System at 40× magnification.
Repair assays
The DR-GFP reporter assay was carried out as previously described22. U2OS cells with stably integrated DR-GFP construct and the endonuclease ISceI expression vector were obtained from M. Jasin (Memorial Sloan Kettering Cancer Center) and J. Stark (City of Hope Cancer Center). In brief, cells were seeded into 24-well plates and transfected with siRNAs or expression vectors or combinations thereof. On the next day, cells were transfected with ISceI expression vector. After 72 h, cells were harvested and GFP-positive cells were evaluated by flow cytometry on a BD FACSCanto flow cytometer. Appropriate controls were used and all experiments were performed with transfection triplicates and repeated for independent validation.
BRCA1 ChIP–qPCR at DR-GFP sites
This assay was carried out as described33. In brief, DR-GFP U2OS cells were transfected with EWS–FLI1 or the empty vector control. Twenty-four hours later, a DSB was induced by transfection with ISceI expression vector. Cells were fixed with 1% formaldehyde 16 h later and then washed with ice-cold 0.5% BSA/PBS. Fixed cells were resuspended in lysis buffer (1% SDS, 10 mM EDTA, 0.5 mM EGTA, 50 mM Tris-HCl pH 7.5, 0.2% Triton X-100, protease and phosphatase inhibitor cocktail), and sonicated to achieve a desired median fragment length of 200 bases. Lysates were then diluted in immunoprecipitation buffer (1% Triton X-100, 2 mM EDTA, 150 mM NaCl, 20 mM Tris-HCl pH 7.5, protease and phosphatase inhibitor cocktail). Five per cent of the solution was reserved as input. The remaining pre-cleared lysates were used for overnight immunoprecipitation with either BRCA1 antibody (A300–000, Bethyl Labs) or IgG control (ab37415, Abcam) and pre-washed beads. On the next day, beads were washed with SDS-free RIPA/LiCl buffer (50 mM HEPES pH 7.5, 1 mM EDTA, 0.7% sodium deoxycholate, 1% NP-40, 0.5 M LiCl, protease and phosphatase inhibitor cocktail) followed by washes in 1× TE buffer. Immunoprecipitated beads were resuspended in elution buffer (1% SDS, 0.1 M sodium bicarbonate) and incubated at 65 °C to reverse the crosslinks. Eluates were further subjected to proteinase K treatment for 2 h at 37 °C and purified using Qiagen. Real-time quantitative PCR (qPCR) was conducted according the protocol below along with the primers described previously34,35.
Quantitative PCR
qPCR was performed on DNA samples obtained either after chromatin immunoprecipitation or DNA–RNA immunoprecipitation using SYBR qPCR Mix (Applied Biosystems) according to the manufacturer’s protocol. All reactions were carried out in technical triplicates. The following primers were used for qPCR performed with technical triplicates: APOE: FP: 5′-CCGGTGAGAAGCGCAGTCGG-3′; RP: 5′-CCCAAGCCCGACCCCGAGTA-3′; PARP8: FP: 5′-GGGTGTCCTTAGGCAGAACA-3′; RP: 5′-ATGGAAACCTGTTTGGCTTG-3′; FEN1: FP: 5′-CCTCTCGCCCTTAGAAATCG−3′; RP: 5′-TAGACGCTCCTGGAACCTC−3′.
RNAi screens
The RNAi screens with etoposide, bleomycin and MMS were performed as described previously36. Kc167 cells (Drosophila melanogaster; 1.2 × 10⁴) were seeded into 384-well plates with Schneider medium and grown at 22 °C in a humidified chamber. Each well of a 384-well plate contained 0.25 μg double-stranded RNA (dsRNA) with 22,915 dsRNA representing the whole library. The top 5% ‘survival’ hits for each damaging agent were calculated (Supplementary Table 2) as described36. Detailed analysis of MMS hits has been published37.
RNA-seq and gene expression analysis
IMR90, U2OS, TC32, EWS502, CHLA258 and CHLA10 cell lines were grown in 10-cm dishes to 90% confluence. Samples were collected after 0, 6, 12, 18 or 24 h of etoposide exposure (equitoxic doses leading to 65% viability after 72 h) and RNA extracted using Qiagen RNeasy kit. The quality of RNA samples was analysed using an Agilent 2100 BioAnalyzer. Sequencing libraries were prepared from total RNAs according to Illumina’s RNA sample preparation protocol. Samples were barcoded, and pooled and sequenced with a HiSeq 2000 system with the 50 bp paired-end protocol, and with targeted read counts around 30 million reads. Only U2OS samples were sequenced with the 50 bp single-end protocol. We used TopHat2 aligner to map paired reads to the UCSC hg19 genome build. To quantify gene expression, we used HTSeq to obtain raw read counts per gene and then converted to RPKM (read per kilobase of gene length per million reads of the library) according to gene length and total mapped read count per sample. Log2-transfromed RPKM measurement was used as gene expression level. Differential expression analysis and functional annotation classification were conducted using Gene Set Enrichment Analysis38 (Broad Institute) and DAVID39.
Chromatin immunoprecipitation
Cells were grown to ~80% confluence and treated with etoposide (LD65) for six hours. Chromatin was harvested after fixing with 1% formaldehyde and sheared to an average length of 200–1,500 bp using a Branson sonicator. Four hundred micrograms of sheared chromatin was added to 50 μl protein G beads that were pre-incubated with 10 μg antibody: RNAPII (GAH-111, Qiagen), BRCA1 (sc-646, Santa Cruz) and IgG (GAH-111, Qiagen or ab37415, Abcam), for overnight incubation. ChIP DNA was eluted by incubating beads in elution buffer (50mM Tris pH 8.0, 10mM EDTA and 1% SDS) overnight at 65 °C, followed by sequential treatments with RNaseA and proteinase K. The final ChIP DNA was purified by phenol/chloroform extraction and ethanol precipitation. These samples were further sheared using a Covaris sonicator to an average length of 350 bp. Library construction and purification was done following the manufacturer’s protocol (MicroPlex Library Preparation kit, Diagenode and AgenCourt Ampure XP, Beckman Coulter). Two control and two Ewing sarcoma cell lines were used for sequencing and repeated for validation.
DNA–RNA immunoprecipitation
DRIP was performed according to a previously published protocol17. In brief, DNA from a nearly confluent 10-cm dish was obtained using proteinase K followed by phenol/chloroform extraction and ethanol precipitation. DNA was subjected to overnight digestion using a cocktail of restriction enzymes (HindIII, EcoRI, BsrGI, XbaI and SspI, NEB). After being cleaned up with phenol/chloroform/ethanol, 4 μg digested DNA with or without RNaseH pre-treatment was used as input for immunoprecipitation using S9.6 antibody (Kerafast). The DNA–antibody complex was incubated for 16 h and allowed to bind protein A/G beads for a further 4 h. Bound DNA fragments were recovered in the elution buffer by incubating with proteinase K at 55 °C for 45 min. Recovered DNA was cleaned using phenol/chloroform/ethanol and resuspended in 10 mM Tris-HCl pH 8.0. Each immunoprecipitation was run in triplicate and samples were pooled for sequencing after sonication.
ChIP and DRIP sequencing and peak identification
Sonicated and size-selected DNAs (immunoprecipitated DNA that was untreated or treated with etoposide or RNaseH, and input DNA) were processed according to the Illumina Genome DNA library preparation protocol, and sequenced with a HiSeq 2000 or a HiSeq 3000 system with 50 bp single-read sequencing protocol. On average, 30–40 million reads were generated for each DNA sample, and then aligned to the UCSC hg19 genome build using BWA. Peak calling was performed using the MACS240 algorithm. Similar to ref. 17, we used a peak calling parameter with fivefold up to 30-fold enrichment over corresponding input DNA as control (MACS2 parameters: -g 2.7e9 -q 0.05 -B -m 5 30).
Determination of consensus ChIP and DRIP regions
The methodology for analysis has been described in detail41. In brief, DRIP regions were first stacked according to their genomic position (within each chromosome), and then regions that were present in at least three DRIP samples (under any condition) were selected. If the next adjacent region was less than 200 bp away, we treated them as being contiguous. Regions smaller than 200 bp were eliminated. With each seed region, we extended it to the longest run within the stack, followed by another merging step between adjacent regions that were less than 200 bp apart. A total of 33,121 DRIP regions were detected. Small DRIP regions were determined by removing samples with strong DRIP peaks (EWS502, CHLA10, and TC32), and then performing the consensus peak detection algorithm again.
ChIP and DRIP region coverage
We quantified DRIP regions by coverage and sequence read count. DRIP regions with greater coverage and higher enrichment (large sequence read count), were indicative of a true DRIP peak. After obtaining the consensus regions, coverage of each sample was defined as:
In other words, the coverage of a given sample is the percentage of consensus peaks that are covered by the original DRIP peaks obtained by the MACS algorithm.
Normalized read counts
To quantify the read counts within the DRIP regions, we first counted short sequence reads within 100-bp tiling bins equally across the entire genome using the BedTools/CoverageBed command. The normalized read count of a given DRIP region was quantified as:
where N is the total number of DRIP peaks. Read count per DRIP region was normalized to 10 million reads per library. By considering read length (50 bp) and bin size (100 bp), the read count unit essentially defines the normalized depth of coverage per 10 million reads per library. Therefore, if we use consensus DRIP regions for all samples, the read count of a given DRIP region becomes comparable between samples.
Gene sets derived from EWS ChIP–seq or other profiling techniques
EWS–FLI1 targeted genes determined by ChIP–seq were extracted from ref. 18. One thousand, seven hundred and eight-five EWS–FLI1 binding sites were reported, which we mapped to 1,314 unique genes.
DRIP–seq and ChIP–seq heatmaps
For any given gene set, a heatmap of DRIP data, ChIP data and gene expression data was generated for correlation examination. The gene set was provided in a BED format that contains at least five columns: 1) chromosome; 2) genomic start position; 3) genomic end position; 4) unique ID; 5) gene symbol. All genomic data were derived from the UCSC hg19 genome build. If defined by transcription start site (TSS), [Author: Please clarify what you mean by ‘if TSS’] columns 2 and 3 were ±100 bp around the TSS defined by the farthest TSSs, when multiple transcripts are defined in the UCSC hg19 ‘refFlat’ table. If the genes were derived from ChIP–seq data, then the genomic positions were simply the DNA binding sites from a given pull-down target. Heatmap selects 50 bins (5,000 bp) to the left and right (x-axis) for a given gene set (y-axis), then plots the read count value from white (read count 0) to dark red. Gene set (y-axis) can be sorted by the peak value defined in the following sections.
DRIP–seq.
Raw sequence read counts around ±5,000 bp (50 bins to each side, with bins of 100 bp) were extracted around the centre of each site defined in the gene set. Each gene was also represented by a mean read count over 100 bins. If a specific order for DRIP data was requested, it was sorted again by read count. To generate a colour map, we used a colour scheme as follows: white, no reads; magenta, with detectable read counts; black/dark magenta, height peaks. DRIP–seq data were normalized to 20 million reads per library equivalent.
ChIP–seq.
Similar to DRIP–seq data, raw read counts ±5,000 bp were extracted around the centre of each site defined in the gene set. Given that BRCA1 binding sites are mostly narrow peaks, we calculated the mean peak height over windows of seven consecutive bins (700 bp), and then took the maximum height over all moving seven-bin windows, or:
where RC is the read count of a given bin. By doing so, we allow the ChIP–seq peak to be within the region, but not necessary situated at the centre, particularly when TSSs or TTSs were requested. Heatmaps were generated using the same colour scheme as for DRIP–seq. The code for rendering the heatmaps was written in Matlab and will be made available upon request.
Gene expression.
Gene expression data were extracted using gene symbol matching. Log2-transformed RPKM was used to represent expression level. The heatmap colour scheme is as follows: magenta, higher expression; blue, lower expression.
Kolmogorov–Smirnov test for enrichment
For a given gene list, we sorted ChIP data, gene expression data, DRIP, RNAPII and BRCA1 ChIP data (as shown in Extended Data Fig. 4c) according to ChIP–seq peak height, gene expression level, or DRIP–seq mean read count. To demonstrate the concordance of ChIP peaks and DRIP peaks, for example, we hypothesized that if concordance did not exist, then the DRIP peaks would be uniformly distributed within the gene list. Therefore, we first determined the ChIP peak threshold (peak height >9), DRIP peak threshold (read count >μ + MAD × 1.89, where μ is the median threshold obtained by calculating mean values across a +/− 5kb region surrounding the peak and MAD is the median absolute deviation for the same) [Author: Please define μ] and expression >5. Depending on the number of peaks we got from ChIP–seq (for example), we determined the threshold for expression and DRIP–seq such that both will have the same positive number of peaks or genes, and we then examined their location within gene list and determined whether they are uniformly distributed using the Kolmogorov–Smirnov test. The code for performing the statistical test was written in MATLAB and will be made available upon request.
Statistical analysis
P values for analysing cell viability, R-loop intensity, homologous recombination repair and enzyme assays were computed using either Student’s t-test (two-tailed) or one-way ANOVA with Bonferroni correction for cell line differences at each drug dose in GraphPad Prism software. Where applicable, two-way ANOVA was employed. When performing multiple comparisons, an FDR of 1% was used as cutoff as evaluated using the Benjamini–Hochberg method. P < 0.05 or 0.005 was considered significant (marked as *, # or **, ## respectively). No statistical methods were used to predetermine sample size.
Extended Data
Extended Data Figure 1 |. Characterizing Ewing sarcoma chemosensitivity.
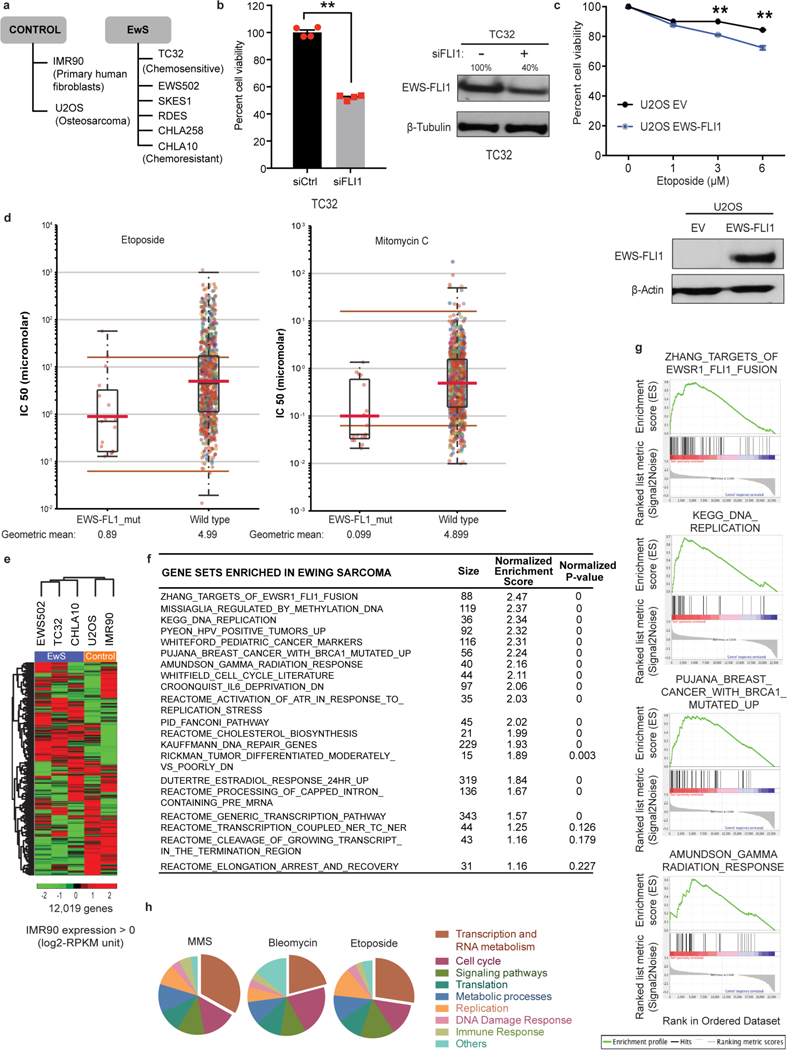
a, Cell lines used in the study. b, Level of cell death caused by EWS–FLI1 knockdown alone in TC32 cells. Immunoblot shows extent of knockdown; n = 4 transfection replicates. c, Cell viability of U2OS cells transfected either with empty vector (EV) or EWS–FLI1 for 24 h before etoposide exposure for a further 48 h. Immunoblot shows transfection efficiency; n = 3 transfection replicates. d, IC50 levels of etoposide or mitomycin in EWS–FLI1 mutant (n = 16) versus pan-cancer (n = 143) dataset. Brown lines, range of screening concentrations of the drug. Red lines, geometric mean of drug concentration. e, Heatmap of basal gene expression profile in control and Ewing sarcoma cell lines after hierarchical clustering. f, g, Top enriched pathways from gene set enrichment analysis of the differences between Ewing sarcoma and IMR90 cells are listed (f) and relevant signature plots are illustrated (g). We found differential upregulation of replication stress, BRCA1-mutation driven network and altered transcription regulation pathways in Ewing sarcoma. h, Cross-screen pathway comparison of top survival hits from RNAi screens in Drosophila Kc167 cells exposed to MMS, bleomycin or etoposide. Nearly a third of the top 5% hits in each screen were genes involved in transcription and RNA metabolism, highlighting the importance of this pathway in DNA damage survival. Mean ± s.e.m., *P < 0.05, **P < 0.005, two-tailed t-test.
Extended Data Figure 2 |. Aberrant transcription regulation in Ewing sarcoma.
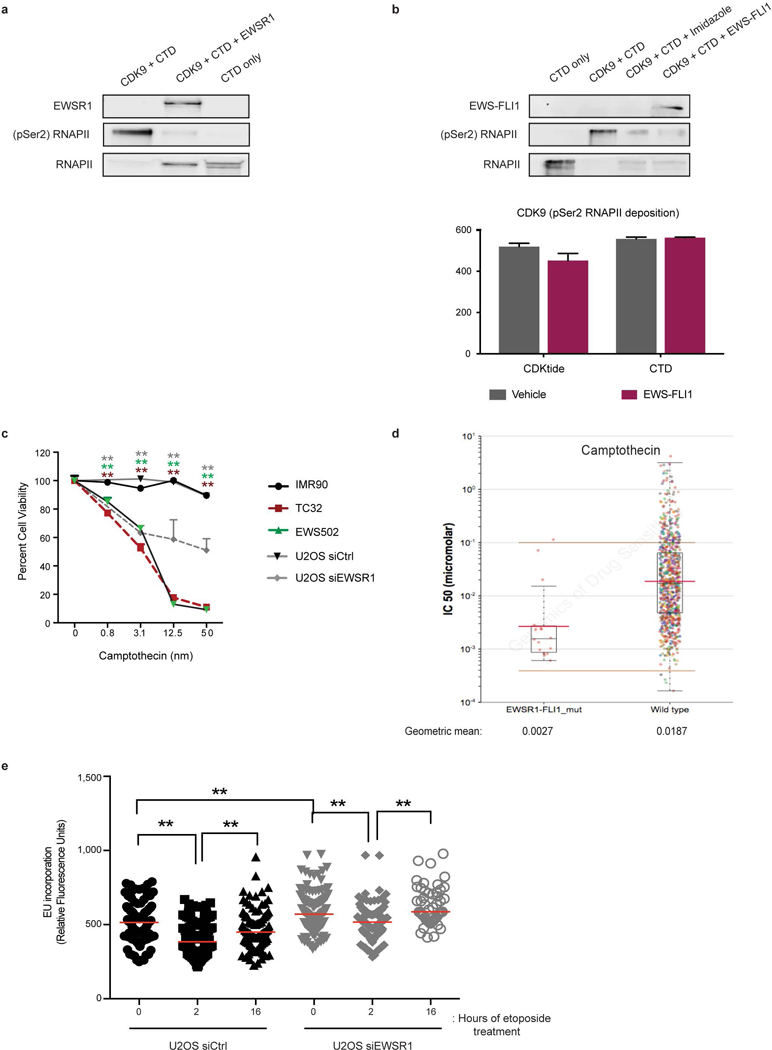
a, Immunoblot depicting the phosphorylation of RNAPII CTD fragment used as the substrate in Fig. 1d. Recombinant EWSR1 and hypophosphorylated RNAPII are also displayed. b, Level of inhibition of CDK9 activity by buffer (vehicle) or recombinant EWS–FLI1 protein on the two RNAPII CTD substrates. The immunoblot on top is confirmation of kinase activity measured by the assay. c, Cytotoxicity profile in response to camptothecin in control, Ewing sarcoma and EWSR1-depleted cells. n = 4 technical replicates, One-way ANOVA against IMR90 cells. d, IC50 levels of camptothecin in EWS–FLI1 mutant (n = 15) versus pan-cancer (n = 132) dataset. Brown lines, range of screening concentrations of the drug. Red lines, geometric mean of drug concentration. e, Transcription restart assay measured in U2OS cells transfected with either scrambled or EWSR1 siRNA. n = 4 transfection replicates, Two-way ANOVA. Mean ± s.e.m., *P < 0.05, **P < 0.005.
Extended Data Figure 3 |. R-loops in Ewing sarcoma.
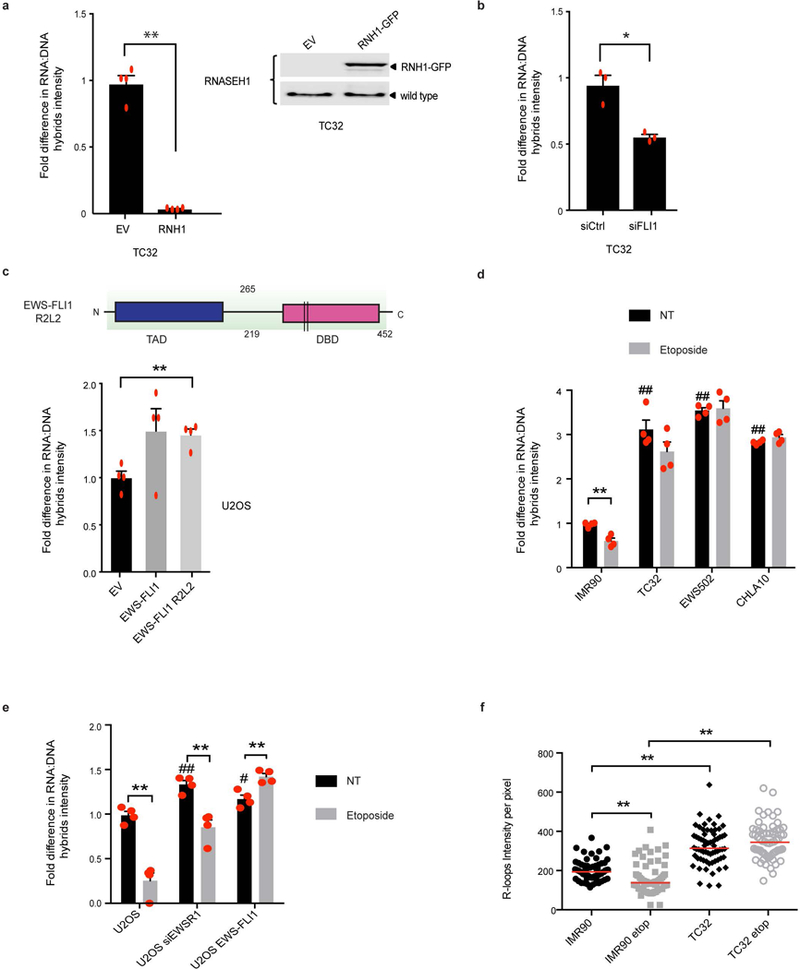
a, Quantification of RNA–DNA hybrids in TC32 cells transfected with either empty vector (EV) or RNaseH1 (RNH1). The immunoblot to the right indicates RNaseH1 transfection efficiency; n = 4 transfection replicates. b, RNA–DNA hybrid levels in TC32 cells with scrambled (siCtrl) or EWS–FLI1 (siFLI1) knockdown; n = 3 transfection replicates. c, Schematic of the EWS–FLI1 R2L2 construct. Arginine residues 383 and 386 (black bars) in EWS–FLI1 are converted to leucine to render the fusion oncogene deficient in DNA binding. Below is a quantification of RNA–DNA hybrids in U2OS cells expressing empty vector, EWS–FLI1 or EWS–FLI1 R2L2; n = 4 transfection replicates. d, e, Fold change in RNA–DNA hybrids after damage (etoposide, 6 h) in IMR90 versus Ewing sarcoma cells (d) or U2OS cells with either EWSR1 depletion or EWS–FLI1 expression (e). NT, no treatment; n = 4 technical or transfection replicates. f, Quantification of nucleoplasmic RNA–DNA hybrids in the immunofluorescence images (n = 80 nuclei) demonstrated a clear increase in overall R-loop intensity in Ewing sarcoma cells. Nucleolin signal was used to subtract nucleolar R-loops. One-way ANOVA. Mean ± s.e.m., #,*P < 0.05, ##,**P < 0.005. # indicates significance of Ewing sarcoma relative to untreated IMR90 cells or transfections relative to U2OS cells.
Extended Data Figure 4 |. DRIP–seq data validation.
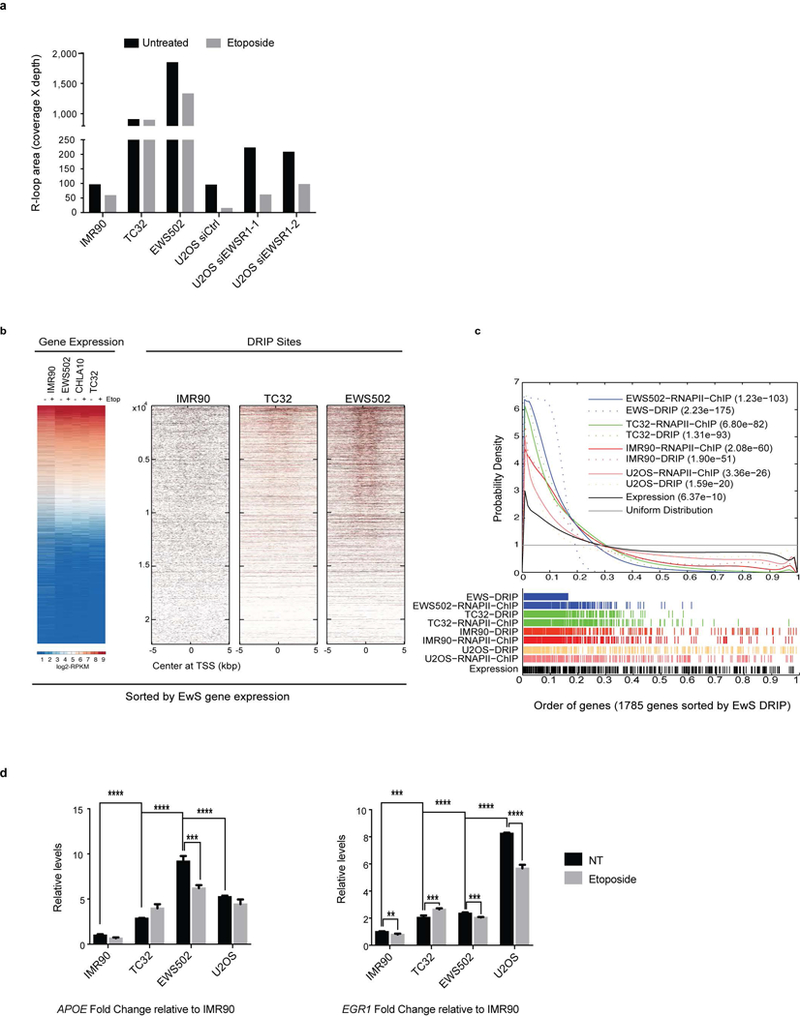
a, Quantification of DRIP (coverage of DRIP region multiplied by reads in that region) across all samples. y-axis is graphed in logarithmic scale. b, Representative whole-genome heatmaps centred around TSS ordered by average expression of Ewing sarcoma cells. c, Probability density graph plotted with a Gaussian smoothing kernel of the distribution of DRIP peaks and EWS–FLI1 ChIP peaks at EWS–FLI1 bound genes relative to uniform distribution. n = 281 genes (top 16%). Inset, P values depicting significance of enrichment for each sample. d, Fold enrichment of qPCR product from ChIP experiments done with RNAPII antibody in control and Ewing sarcoma cell lines. The primers target well-known R-loop regions within APOE and EGR1 genes. Mean ± s.e.m., n = 3 technical replicates, ***P < 0.0005, ****P < 0.00005. One-way ANOVA across cell lines compared to IMR90 cells and two-tailed t-test within cell lines.
Extended Data Figure 5 |. R-loop-dependent replication stress and recombination defect in Ewing sarcoma.
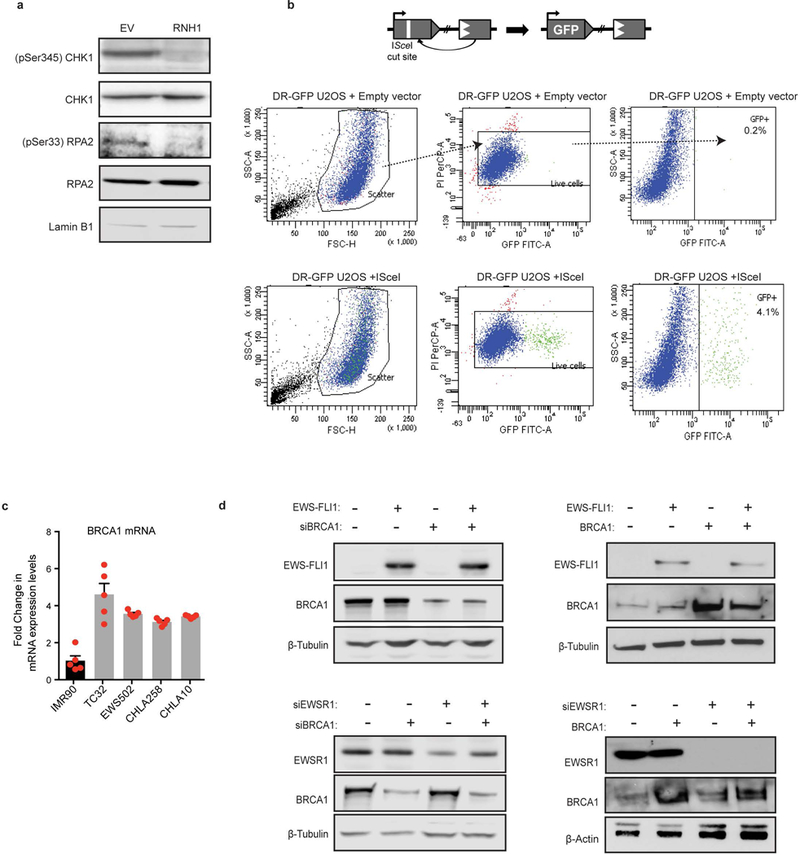
a, Representative immunoblots evaluating decrease in ATR kinase pathway activation upon overexpression of RNaseH1 in TC32 cells. b, Schematic of the DR-GFP construct integrated into U2OS cells. Below are representative scatter plots of the gating scheme used to determine percentage of GFP-positive cells after inducing a DSB via ISceI vector compared to empty vector. c, RNA-seq data of BRCA1 transcript levels in Ewing sarcoma cell lines compared to IMR90 cells. d, Immunoblots demonstrating transfection efficiency of indicated siRNA and expression constructs used in Fig. 3f, g.
Extended Data Figure 6 |. Similarity of Ewing sarcoma to BRCA-deficient tumours.
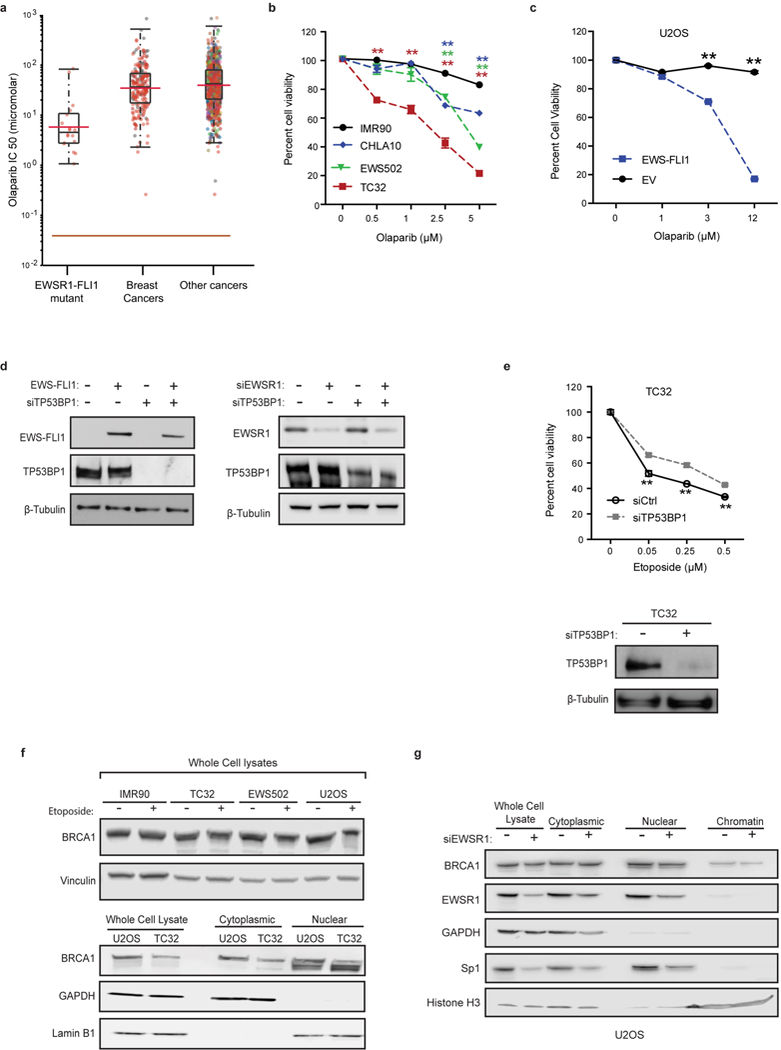
a, IC50 levels of olaparib in EWS–FLI1 mutant cells (n = 17) versus breast cancers (n = 13) or pan-cancer (n = 147) dataset. b, Cell viability of IMR90 and Ewing sarcoma cells with increasing doses of olaparib. Mean ± s.d., n = 3 technical replicates, one-way ANOVA compared to IMR90 cells. c, Cell viability plot demonstrating the role of EWS–FLI1 in mediating exquisite sensitivity to olaparib in U2OS cells transfected with either the oncogene or empty vector; n = 3 transfection replicates. d, Immunoblots depicting transfection efficiency of indicated siRNA and expression constructs used in Fig. 3h. e, TP53BP1 knockdown improved Ewing sarcoma (TC32 cell) survival in response to damage. Immunoblots depict level of TP53BP1 knockdown. n = 4 transfection replicates. f, Representative immunoblots showing equivalent levels of BRCA1 in whole cell lysates (upper panel) from control and Ewing sarcoma cells with and without etoposide treatment (2 h). The lower panel shows BRCA1 redistribution in subcellular fractions of U2OS or TC32 cells. GAPDH and lamin B1 were used as loading controls for the cytoplasmic and nuclear fractions, respectively. g, Immunoblots of whole cell lysates and subcellular fractions from U2OS cells with and without EWSR1 depletion. Data indicated no change in BRCA1 levels with EWSR1 knockdown. Loading controls include: GAPDH for cytoplasm, Sp1 for nuclei and histone H3 for chromatin. Mean ± s.e.m., **P < 0.005, two-tailed t-test at each dose.
Extended Data Figure 7 |. Association of BRCA1 with the transcription complex in Ewing sarcoma.
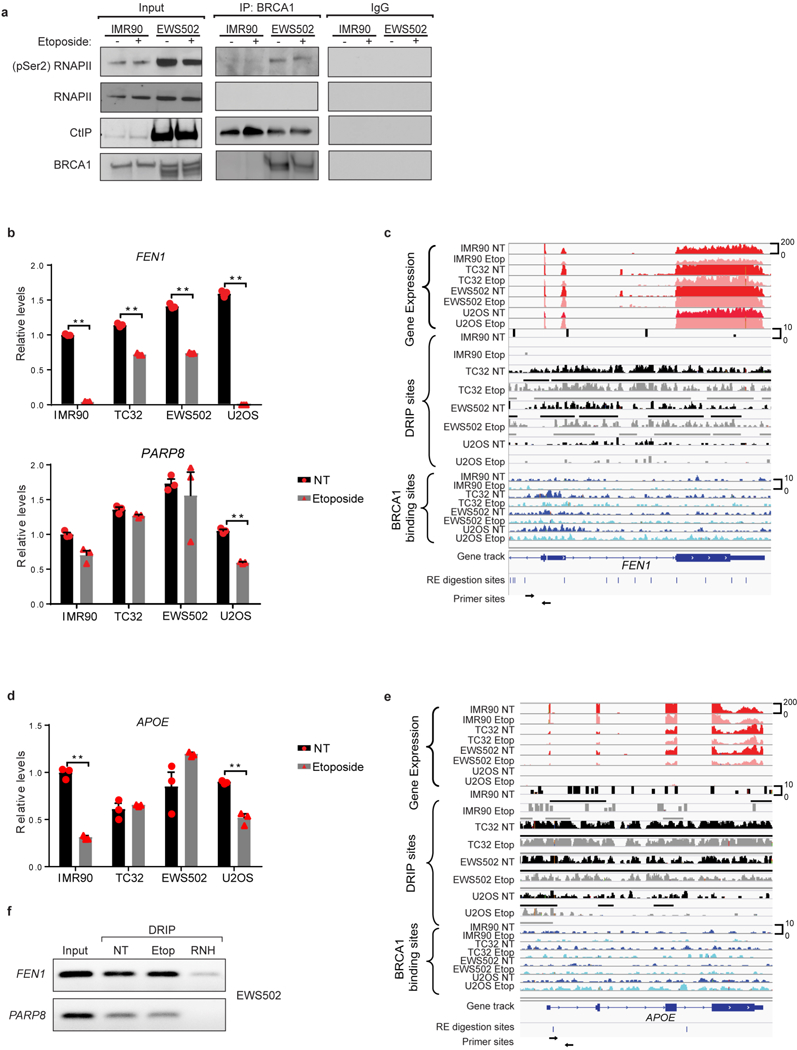
a, Co-immunoprecipitation: immunoblots of IMR90 and EWS502 nuclear lysates with and without exposure to etoposide (2 h). The left panel indicates 10% of the input used for immunoprecipitation. BRCA1 antibody was used for immunoprecipitation in the middle panel and the rightmost panel indicates specificity of interaction against IgG pulldown. b, Real-time qPCR analysis of BRCA ChIP samples from control and Ewing sarcoma cell lines with and without etoposide treatment, using primers within the FEN1 and PARP8 genes. c, Representative sequencing track image of gene expression (red tracks), R-loop sites (black and grey tracks) and BRCA1 binding sites (blue tracks) across the FEN1 gene demonstrating the enrichment of R-loops and BRCA1 in the region amplified by the primers in b. d, qPCR analysis as in b with primers targeting a well-known R-loop region within the APOE gene. e, Representative sequencing track image as in c across the APOE gene. f, Agarose gel blots evaluating amplicons generated using EWS502 DRIPs with primers against FEN1 and PARP8. NT, no treatment; Etop, etoposide-treated (6 h); RNH, RNaseH-treated samples. Mean ± s.e.m., n = 3 technical replicates, **P < 0.005, two-tailed t-test.
Extended Data Figure 8 |. Genome-wide heatmaps.
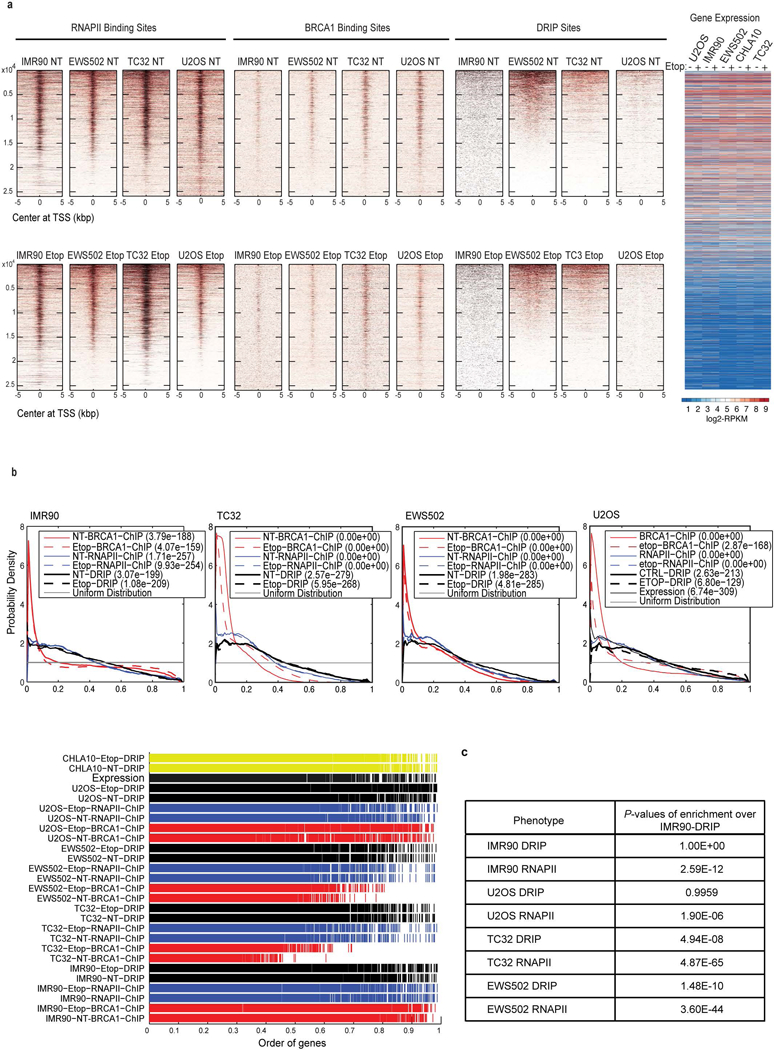
a, Heatmaps representing genome-wide localization of RNAPII, BRCA1 and R-loop sites centred on the TSS. The data were sorted by DRIP sites. The upper panel represents untreated (NT) samples and the lower panel represents etoposide (Etop, 6 h) treated samples. There was a clear decrease in BRCA1 and R-loop signal upon damage in the control cell lines, unlike in Ewing sarcoma. b, KS plots to demonstrate empirical distribution of the top 13.8% of DRIP and ChIP peaks and higher expression relative to uniform distribution. Data are sorted by BRCA1 ChIP, n = 3,066 genes. c, P values of statistical comparisons between RNAPII ChIP and R-loop probability distributions for all cell lines against IMR90 DRIP data centred on the TSS. The top 27% of DRIP–seq peaks corresponding to 6,127 genes were used for the analysis and data were sorted by BRCA1 binding sites.
Extended Data Figure 9 |. Correlation between BRCA1 and RNAPII binding.
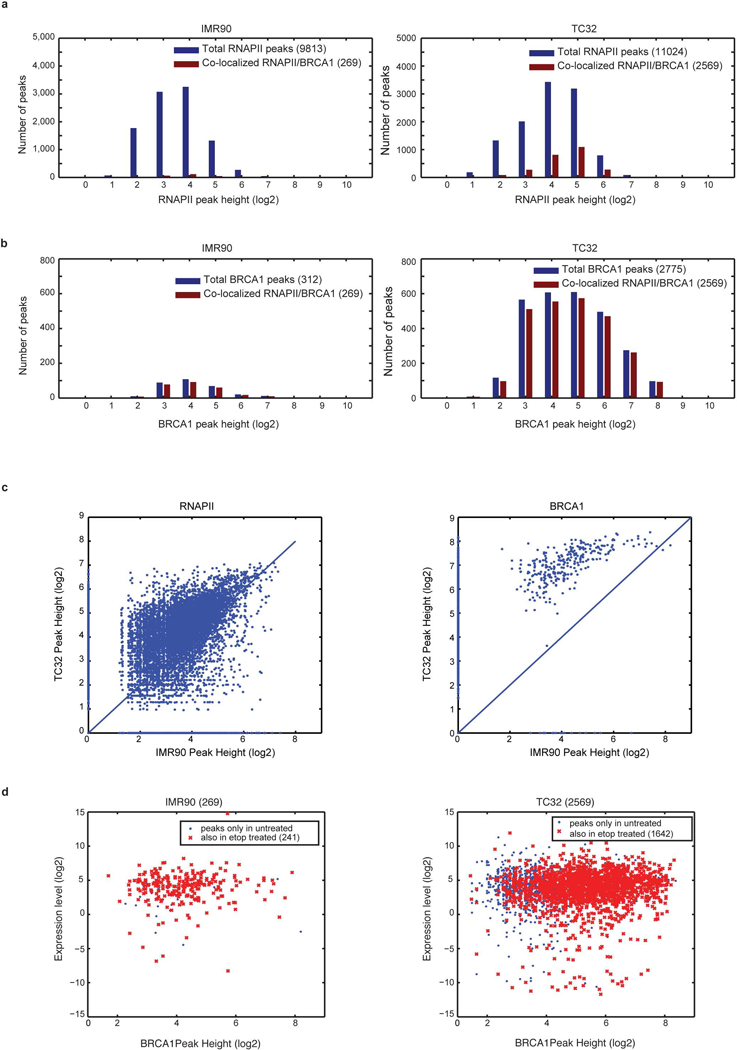
a, Distribution of RNAPII abundance across the genome for IMR90 and TC32 cells. The bars depict the number of RNAPII bound sites as a function of the number of peaks (y-axis) and relative abundance (peak height, log-transformed) within these peaks (x-axis). The blue bars indicate the total number of peaks determined from RNAPII ChIP–seq and the red bars represent the peaks that co-localize with BRCA1 peaks obtained from BRCA1 ChIP–seq. The data indicated a similar number of RNAPII peaks for TC32 (11,024) compared to IMR90 (9,813), but a greater amount of DNA bound at these peaks, implying increased RNAPII binding. Furthermore, a higher proportion of RNAPII-bound loci also co-localized to BRCA1 binding sites (red bars) in TC32 than in IMR90 cells (23% compared to 2.7%) and there was a clear increase in RNAPII abundance at these sites. b, Distribution of BRCA1 abundance across the genome for IMR90 and TC32, similar to a. The data indicate a significantly higher number of total BRCA1 peaks in TC32 cells as well as a significantly higher enrichment of BRCA1 within these peaks in TC32 cells compared to IMR90 cells. The data also suggest that the majority of the BRCA1 peaks were co-localized with RNAPII. c, Scatter plots represent the correlation of RNAPII (left) and BRCA1 (right) peak heights between TC32 and IMR90 cells. Data were plotted after being normalized to read count and log-transformed to make comparisons. Loci that are unique to each cell line map to the axes whereas common loci are scattered around the diagonal. The data clearly suggest an increase in enrichment of both RNAPII and BRCA1 in TC32 cells compared to IMR90 cells. d, Scatter plots represent the relationship between co-localized BRCA1 and RNAPII peaks as a function of BRCA1 peak height (x-axis) and level of expression of the gene associated with these binding sites (y-axis). TC32 cells showed a greater than fivefold increase in the number of BRCA1 peaks that were associated with RNAPII at highly expressed genes. Further, as in b, there was a greater abundance of BRCA1 (peak height) at these highly expressed genes in TC32 cells than in IMR90 cells.
Extended Data Figure 10 |. Immunohistochemical analysis of tissue sections.
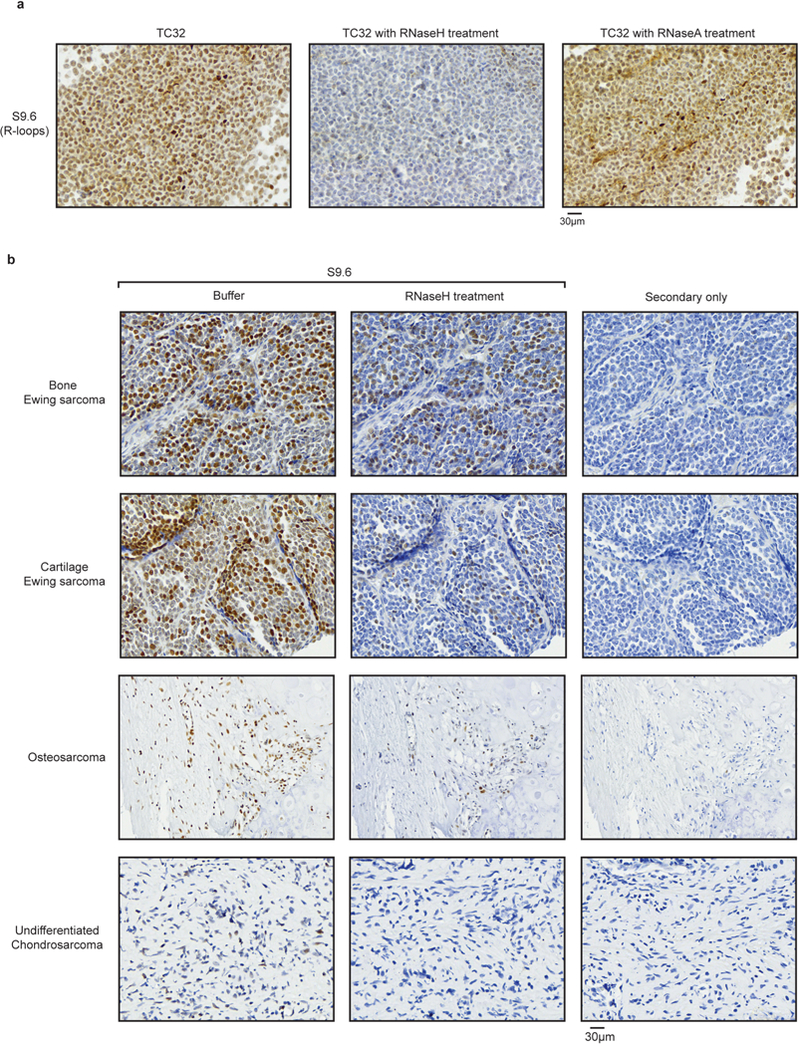
a, Representative images depicting R-loop staining by S9.6 antibody on sections derived from fixed TC32 cell pellets. Sections were treated with buffer (left), RNaseH (middle) or RNaseA (right) after antigen retrieval. The slides demonstrate loss of R-loop signal after treatment with RNaseH, as expected. RNaseA treatment, which at higher salt concentrations specifically cleaves single-stranded RNA, did not result in a significant loss of R-loop signal confirming the specificity of S9.6 antibody in detecting RNA–DNA hybrids. b, Representative images from a pan-sarcoma tissue microarray. The left and centre panels were probed with S9.6 antibody with or without RNaseH treatment. The right panel was stained with secondary antibody alone and serves as a non-specific control. Each row represents images from one tumour indicated on the left. Images were scanned at 40× (bar at the bottom right denotes resolution).
Extended Data Table 1:
Differentially altered processes between EwS and IMR90
| a Processes upregulated in IMR90 by etoposide but not in EwS cell lines |
| Biological Process | p-value |
|---|---|
| Regulation of cell proliferation | 3.90E-10 |
| Regulation of programmed cell death | 4.61E-07 |
| Regulation of phosphorylation | 2.12E-07 |
| Positive regulation of gene expression | 1.93E-02 |
| b Processes downregulated in IMR90 by etoposide but not in EwS cell lines |
| Biological Process | p-value |
|---|---|
| Cell cycle | 1.51E-35 |
| Mitosis | 4.93E-34 |
| Positive regulation of macromolecular metabolic process | 9.08E-05 |
| Regulation of gene expression | 1.62E-04 |
| Regulation of RNA metabolic processes | 2.38E-03 |
Extended Data Table 2:
Comparison of EwS and BRCA-mutant cancers
| Phenotype | BRCA1/2 mutant cancers | Ewing sarcoma |
|---|---|---|
| Sensitivity to DNA damaging agents | ✔ | ✔ |
| Sensitivity to PARP1 inhibitors | ✔ | ✔ |
| Hyperactivation of PARP1 | ✔ | ✔ |
| Impaired homologous recombination | ✔ | ✔ |
| Accumumation of R-loops | ✔ | ✔ |
| High expression of EZH2 | ✔ | ✔ |
Supplementary Material
Significantly enriched pathways obtained from classification based on Gene Ontology annotation of biological processes of genes that were differentially altered between Ewing sarcoma and IMR90 cells. a, Differentially upregulated processes in IMR90 but not Ewing sarcoma cells. b, Differentially downregulated processes in IMR90 but not Ewing sarcoma cells. c, Characteristic hallmarks of BRCA1-mutant breast cancers and whether these phenotypes are similarly observed in Ewing sarcoma.
Acknowledgements
We thank F. Chedin for the DRIP–seq protocol and genome-wide restriction enzyme sites file, and R. Crouch, J. Stark and Y. Shiio for plasmids. We are grateful to the UTH-SA/Cancer Center Sequencing core and the Histology & Immunohistochemistry Core at UTH-SA. This work was funded by the NIH (K22ES012264, 1R15ES019128, 1R01CA152063), a Voelcker Fund Young Investigator Award and CPRIT (RP150445) to A.J.R.B.; CPRIT (RP101491), a Translational Science Training Across Disciplines Scholarship (UTHSA) and an NCI postdoctoral training grant (T32CA148724) to A.G.; CPRIT (RP140105 to J.C.R.; NIH (P30CA054174) to University of Texas Health Cancer Center; NCI (R01CA204915) and Curing Kids Cancer to K.S; NIH CTSA (1UL1RR025767–01, P30CA054174) and CPRIT (RP120685-C2) to Y.C.; NIH (1R01CA140394) to S.L.L.; and NIH (1R01CA134605) to E.R.L.
Reviewer Information Nature thanks B. Braun and the other anonymous reviewer(s) for their contribution to the peer review of this work.
Footnotes
The authors declare no competing financial interests.
Readers are welcome to comment on the online version of the paper. Publisher’s note: Springer Nature remains neutral with regard to jurisdictional claims in published maps and institutional affiliations.
Supplementary Information is available in the online version of the paper.
Data availability
RNA-seq and DRIP–seq datasets have been deposited at the Gene Expression Omnibus (GEO) with accession code GSE68847. For gel source data, see Supplementary Fig. 1. All other data and are available from the corresponding author upon request.
Code availability
All custom Matlab codes are available from the corresponding author upon request.
References
- 1.Turc-Carel C, Philip I, Berger MP, Philip T & Lenoir GM Chromosome study of Ewing’s sarcoma (ES) cell lines. Consistency of a reciprocal translocation t(11;22)(q24;q12). Cancer Genet. Cytogenet. 12, 1–19 (1984). [DOI] [PubMed] [Google Scholar]
- 2.Paronetto MP Ewing sarcoma protein: a key player in human cancer. Int. J. Cell Biol. 2013, 642853 (2013). [DOI] [PMC free article] [PubMed] [Google Scholar]
- 3.Li H et al. Ewing sarcoma gene EWS is essential for meiosis and B lymphocyte development. J. Clin. Invest. 117, 1314–1323 (2007). [DOI] [PMC free article] [PubMed] [Google Scholar]
- 4.Yang W et al. Genomics of Drug Sensitivity in Cancer (GDSC): a resource for therapeutic biomarker discovery in cancer cells. Nucleic Acids Res. 41, D955–D961 (2013). [DOI] [PMC free article] [PubMed] [Google Scholar]
- 5.Kim N & Jinks-Robertson S Transcription as a source of genome instability. Nat. Rev. Genet. 13, 204–214 (2012). [DOI] [PMC free article] [PubMed] [Google Scholar]
- 6.Spahn L et al. Homotypic and heterotypic interactions of EWS, FLI1 and their oncogenic fusion protein. Oncogene 22, 6819–6829 (2003). [DOI] [PubMed] [Google Scholar]
- 7.Embree LJ, Azuma M & Hickstein DD Ewing sarcoma fusion protein EWSR1/FLI1 interacts with EWSR1 leading to mitotic defects in zebrafish embryos and human cell lines. Cancer Res. 69, 4363–4371 (2009). [DOI] [PMC free article] [PubMed] [Google Scholar]
- 8.Bertolotti A et al. EWS, but not EWS-FLI-1, is associated with both TFIID and RNA polymerase II: interactions between two members of the TET family, EWS and hTAFII68, and subunits of TFIID and RNA polymerase II complexes. Mol. Cell. Biol. 18, 1489–1497 (1998). [DOI] [PMC free article] [PubMed] [Google Scholar]
- 9.Yang L, Chansky HA & Hickstein DD EWS.Fli-1 fusion protein interacts with hyperphosphorylated RNA polymerase II and interferes with serine-arginine protein-mediated RNA splicing. J. Biol. Chem. 275, 37612–37618 (2000). [DOI] [PubMed] [Google Scholar]
- 10.Phatnani HP & Greenleaf AL Phosphorylation and functions of the RNA polymerase II CTD. Genes Dev. 20, 2922–2936 (2006). [DOI] [PubMed] [Google Scholar]
- 11.Schwartz JC et al. FUS binds the CTD of RNA polymerase II and regulates its phosphorylation at Ser2. Genes Dev. 26, 2690–2695 (2012). [DOI] [PMC free article] [PubMed] [Google Scholar]
- 12.Hill SJ et al. Systematic screening reveals a role for BRCA1 in the response to transcription-associated DNA damage. Genes Dev. 28, 1957–1975 (2014). [DOI] [PMC free article] [PubMed] [Google Scholar]
- 13.Aguilera A & García-Muse T R loops: from transcription byproducts to threats to genome stability. Mol. Cell 46, 115–124 (2012). [DOI] [PubMed] [Google Scholar]
- 14.Paronetto MP, Miñana B & Valcárcel J The Ewing sarcoma protein regulates DNA damage-induced alternative splicing. Mol. Cell 43, 353–368 (2011). [DOI] [PubMed] [Google Scholar]
- 15.Selvanathan SP et al. Oncogenic fusion protein EWS-FLI1 is a network hub that regulates alternative splicing. Proc. Natl Acad. Sci. USA 112, E1307–E1316 (2015). [DOI] [PMC free article] [PubMed] [Google Scholar]
- 16.Hamperl S & Cimprich KA The contribution of co-transcriptional RNA:DNA hybrid structures to DNA damage and genome instability. DNA Repair (Amst.) 19, 84–94 (2014). [DOI] [PMC free article] [PubMed] [Google Scholar]
- 17.Ginno PA, Lott PL, Christensen HC, Korf I & Chédin F R-loop formation is a distinctive characteristic of unmethylated human CpG island promoters. Mol. Cell 45, 814–825 (2012). [DOI] [PMC free article] [PubMed] [Google Scholar]
- 18.Riggi N et al. EWS-FLI1 utilizes divergent chromatin remodeling mechanisms to directly activate or repress enhancer elements in Ewing sarcoma. Cancer Cell 26, 668–681 (2014). [DOI] [PMC free article] [PubMed] [Google Scholar]
- 19.Nieto-Soler M et al. Efficacy of ATR inhibitors as single agents in Ewing sarcoma. Oncotarget 7, 58759–58767 (2016). [DOI] [PMC free article] [PubMed] [Google Scholar]
- 20.Brenner JC et al. PARP-1 inhibition as a targeted strategy to treat Ewing’s sarcoma. Cancer Res. 72, 1608–1613 (2012). [DOI] [PMC free article] [PubMed] [Google Scholar]
- 21.Zellweger R et al. Rad51-mediated replication fork reversal is a global response to genotoxic treatments in human cells. J. Cell Biol. 208, 563–579 (2015). [DOI] [PMC free article] [PubMed] [Google Scholar]
- 22.Pierce AJ, Johnson RD, Thompson LH & Jasin M XRCC3 promotes homology-directed repair of DNA damage in mammalian cells. Genes Dev. 13, 2633–2638 (1999). [DOI] [PMC free article] [PubMed] [Google Scholar]
- 23.Sankar S & Lessnick SL Promiscuous partnerships in Ewing’s sarcoma. Cancer Genet. 204, 351–365 (2011). [DOI] [PMC free article] [PubMed] [Google Scholar]
- 24.Bryant HE et al. Specific killing of BRCA2-deficient tumours with inhibitors of poly(ADP-ribose) polymerase. Nature 434, 913–917 (2005). [DOI] [PubMed] [Google Scholar]
- 25.Farmer H et al. Targeting the DNA repair defect in BRCA mutant cells as a therapeutic strategy. Nature 434, 917–921 (2005). [DOI] [PubMed] [Google Scholar]
- 26.Bouwman P et al. 53BP1 loss rescues BRCA1 deficiency and is associated with triple-negative and BRCA-mutated breast cancers. Nat. Struct. Mol. Biol. 17, 688–695 (2010). [DOI] [PMC free article] [PubMed] [Google Scholar]
- 27.Krum SA, Miranda GA, Lin C & Lane TF BRCA1 associates with processive RNA polymerase II. J. Biol. Chem. 278, 52012–52020 (2003). [DOI] [PubMed] [Google Scholar]
- 28.Hatchi E et al. BRCA1 recruitment to transcriptional pause sites is required for R-loop-driven DNA damage repair. Mol. Cell 57, 636–647 (2015). [DOI] [PMC free article] [PubMed] [Google Scholar]
- 29.Escribano-Díaz C et al. A cell cycle-dependent regulatory circuit composed of 53BP1-RIF1 and BRCA1-CtIP controls DNA repair pathway choice. Mol. Cell 49, 872–883 (2013). [DOI] [PubMed] [Google Scholar]
- 30.Riggi N, Cironi L, Suvà ML & Stamenkovic I Sarcomas: genetics, signalling, and cellular origins. Part 1: The fellowship of TET. J. Pathol. 213, 4–20 (2007). [DOI] [PubMed] [Google Scholar]
- 31.Suzuki Y et al. An upstream open reading frame and the context of the two AUG codons affect the abundance of mitochondrial and nuclear RNase H1. Mol. Cell. Biol. 30, 5123–5134 (2010). [DOI] [PMC free article] [PubMed] [Google Scholar]
- 32.Sanz LA et al. Prevalent, dynamic, and conserved R-loop structures associate with specific epigenomic signatures in mammals. Mol. Cell 63, 167–178 (2016). [DOI] [PMC free article] [PubMed] [Google Scholar]
- 33.Hu Y et al. PARP1-driven poly-ADP-ribosylation regulates BRCA1 function in homologous recombination-mediated DNA repair. Cancer Discov. 4, 1430–1447 (2014). [DOI] [PMC free article] [PubMed] [Google Scholar]
- 34.De Luca P et al. BRCA1 loss induces GADD153-mediated doxorubicin resistance in prostate cancer. Mol. Cancer Res. 9, 1078–1090 (2011). [DOI] [PMC free article] [PubMed] [Google Scholar]
- 35.Gorski JJ et al. Profiling of the BRCA1 transcriptome through microarray and ChIP-chip analysis. Nucleic Acids Res. 39, 9536–9548 (2011). [DOI] [PMC free article] [PubMed] [Google Scholar]
- 36.Wiles AM, Ravi D, Bhavani S & Bishop AJ An analysis of normalization methods for Drosophila RNAi genomic screens and development of a robust validation scheme. J. Biomol. Screen. 13, 777–784 (2008). [DOI] [PMC free article] [PubMed] [Google Scholar]
- 37.Ravi D et al. A network of conserved damage survival pathways revealed by a genomic RNAi screen. PLoS Genet. 5, e1000527 (2009). [DOI] [PMC free article] [PubMed] [Google Scholar]
- 38.Subramanian A et al. Gene set enrichment analysis: a knowledge-based approach for interpreting genome-wide expression profiles. Proc. Natl Acad. Sci. USA 102, 15545–15550 (2005). [DOI] [PMC free article] [PubMed] [Google Scholar]
- 39.Huang W, Sherman BT & Lempicki RA Systematic and integrative analysis of large gene lists using DAVID bioinformatics resources. Nat. Protocols 4, 44–57 (2009). [DOI] [PubMed] [Google Scholar]
- 40.Zhang Y et al. Model-based analysis of ChIP-Seq (MACS). Genome Biol. 9, R137 (2008). [DOI] [PMC free article] [PubMed] [Google Scholar]
- 41.Liu R et al. Computation tools for genome-wide R-loops identification and characterisation. Int. J. Comput. Biol. Drug Des. 10, 123–136 (2017). [Google Scholar]
Associated Data
This section collects any data citations, data availability statements, or supplementary materials included in this article.


