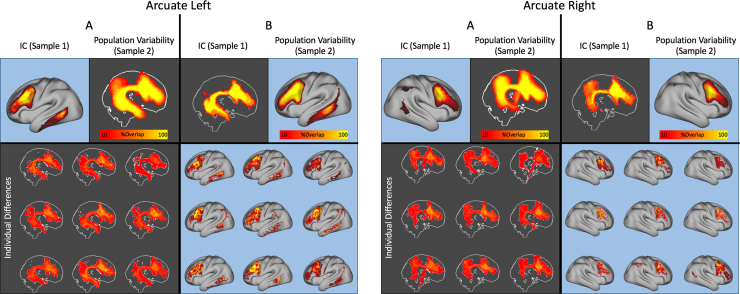
Fig. S3.
Supplementary Fig 3: Independent components corresponding to the arcuate fasciculi in the left and right hemisphere. For each hemisphere a regression of the cortical independent component (top left of each panels A) gives a consistent reconstruction of the arcuate fasciculus across 63 subjects in an independent sample (top right of panels A for population probability maps) and in 9 example subjects (bottom of panels A). Similarly, a regression of the white matter tractography pattern identified using ICA (top left of panels B) shows a reproducible cortical distribution (top right of panels B for population probability maps) and in 9 example subjects (bottom of panels B). Maps of individual datasets are shown after thresholding to the positive gamma distribution at p>0.5 as described in the Methods.

