

Abstract
Tumor necrosis factor (TNF) and its receptors TNF receptor type 1 (TNFR1) and type 2 (TNFR2) have a central role in chronic inflammatory diseases. While TNFR1 mainly confers inflammation, activation of TNFR2 elicits not only pro-inflammatory but also anti-inflammatory effects. In this study, we wanted to investigate the anti-inflammatory therapeutic potential of selective activation of TNFR2 in mice with established collagen-induced arthritis. Mice with established arthritis induced by immunization with bovine collagen type II were treated with six injections of the TNFR2-specific agonist TNCscTNF80, given every second day. Two days after treatment cessation, the cell compositions of bone marrow, spleen and lymph nodes were analyzed. Mice were visually scored until day 30 after the start of therapy and the degree of joint inflammation was determined by histology. Treatment with TNCscTNF80 increased arthritis-induced myelopoiesis. Little effect was seen on the infiltration rate of inflammatory immature myeloid cells and on the reduction of lymphoid cells in secondary lymphoid organs. Upon treatment, frequency of regulatory T (Treg) cells in the CD4+ T-cell population was increased in both spleen and inguinal lymph nodes. In addition, the expression of TNFR2 on Treg cells was enhanced. The clinical score started to improve 1 week after cessation treatment and remained lower 30 days after initiation of therapy. The histological score also revealed amelioration of joint inflammation in TNCscTNF80-treated versus control mice. Activation of TNFR2 might provide a suitable therapeutic strategy in autoimmune arthritis by increasing the numbers of regulatory cell types, in particular Treg cells, and by attenuation of arthritis.
Introduction
Rheumatoid arthritis (RA) is a chronic, immune-mediated inflammatory disease with erosive synovitis, which leads to destruction of cartilage and bone in the joints. The clinical symptoms are pain, stiffness and swelling of joints, deformity, ankylosis and loss of joint function accompanied by systemic manifestations especially in the cardiovascular system. The pathogenesis of RA is not fully elucidated. A complex interaction between genetic (HLA-DRB1 gene) and environmental factors (smoking, silica dust, high birth weight, alcohol, psychological stress in childhood) and repeated activation of the innate and adaptive immune system is considered.1,2 RA is a systemic disorder, in which pro-inflammatory cytokines such as interleukin (IL)-1β, IL-6, IL-17A, tumor necrosis factor (TNF) and interferon-γ (IFNγ) are critical mediators in the inflammatory process. This leads to a breakdown of the immune tolerance, aberrant autoantigen presentation and activation of T and B cells. Regulatory T (Treg) cells from patients with RA have been shown to display lower suppressive activity and are reduced in number from the very beginning of the disease.3
Anti-TNF therapy is an example for a therapeutic anti-inflammatory intervention in patients with RA with proven efficacy in the hospital.4,5 However, a number of experimental and clinical studies indicated adverse side effects and showed the need for a more specific immune-regulatory therapy.6 TNF receptor type 2 (TNFR2), which together with TNFR1 mediates the many effects of TNF, turned out to be a critical receptor, and it seemed to be a promising therapeutic strategy to target TNFR2 for promotion of Treg activity.7,8 This idea was supported by the observation that Treg cells with maximally suppressive activity express high levels of TNFR2 and are stabilized by TNFR2 activation.9,10
In addition, homogenous expansion of suppressive human Treg cells in vitro was found to be improved by targeting TNFR2.11,12 A second immunoregulatory cell type, namely myeloid-derived suppressor cells (MDSCs), might also contribute to anti-inflammatory effects of TNFR2 as MDSCs have been shown to require TNFR2 signaling for exerting optimal suppressive activity.13,14 Here we demonstrate that a specific TNFR2 agonist (TNCscTNF80), which consists of three single-chain encoded TNFR2-specific mouse TNF mutein domains that were connected by N-terminal fusion with the trimerization domain of tenascin-C and thus in total comprises nine TNF protomers, ameliorates established collagen-induced arthritis (CIA).15
Methods
Mice
Male DBA/1 mice (8 weeks of age, minimum body weight 23 g) were purchased from Janvier Labs (Le Genest-Saint-Isle, France). Mice were housed under standard laboratory conditions in the animal facility of the University of Regensburg and handled in accordance with institutional and governmental regulations for animal use (Approval of the specific mouse experiments by the Government of the Oberpfalz: Az. 55.2 DMS 2532-2-146). In total, 60 mice were used for the experiments. They were killed by cervical dislocation.
Reagents
For generation of the TNFR2-specific agonist a single-chain mouse TNF(D221N-A223R) DNA cassette encoding three mutated mouse TNF (aa 91–235) protomers colligated by (GGGS)4 peptide linkers was inserted 3′ to an Ig-leader Flag-TNC-encoding expression cassette to give rise to the TNC-scmTNF(221N/223R)(TNCscTNF80) plasmid as described recently.15 The TNCscTNF80 expression cassette was subcloned into pT2/SV-Neo. The latter was transiently transfected into HEK293 cells together with the Sleeping Beauty Transposon plasmid pCMV(CAT)T7-SB100 (Addgene, Cambridge, MA, USA, Mates et al. 16) to produce TNCscTNF80. TNCscTNF80 was purified from cell supernatants by affinity chromatography on anti-FlagM2 Agarose (Sigma, Deisenhofen, Germany) and elution with Flag-peptide (Sigma). After dialysis (Spectra/Por, Serva, Heidelberg, Germany), the protein concentration was determined by scanning a SyproRed (Invitrogen, Carlsbad, CA, USA) stained polyacrylamide gel (10% sodium dodecyl sulfate-polyacrylamide gel electrophoresis) with a scanner (Typhoon 9200, GE Health Care, Solingen, Germany) and quantifying the TNCscTNF80 band using a bovine serum albumin protein standard (Invitrogen) and the Image Quant TL 7.0 Analysis software (GE Health Care) (Figure 1a). Biological activity and specificity was routinely tested in a T-cell proliferation co-stimulator test: Carboxyfluorescein succinimidyl ester (eBioscience, Frankfurt, Germany) labeled spleen cells (2 × 10⁶ ml−1) were cultured with anti-CD3 (0.1 μg ml−1) with or without TNCscTNF80 (50 and 5 ng ml−1) for 72 h (Figure 1b). Proliferation of CD4+ and CD8+ T cells was quantified by fluorescence-activated cell sorting (FACS) analysis. Lipopolysaccharide contamination was excluded in control experiments with heat-inactivated TNCscTNF80. TNCscTNF80 exclusively and specifically binds to and activates TNFR2 but not TNFR1.15
Figure 1.
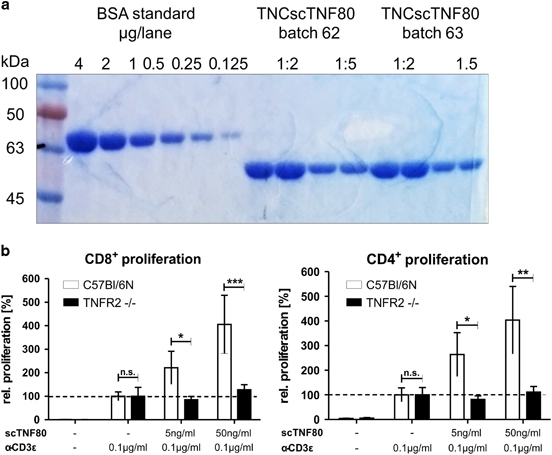
Purification and specificity of TNCscTNF80. (a) A representative picture of a Coomassie-stained PAGE is shown using a BSA standard and purified TNCscTNF80 preparations as samples. (b) A representative T-cell proliferation assay is shown with spleen cells from WT (open bars) and TNFR2-deficient (black bars) mice stimulated with or without graded amounts of purified TNCscTNF80. BSA, bovine serum albumin; PAGE, polyacrylamide gel electrophoresis; TNF, tumor necrosis factor; TNFR2, TNF receptor type 2; WT, wild type.
Cells
Single-cell suspensions from bone marrow of femurs, spleen and inguinal lymph nodes were prepared. Spleens and lymph nodes were carefully passed through a 40 μm cell strainer (BD Biosciences, Heidelberg, Germany), washed twice with phosphate-buffered saline (PBS)/1% fetal calf serum (FCS) and erythrocytes were lysed with hypertonic solution (0.17 M NH4Cl with 20 mM 4-(2-hydroxyethyl)-1-piperazineethanesulfonic acid). Viable spleen and lymph nodes cells were counted by trypan blue exclusion. For isolation of bone marrow cells, epicondyles were cut and diaphyses were flushed with 5 ml PBS/1% FCS. Bone marrow cells were counted by diluting them with Turk’s solution (Merck, Darmstadt, Germany).
Induction of CIA
Mice were immunized by subcutaneous injection of 100 μg of bovine type II collagen (2 mg ml−1; Chondrex, Seattle, WA, USA) emulsified in an equal volume of complete Freund adjuvant (Sigma), as described.17 When mice developed first signs of inflamed joints, clinical monitoring was started and continued every second day throughout until the end of the experiment. Mice reaching a clinical score of 10 (see next section) were treated by intraperitoneal injection six times every second day with 75 μg TNCscTNF80 in 300 μl PBS (treatment group) or diluent alone (control group), respectively. Two days after termination of the treatment, the cell composition of bone marrow, spleen and lymph nodes from TNCscTNF80-treated, control and healthy mice (n=3 each) were analyzed by FACS analysis. All other mice were followed up until day 30 after start of therapy.
Clinical assessment of joints
To measure the severity of arthritis and the impact of the TNCscTNF80 treatment on clinical signs of arthritis, each paw was evaluated every 2 days to check the progress of the disease. Depending on the degree of inflammation (erythema, swelling, open sores) 0–2.5 points were given to each joint of the four paws (with four toe joints, the midtarsal and the ankle joint each) amounting to a maximal clinical score of 60 (Bevaart et al. 17).
Histopathological assessment of joints
Extremities were fixed in 3.7% formalin for 24 h, washed in PBS, decalcified in 20% ethylenediaminetetraacetic acid and embedded in paraffin.17 Sections of the tarsometatarsal joints were stained with hematoxylin and eosin and evaluated in a completely blinded manner. We used a scoring system with a scale from 0 (normal) to 4 for the following categories: synovial inflammation, synovial hyperplasia, pannus formation and cartilage loss, and bone destruction. The average of all four paws yielded the histological score of one mouse.
Measurements of cytokines in serum and culture supernatants
The cytokines TNF, IL-6, IFNγ, IL-17 and C-X-C chemokine motif ligand 1 (CXCL1)/keratinocyte chemoattractant (KC) were quantified in the serum and supernatants of spleen and lymph node cells (2 × 10⁶ ml−1) cultured in the presence of concanavalin A (Sigma; 10 μg ml−1) for 24 h using the respective Duo Set enzyme-linked immunosorbent assay (R&D Systems, Minneapolis, MN, USA) according to the manufacturer’s instructions.
Fluorescence-activated cell sorter analysis
Single cells from the spleen, lymph nodes or bone marrow cells (106) were washed with PBS/1% FCS, and cell pellets were re-suspended in blocking solution (1 μg rat anti-mouse CD16/CD32 (Clone 2.4G2, BD Biosciences) in PBS/1% FCS) and labeled with tagged antibodies. The following monoclonal antibodies were used: cluster of differentiation 8–peridinin-chlorophyll proteins (CD8-PerCP; 53-6.7), CD11b-APC (allophycocyanin) (M1/70), B220-PerCP (RA3-6B2) from eBioscience; CD25-APC (PC 61), CD4-Pacific Blue (RM4-5), Ly6C-FITC (AL-21), Ly6G-Pacific Blue V450 (1A8), and CD120b (TNFR2)–phycoerythrin (TR-75/89) from BD Biosciences. The intracellular staining procedure for Treg cell detection was performed by using the forkhead box P3 (Foxp3)-FITC antibodies (FJK-16s) and the Foxp3 staining buffer set from eBiosciences. Cells were measured on a BD LSR-II cytometer and analyzed using the FACSDiva software (BD Biosciences). Living single cells were gated based on forward/sideward scatter properties and lymphoid and myeloid cell populations were gated according to their marker expression (Figure 2).
Figure 2.
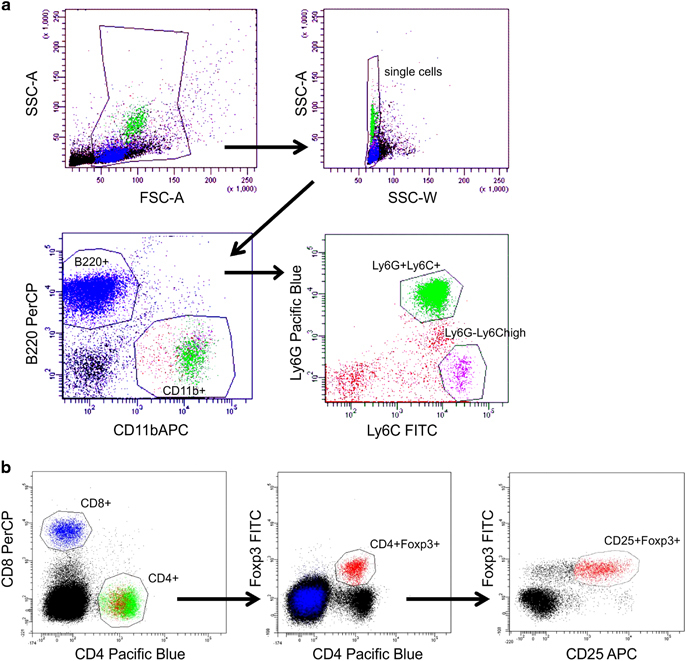
Gating strategies for flow cytometric analyses. (a) Living cells were gated based on FSC/SSC properties and lymphoid and myeloid cell populations were gated according to their expression of B220, CD11b, Ly6G and Ly6C. (b) Living cells were gated based on FSC/SSC properties and lymphoid cells were gated according to their expression of CD4, CD8, Foxp3 and CD25. APC, allophycocyanin; FITC, fluorescein isothiocyanate; FSC, forward scatter; SSC, side scatter.
Statistical analysis
Comparisons between scores of control and treatment group were carried out using the non-parametric Mann–Whitney U-test. Unpaired Student’s t-test or one-way analysis of variance with Bonferroni post hoc test were used in all other experiments with two or more experimental groups. P<0.05 was accepted as significantly different. Statistics were performed using GraphPad Prism 5.0 (GraphPad Software, La Jolla, CA, USA).
Results
TNFR2-agonistic treatment of mice with CIA
The model of CIA in DBA/1 mice4 was used to study the therapeutic effect of the TNFR2-agonistic biological TNCscTNF80 on established CIA. Previous explorative data had indicated that in mice with chronic inflammation Treg cells expanded already after a single injection of TNCscTNF80 (75 μg) (data not shown). To treat mice with established arthritis, however, we used the application scheme for TNCscTNF80 (6 × 75 μg of TNCscTNF80 every other day per mouse) as described recently.15 In the model of graft-versus-host disease, TNFR2-agonistic pretreatment induced no alteration of the myeloid compartment, reduced tissue damage and lowered pathological scores besides expanding Treg cells.15
Collagen-immunized mice developed first signs of joint inflammation with swelling, erythema and rigidity of the paws after about 20–25 days. Most mice reached a clinical score of 10 points (of 60 points maximum) on days 28–36 after immunization (mean time to reach score 10 was 31 days after immunization). After the start of observation, the body weight of mice in both groups stagnated—even with a tendency of weight loss in the TNCscTNF80-treated group—and animals started to gain weight again 1 week after cessation of treatment (Figure 3a).
Figure 3.
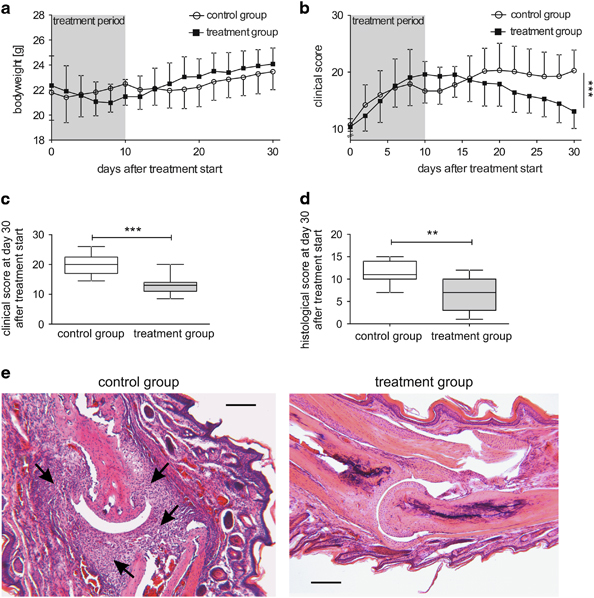
Kinetics of body weight and scores of CIA mice. (a) The body weight of mice that were either treated with TNCscTNF80 (75 μg per mouse, every second day, 6 times, treatment group) or with PBS (every second day, 6 times, control group) once they had reached a clinical score of 10 (n=14 mice per group, day 0) was determined every second day for 30 days. This experiment was performed twice. (b) The clinical score of the mice described in (a) was determined every second day for 30 days after treatment initiation. (c) The clinical score of TNCscTNF80-treated (treatment group, gray box) or PBS-treated (control group, open box) mice described in (a) was determined on day 30 after reaching a clinical score of 10 (Mann–Whitney U-test, P=0.0004). (d) The histological score of TNCscTNF80-treated (treatment group, gray box) or PBS-treated (control group, open box) mice described in (a) was determined on day 30 after reaching a clinical score of 10 (Mann–Whitney U-test, P=0.0069). (e) Representative histological sections are shown of either the control group (left side) or the treatment group (right side) stained with hematoxylin and eosin (Scale bar 200 μm). CIA, collagen-induced arthritis; PBS, phosphate-buffered saline.
In parallel, the clinical arthritis score rose continuously in both groups during the treatment (Figure 3b). An ameliorating effect of the TNFR2-agonistic treatment became evident only from 1 week after treatment cessation onwards: The clinical score of TNCscTNF80-treated mice started to decline while the clinical score of the control mice remained stable. Thirty days after the start of therapy, assessment of TNCscTNF80-treated mice showed amelioration of joint inflammation evident from a significantly improved clinical arthritis score (Figure 3c). This anti-inflammatory therapeutic effect was substantiated by the histopathological score documenting significant preservation of the joint structure in mice treated with the TNFR2 agonist as determined in a blinded way (Figure 3d). The differences between the TNCscTNF80 and control CIA mice is depicted by the representative histological sections of a joint (Figure 3e).
Parameters influenced by TNFR2-agonistic treatment
The sera of PBS- and TNCscTNF80-treated mice were analyzed on day 30 after treatment start to test whether mediators of inflammation had been influenced by the TNFR2-agonistic treatment. We used this particular time point because the clinical effects were maximum. Neither TNF nor IL-6 were detectable in the sera of mice from either group. Levels of the CXCL1/KC were found to be lower in the sera of TNCscTNF80-treated CIA mice compared with the controls (treatment: 438.3±7.4 pg ml−1; control: 505.3±6.1 pg ml−1; P=0.021). CXCL1 is a chemokine and activator of neutrophils induced by CIA, indicating recruitment of inflammatory neutrophils into the inflamed periphery.18,19
Thirty days after the treatment start, spleens of CIA mice presented with splenomegaly and enhanced cellularity compared with spleens of naive mice (spleen weight: 119.3±20.6 mg; spleen cells: 5.6±0.9 × 10⁷; lymph node cells: 1.2±0.5 × 10⁶). No difference between the two differently treated CIA mouse groups was seen concerning spleen weight (control: 155.7±48.4 mg; treatment: 145.5±39.4 mg) or cell numbers of spleens (control: 9.9±3.7 × 10⁷; treatment: 8.6±3.0 × 10⁷) and inguinal lymph nodes (control: 3.7±1.4 × 10⁶; treatment: 2.9±0.4 × 10⁶). Although a tendency toward reduced spleen weight and reduced lymphoid cellularity was noted in TNCscTNF80-treated mice, the difference did not reach statistical significance. In addition, activated spleen and lymph node cells from CIA mice of both groups secreted similar amounts of inflammatory cytokines such as TNF, IFNγ and IL-17A into the supernatant when tested 30 days after the start of treatment (Figure 4). IL-6 was not detectable in these supernatants.
Figure 4.
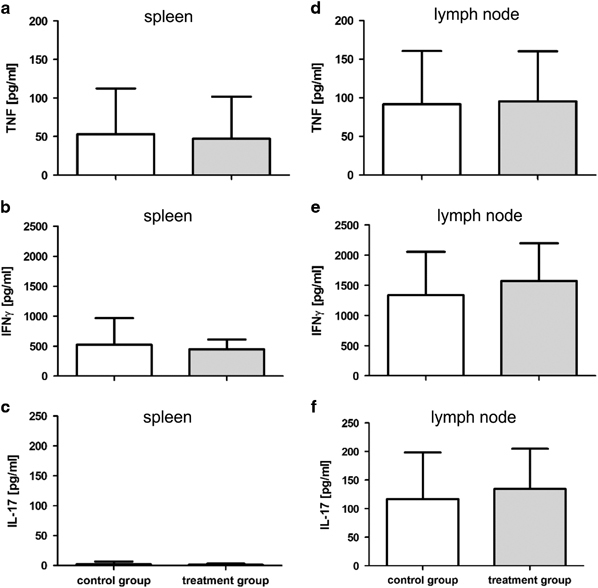
Cytokine production capacity from spleen and lymph node cells of CIA mice. Cytokine production of mice that were either treated with TNCscTNF80 (treatment group, gray bar) or with PBS (control group, open bar) was determined 30 days after they had reached a clinical score of 10 (n=11 mice per group, day 30 after treatment start). Concentrations of TNF, IFNγ and IL-17A from (a–c) activated spleen cells and (d–f) from inguinal lymph node cells were determined in the supernatant. CIA, collagen-induced arthritis; IFN, interferon; IL, interleukin; PBS, phosphate-buffered saline; TNF, tumor necrosis factor.
Cell composition of lymphoid organs influenced by TNFR2-agonistic treatment
The composition of bone marrow, spleen and inguinal lymph node cells was analyzed by flow cytometric analysis 2 days after cessation of therapy in order to monitor therapy-induced cellular shifts in the lymphoid organs. An increase in the frequency of CD11b-positive cells in the bone marrow indicated myelopoiesis induced by CIA, which was enforced by treatment with TNCscTNF80 (Figure 5a). The expansion of the myeloid bone marrow cell population on day 2 after treatment cessation was accompanied by a reduction of the B-cell numbers in controls but particularly in TNCscTNF80-treated animals (Figure 5b).
Figure 5.
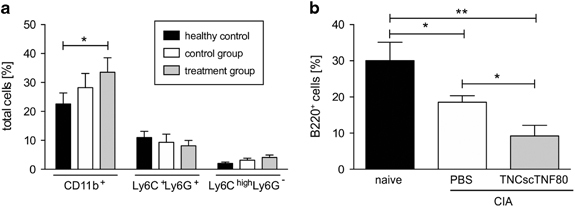
Myeloid and B-cell subpopulations of bone marrow from CIA mice. (a) Percentages of CD11b+ myeloid cells, CD11b+ Ly6C+Ly6G+ PMN-MDSC and CD11b+Ly6ChighLy6G− MO-MDSC subpopulations from the bone marrow of naive (black bars) or CIA mice after treatment with TNCscTNF80 (treatment group, gray bars) or with PBS (control group, open bars) (n=3 mice per group) on day 2 after treatment cessation. This experiment was performed once. (b) Percentages of B220+ B cells from the bone marrow as in (a). Statistics were made using the one-way ANOVA test. ANOVA, analysis of variance; CIA, collagen-induced arthritis; MO-MDSC, mononuclear myeloid-derived suppressor cell; PBS, phosphate-buffered saline; PMN-MDSC, polymorphonuclear myeloid-derived suppressor cell.
In the spleens and inguinal lymph nodes of mice with established CIA, increased numbers of myeloid cells were also noticed 2 days after the end of therapy, but it did not reach statistical significance in these two organs (Tables 1 and 2). Immature myeloid cells in the spleen were identified and further distinguished by the markers Ly6G and Ly6C (Table 1). Although a rise of Ly6Chigh Ly6G− cells was observed in animals with CIA with/without therapy, it was only significant for the PBS-treated CIA group (Table 1).
Table 1.
Spleen cell numbers of naive, PBS- or TNCscTNF80-treated CIA mice
| Spleen cells | Naive mice | CIA PBS treated | CIA TNCscTNF80 treated |
|---|---|---|---|
| Mean±s.d. | |||
| CD4+ (106) | 8.4±0.4 | 8.0±4.2 | 6.7±1.2 |
| CD8+ (106) | 3.5±0.3 | 3.8±2.4 | 3.4±0.2 |
| B220+ (106) | 32.2±2.4 | 32.4±17.0 | 24.5±2.7* |
| Treg CD4+Foxp3+ (105) | 9.7±0.8 | 12.0±6.6 | 13.2±1.1* |
| Treg CD4+CD25+Foxp3+ (105) | 6.4±0.9 | 7.5±4.4 | 7.8±0.5* |
| CD11b+ (106) | 3.9±0.4 | 8.4±3.2 | 9.6±3.9 |
| Ly6C+ Ly6G+ (106) | 1.4±0.4 | 5.3±1.5 | 6.0±2.4 |
| Ly6Chigh Ly6G− (105) | 2.2±0.2 | 4.8±0.5* | 10.4±5.2 |
Abbreviations: CIA, collagen-induced arthritis; PBS, phosphate-buffered saline; Treg, regulatory T. Spleen cell numbers were determined on day 2 after cessation of treatment (n=3 mice per group; *P⩽0.05 compared with naive mice, Student’s t-Test).
Table 2.
Lymph node cell numbers of naive or PBS- or TNCscTNF80-treated CIA mice
| Lymph node cells | Naive mice | CIA PBS treated | CIA TNCscTNF80 treated |
|---|---|---|---|
| Mean±s.d. | |||
| CD4+ (105) | 5.3±0.4 | 6.4±2.9 | 7.8±0.7* |
| CD8+ (105) | 3.4±1.1 | 4.2±2.2 | 5.7±1.0 |
| B220+ (105) | 4.2±2.4 | 11.2±3.7 | 11.6±4.1 |
| Treg (104) CD4+Foxp3+ | 4.3±1.9 | 6.7±3.3 | 10.1±1.1 |
| Treg (104) CD4+CD25+Foxp3+ | 3.8±1.8 | 5.9±3.0 | 8.8±0.8 |
| CD11b+ (104) | 1.3±0.5 | 3.6±0.6 | 2.9±0.4 |
Abbreviations: CIA, collagen-induced arthritis; PBS, phosphate-buffered saline; Treg, regulatory T. Cell numbers from inguinal lymph nodes were determined on day 2 after cessation of treatment (n=3 mice per group; *P⩽0.05 compared with naive mice, Student’s T-test).
The fraction of splenic T cells was significantly reduced concerning both the CD4+ and the CD8+ subpopulation in CIA mice on day 2 after treatment cessation (Figure 6a, Table 1 shows absolute values). In the spleen, B-cell fractions were slightly lowered from 53.2±0.4% in naive mice to 44.5±18.7% in PBS-treated and 30.6±5.3% in TNCscTNF80-treated CIA mice (Table 1 shows absolute values). However, the numbers and frequency of Treg cells in the CD4-positive T-cell fraction tended to be increased in untreated CIA mice compared with naive mice independent of whether the gate was set to Foxp3+ or to CD25+Foxp3+ Treg cells (Figure 6a, Table 1 shows absolute values). On top, TNCscTNF80 treatment had an additional significant enhancing effect on the expansion of Treg cells in the spleen (Figure 6a, Table 1 shows absolute values). The splenic CD4+ T and Treg cells, respectively, from mice treated with the TNFR2-specific agonist expressed the highest levels of TNFR2 (Figure 6b), which is interpreted as an activation-induced upregulation of this particular receptor.
Figure 6.
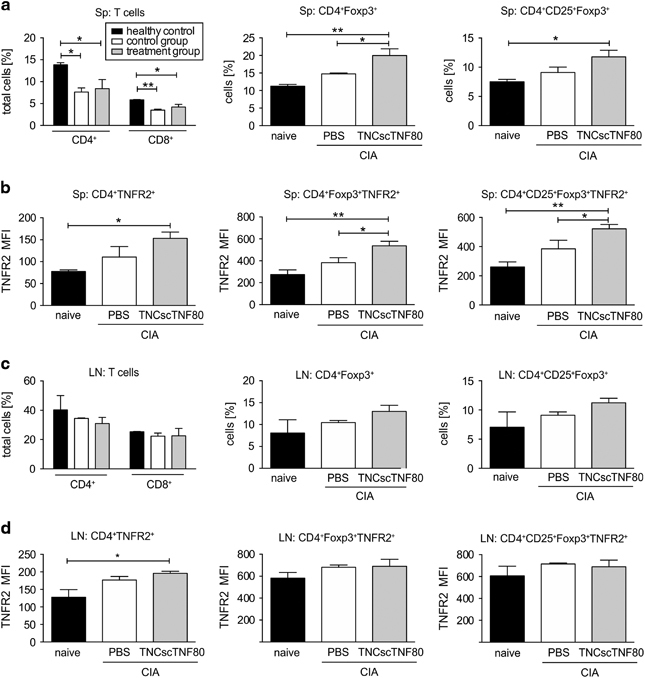
T-cell subpopulations of the spleens and lymph nodes from CIA mice. (a) Percentages of CD4+ and CD8+ T, CD4+Foxp3+ Treg and CD4+ CD25+Foxp3+ Treg cells were determined from the spleens (Sp) of naive (black bar) or CIA mice 2 days after treatment cessation with TNCscTNF80 (treatment group, gray bar) or with PBS (control group, open bar) (n=3 mice per group) after reaching a clinical score of 10. (b) Mean fluorescence intensity (MFI) of TNFR2 expression of the same cells as in (a) was determined. (c) Percentages of CD4+ and CD8+ T, CD4+Foxp3+ Treg and CD4+ CD25+Foxp3+ Treg cells from inguinal lymph nodes (LN) of the same mice as in (a) were determined. (d) MFI of TNFR2 expression on the same cells as in (c) was determined. Statistics were made using the one-way ANOVA test. ANOVA, analysis of variance; CIA, collagen-induced arthritis; PBS, phosphate-buffered saline; TNFR2, tumor necrosis factor receptor type 2; Treg, regulatory T.
In inguinal lymph nodes, on day 2 after treatment cessation, Treg cell expansion upon TNCscTNF80 treatment was also observed in the CD4+ T-cell population, but this did not reach the significance level (Figure 6c, Table 2 shows absolute values). Concerning TNFR2 expression in the inguinal lymph nodes, similar but weaker effects were observed for CD4+ T cells and Treg cells (Figure 6d).
Discussion
A number of studies in humans and mice suggested that activation of TNFR2 is a practicable approach to induce T-cell suppression. In addition, recently published data show that pretreatment with the TNFR2-selective agonist TNCscTNF80 generated by us induces the expansion of Treg cells and inhibits graft-versus-host disease in an experimental mouse model.15 The analysis of TNCscTNF80 therapy in mice with established CIA shown here demonstrates additional effects of TNFR2-agonistic treatment in mice with chronic inflammation.
One of the earliest described TNFR2-specific functions is the transmission of a co-stimulatory signal to activate the T-cell receptor.20 This TNFR2-specific function might provide the underlying mechanism for the activation of Treg cells by TNF by reducing the signaling strength required for T-cell receptor activation. Besides lowering the threshold for activation of Treg cells, TNFR2 has been shown—together with the other TNF receptor family members GITR, CD27 and OX40—to promote Treg cell development and to shape the Treg cell repertoire in the thymus.21,22 In addition, activation of TNFR2 stabilizes the differentiation status of Treg cells10 and supports the expansion of a homogeneous Treg cell population with suppressive activity.11,12 The data shown here demonstrate that agonistic TNFR2-treatment affects Treg cells and might enhance their suppressive activity considering TNFR2 expression levels to correlate with suppressive activity.9 These effects fully concur with the recently published findings in a different setting by Chopra et al. 15
In the myeloid cell population, immature myeloid cells were identified and further distinguished by the markers Ly6G and Ly6C. They mainly consisted of the immature granulocytic (Ly6G+Ly6Cint) and the monocytic (Ly6G−Ly6Chigh) cell type. Owing to the T-cell-suppressive capacity of the latter, they have been described as MDSCs.23,24 MDSCs have been reported to show potent innate immune effector functions and, according to the concept of ‘emergency myelopoiesis’, are suggested to promote increased innate immune surveillance during periods of systemic insult.25 TNFR2 signaling has been reported to promote accumulation and survival of such MDSCs in cancer models and to be required for optimal suppressive function.26 The tendency of TNCscTNF80 treatment to foster both myelopoiesis and contraction of the lymphocyte compartment might hint to an additional pro-inflammatory stimulus provided by the TNFR2 agonist as already indicated by the mild loss of body weight during treatment. The role of MDSCs in models of RA are conflicting, so far. Although MDSC-dependent expansion of T helper type 17 cell differentiation in CIA has also been found to correlate with increased severity of arthritis,27 beneficial effects by transfer of MDSCs has also been seen.14 MDSC ameliorated CIA pathology by inhibiting T- and B-cell functions.28 A shift from potently suppressive MDSCs to poorly suppressive MDSCs during CIA might be one explanation for such controversial effects of MDSCs observed.29 Recently, monocyte-derived inflammatory cells were identified in the synovium in patients with rheumatoid arthritis.30 However, no hemodynamic changes or systemic toxicity were seen in an earlier study with administration of a TNFR2-agonistic TNF trimer to healthy baboons performed to dissect pro-inflammatory from other immunological TNF effects.31 Only a transient infiltration of mononuclear cells was described after intradermal administration, indicating a local inflammatory reaction. Of note in the study described here, significantly enhanced frequency of MDSCs induced by TNCscTNF80 was only observed in the bone marrow (Figure 5a) and was not significant in the spleens or inguinal lymph nodes (Tables 1 and 2). In addition, the expression of TNFR2 was found on immature myeloid cells in the spleen of naive mice; the expression level was enhanced in CIA mice and did not significantly change during TNCscTNF80 therapy. This might be explained by the lower neutrophil activity as judged by lower serum levels of CXCL1 in the group that had received the TNFR2 agonist. Thus TNFR2-agonistic treatment did not promote enhanced inflammation in the periphery of the mice with CIA, and the finding of slightly increased the numbers of MDSCs in the spleens of CIA mice after treatment with TNFR2 agonist did not seem to impede the therapeutic effect.
On the other side,11,12 a number of reports show that TNF enhances the suppressor activity of MDSCs and increases the number and function of Treg cells via activation of TNFR2.32,33,34 With respect to the above noted myelopoiesis induced by CIA, it has previously been observed in cancer models that accumulating MDSCs mediate the development of Foxp3+ Treg cells.35 The therapy with TNCscTNF80 might, therefore, indirectly activate the Treg cell population and increase their suppressive activity. A clue to the molecular interactions was provided by a recent publication demonstrating close interaction of membrane TNF expressed on myeloid cells from patients with RA treated with therapeutic anti-TNF antibodies to activate TNFR2 on Treg cells and thus foster their suppressive activity.36 Furthermore, it has been reported that the induction of antigen-specific peripheral immune tolerance in CIA by injecting collagen type II in the immune-privileged site of the anterior eye chamber resulted in generation of Treg cells mediated via suppressive macrophages.37 Whether such a Treg cell inducing mechanism via interaction with suppressive myeloid cells also underlies the therapeutic scheme of specific TNFR2 activation remains to be tested, for example, by the use of mice with cell-type-specific deletion of TNFR2. Thus the interaction between TNF and functionally active suppressor cells, such as MDSCs and Treg cells, seems to have a critical role in patients with chronic inflammation exerting seemingly paradoxical effects: TNF is a prototypical inflammatory mediator while, at the same time, it supports the resolution of inflammation. However, also reduction of the suppressive activity of Treg cells by TNF has been observed,38,39 and this effect has also been attributed to the activation of TNFR2.40
Conclusions
The complex and seemingly conflicting consequences of TNFR2 signaling might reflect the result of a well-controlled counterbalance of inflammation provided by the TNF system: TNFR2 activation promotes suppressor cell populations induced by the inflammatory immune response to dampen the inflammation. However, prolonged exposure to membrane-bound endogenous TNF acting on TNFR2—as in patients with chronic inflammation or tumors—may in turn exert an inhibitory effect on the suppressive activity of these regulatory cells. Thus it remains to be analyzed whether Treg cells after long-term treatment with the TNFR2 agonist maintain their suppressive activity.
Clearly, treatment of CIA with the TNFR2 agonist TNCscTNF80 seems a promising strategy by the expansion of Treg cells. A possible effect of the TNFR2 agonist on immature myeloid cells seems to have a minor role as shown in this study. However, as long as kinetics and circumstances are unclear under which activation of TNFR2 disables or potentiates Treg cell functions besides expanding them in numbers, careful consideration of an optimized therapeutic application scheme is required in order to avoid a potential inhibitory effect on the Treg cell function by overexposing regulatory cells to the TNFR2 agonist.
Ethics approval
Approval of the specific mouse experiments was provided by the Government of the Oberpfalz: Az. 55.2 DMS 2532-2-146.
Availability of data and material
The data sets used and/or analyzed during the current study are available from the corresponding author on reasonable request.
Acknowledgements
We thank B Echtenacher for help with the animal experimentation and Melanie Werner-Klein for help with the figures for the manuscript. Part of the work has been funded by the Deutsche Forschungsgemeinschaft with grants to RHS (STR 511/32-1) and HW (WA 1025/31-1). Additionally, the work has been funded by the respective institutions.
Author contributions
VM, TS, DW-S, DZ and ZJ-L generated data on collagen type II-induced arthritis and respective parameters thereof. HW generated the TNCscTNF80 construct. RHS and DNM analyzed and interpreted the data. All authors contributed to figures and the draft manuscript. All authors read and approved the final manuscript.
Conflict of interest
The authors declare no conflict of interest.
References
- 1.Picerno V, Ferro F, Adinolfi A, Valentini E, Tani C, Alunno A. One year in review: the pathogenesis of rheumatoid arthritis. Clin Exp Rheumatol. 2015;33:551–558. [PubMed] [Google Scholar]
- 2.Parks CG, D'Aloisio AA, DeRoo LA, Huiber K, Rider LG, Miller FW, et al. Childhood socioeconomic factors and perinatal characteristics influence development of rheumatoid arthritis in adulthood. Ann Rheum Dis. 2013;72:350–356. doi: 10.1136/annrheumdis-2011-201083. [DOI] [PMC free article] [PubMed] [Google Scholar]
- 3.Byng-Maddick R, Ehrenstein MR. The impact of biological therapy on regulatory T cells in rheumatoid arthritis. Rheumatology (Oxford) 2015;54:768–775. doi: 10.1093/rheumatology/keu487. [DOI] [PubMed] [Google Scholar]
- 4.Williams RO. Collagen-induced arthritis in mice: a major role for tumor necrosis factor-alpha. Methods Mol Biol. 2007;361:265–284. doi: 10.1385/1-59745-208-4:265. [DOI] [PubMed] [Google Scholar]
- 5.Monaco C, Nanchahal J, Taylor P, Feldmann M. Anti-TNF therapy: past, present and future. Int Immunol. 2015;27:55–62. doi: 10.1093/intimm/dxu102. [DOI] [PMC free article] [PubMed] [Google Scholar]
- 6.Faustman D, Davis M. TNF receptor 2 pathway: drug target for autoimmune diseases. Nat Rev Drug Discov. 2010;9:482–493. doi: 10.1038/nrd3030. [DOI] [PubMed] [Google Scholar]
- 7.Chen X, Baumel M, Mannel DN, Howard OM, Oppenheim JJ. Interaction of TNF with TNF receptor type 2 promotes expansion and function of mouse CD4+CD25+ T regulatory cells. J Immunol. 2007;179:154–161. doi: 10.4049/jimmunol.179.1.154. [DOI] [PubMed] [Google Scholar]
- 8.Faustman DL, Davis M. TNF receptor 2 and disease: autoimmunity and regenerative medicine. Front Immunol. 2013;4:478. doi: 10.3389/fimmu.2013.00478. [DOI] [PMC free article] [PubMed] [Google Scholar]
- 9.Chen X, Subleski JJ, Kopf H, Howard OM, Mannel DN, Oppenheim JJ. Cutting edge: expression of TNFR2 defines a maximally suppressive subset of mouse CD4+CD25+FoxP3+ T regulatory cells: applicability to tumor-infiltrating T regulatory cells. J Immunol. 2008;180:6467–6471. doi: 10.4049/jimmunol.180.10.6467. [DOI] [PMC free article] [PubMed] [Google Scholar]
- 10.Chen X, Wu X, Zhou Q, Howard OM, Netea MG, Oppenheim JJ. TNFR2 is critical for the stabilization of the CD4+Foxp3+ regulatory T cell phenotype in the inflammatory environment. J Immunol. 2013;190:1076–1084. doi: 10.4049/jimmunol.1202659. [DOI] [PMC free article] [PubMed] [Google Scholar]
- 11.Okubo Y, Mera T, Wang L, Faustman DL. Homogeneous expansion of human T-regulatory cells via tumor necrosis factor receptor 2. Sci Rep. 2013;3:3153. doi: 10.1038/srep03153. [DOI] [PMC free article] [PubMed] [Google Scholar]
- 12.He X, Landman S, Bauland SC, van den Dolder J, Koenen HJ, Joosten I. A TNFR2-agonist facilitates high purity expansion of human low purity treg cells. PLoS One. 2016;11:e0156311. doi: 10.1371/journal.pone.0156311. [DOI] [PMC free article] [PubMed] [Google Scholar]
- 13.Polz J, Remke A, Weber S, Schmidt D, Weber-Steffens D, Pietryga-Krieger A, et al. Myeloid suppressor cells require membrane TNFR2 expression for suppressive activity. Immun Inflamm Dis. 2014;2:121–130. doi: 10.1002/iid3.19. [DOI] [PMC free article] [PubMed] [Google Scholar]
- 14.Zhang L, Zhang Z, Zhang H, Wu M, Wang Y. Myeloid-derived suppressor cells protect mouse models from autoimmune arthritis via controlling inflammatory response. Inflammation. 2014;37:670–677. doi: 10.1007/s10753-013-9783-z. [DOI] [PubMed] [Google Scholar]
- 15.Chopra M, Biehl M, Steinfatt T, Brandl A, Kums J, Amich J, et al. Exogenous TNFR2 activation protects from acute GvHD via host T reg cell expansion. J Exp Med. 2016;213:1881–1900. doi: 10.1084/jem.20151563. [DOI] [PMC free article] [PubMed] [Google Scholar]
- 16.Mates L, Chuah MK, Belay E, Jerchow B, Manoj N, Acosta-Sanchez A, et al. Molecular evolution of a novel hyperactive Sleeping Beauty transposase enables robust stable gene transfer in vertebrates. Nat Genet. 2009;41:753–761. doi: 10.1038/ng.343. [DOI] [PubMed] [Google Scholar]
- 17.Bevaart L, Vervoordeldonk MJ, Tak PP. Collagen-induced arthritis in mice. Methods Mol Biol. 2010;602:181–192. doi: 10.1007/978-1-60761-058-8_11. [DOI] [PubMed] [Google Scholar]
- 18.Bozic CR, Gerard NP, von Uexkull-Guldenband C, Kolakowski JrLF, Conklyn MJ, Breslow R, et al. The murine interleukin 8 type B receptor homologue and its ligands. Expression and biological characterization. J Biol Chem. 1994;269:29355–29358. [PubMed] [Google Scholar]
- 19.Ohmori Y, Wyner L, Narumi S, Armstrong D, Stoler M, Hamilton TA. Tumor necrosis factor-alpha induces cell type and tissue-specific expression of chemoattractant cytokines in vivo. Am J Pathol. 1993;142:861–870. [PMC free article] [PubMed] [Google Scholar]
- 20.Kim EY, Priatel JJ, Teh SJ, Teh HS. TNF receptor type 2 (p75) functions as a costimulator for antigen-driven T cell responses in vivo. J Immunol. 2006;176:1026–1035. doi: 10.4049/jimmunol.176.2.1026. [DOI] [PubMed] [Google Scholar]
- 21.Coquet JM, Ribot JC, Babala N, Middendorp S, van der Horst G, Xiao Y, et al. Epithelial and dendritic cells in the thymic medulla promote CD4+Foxp3+ regulatory T cell development via the CD27-CD70 pathway. J Exp Med. 2013;210:715–728. doi: 10.1084/jem.20112061. [DOI] [PMC free article] [PubMed] [Google Scholar]
- 22.Mahmud SA, Manlove LS, Schmitz HM, Xing Y, Wang Y, Owen DL, et al. Costimulation via the tumor-necrosis factor receptor superfamily couples TCR signal strength to the thymic differentiation of regulatory T cells. Nat Immunol. 2014;15:473–481. doi: 10.1038/ni.2849. [DOI] [PMC free article] [PubMed] [Google Scholar]
- 23.Movahedi K, Guilliams M, Van den Bossche J, Van den Bergh R, Gysemans C, Beschin A, et al. Identification of discrete tumor-induced myeloid-derived suppressor cell subpopulations with distinct T cell-suppressive activity. Blood. 2008;111:4233–4244. doi: 10.1182/blood-2007-07-099226. [DOI] [PubMed] [Google Scholar]
- 24.Youn JI, Collazo M, Shalova IN, Biswas SK, Gabrilovich DI. Characterization of the nature of granulocytic myeloid-derived suppressor cells in tumor-bearing mice. J Leukoc Biol. 2012;91:167–181. doi: 10.1189/jlb.0311177. [DOI] [PMC free article] [PubMed] [Google Scholar]
- 25.Cuenca AG, Delano MJ, Kelly-Scumpia KM, Moreno C, Scumpia PO, Laface DM, et al. A paradoxical role for myeloid-derived suppressor cells in sepsis and trauma. Mol Med. 2011;17:281–292. doi: 10.2119/molmed.2010.00178. [DOI] [PMC free article] [PubMed] [Google Scholar]
- 26.Zhao X, Rong L, Zhao X, Li X, Liu X, Deng J, et al. TNF signaling drives myeloid-derived suppressor cell accumulation. J Clin Invest. 2012;122:4094–4104. doi: 10.1172/JCI64115. [DOI] [PMC free article] [PubMed] [Google Scholar]
- 27.Zhang H, Wang S, Huang Y, Wang H, Zhao J, Gaskin F, et al. Myeloid-derived suppressor cells are proinflammatory and regulate collagen-induced arthritis through manipulating Th17 cell differentiation. Clin Immunol. 2015;157:175–186. doi: 10.1016/j.clim.2015.02.001. [DOI] [PMC free article] [PubMed] [Google Scholar]
- 28.Crook KR, Jin M, Weeks MF, Rampersad RR, Baldi RM, Glekas AS, et al. Myeloid-derived suppressor cells regulate T cell and B cell responses during autoimmune disease. J Leukoc Biol. 2015;97:573–582. doi: 10.1189/jlb.4A0314-139R. [DOI] [PMC free article] [PubMed] [Google Scholar]
- 29.Wang W, Jiao Z, Duan T, Liu M, Zhu B, Zhang Y, et al. Functional characterization of myeloid-derived suppressor cell subpopulations during the development of experimental arthritis. Eur J Immunol. 2015;45:464–473. doi: 10.1002/eji.201444799. [DOI] [PubMed] [Google Scholar]
- 30.Reynolds G, Gibbon JR, Pratt AG, Wood MJ, Coady D, Raftery G, et al. Synovial CD4+ T-cell-derived GM-CSF supports the differentiation of an inflammatory dendritic cell population in rheumatoid arthritis. Ann Rheum Dis. 2016;75:899–907. doi: 10.1136/annrheumdis-2014-206578. [DOI] [PMC free article] [PubMed] [Google Scholar]
- 31.Welborn MB, III, Van Zee K, Edwards PD, Pruitt JH, Kaibara A, Vauthey JN, et al. A human tumor necrosis factor p75 receptor agonist stimulates in vitro T cell proliferation but does not produce inflammation or shock in the baboon. J Exp Med. 1996;184:165–171. doi: 10.1084/jem.184.1.165. [DOI] [PMC free article] [PubMed] [Google Scholar]
- 32.Hu X, Li B, Li X, Zhao X, Wan L, Lin G, et al. Transmembrane TNF-alpha promotes suppressive activities of myeloid-derived suppressor cells via TNFR2. J Immunol. 2014;192:1320–1331. doi: 10.4049/jimmunol.1203195. [DOI] [PubMed] [Google Scholar]
- 33.Biton J, Semerano L, Delavallee L, Lemeiter D, Laborie M, Grouard-Vogel G, et al. Interplay between TNF and regulatory T cells in a TNF-driven murine model of arthritis. J Immunol. 2011;186:3899–3910. doi: 10.4049/jimmunol.1003372. [DOI] [PubMed] [Google Scholar]
- 34.Boschetti G, Nancey S, Sardi F, Roblin X, Flourie B, Kaiserlian D. Therapy with anti-TNFalpha antibody enhances number and function of Foxp3(+) regulatory T cells in inflammatory bowel diseases. Inflamm Bowel Dis. 2011;17:160–170. doi: 10.1002/ibd.21308. [DOI] [PubMed] [Google Scholar]
- 35.Huang B, Pan PY, Li Q, Sato AI, Levy DE, Bromberg J, et al. Gr-1+CD115+ immature myeloid suppressor cells mediate the development of tumor-induced T regulatory cells and T-cell anergy in tumor-bearing host. Cancer Res. 2006;66:1123–1131. doi: 10.1158/0008-5472.CAN-05-1299. [DOI] [PubMed] [Google Scholar]
- 36.Nguyen DX, Ehrenstein MR. Anti-TNF drives regulatory T cell expansion by paradoxically promoting membrane TNF-TNF-RII binding in rheumatoid arthritis. J Exp Med. 2016;213:1241–1253. doi: 10.1084/jem.20151255. [DOI] [PMC free article] [PubMed] [Google Scholar]
- 37.Farooq SM, Kumar A, Ashour HM. Eye-mediated immune tolerance to type II collagen in arthritis-prone strains of mice. J Cell Mol Med. 2014;18:2512–2518. doi: 10.1111/jcmm.12376. [DOI] [PMC free article] [PubMed] [Google Scholar]
- 38.Nagar M, Jacob-Hirsch J, Vernitsky H, Berkun Y, Ben-Horin S, Amariglio N, et al. TNF activates a NF-kappaB-regulated cellular program in human CD45RA- regulatory T cells that modulates their suppressive function. J Immunol. 2010;184:3570–3581. doi: 10.4049/jimmunol.0902070. [DOI] [PubMed] [Google Scholar]
- 39.Nie H, Zheng Y, Li R, Guo TB, He D, Fang L, et al. Phosphorylation of FOXP3 controls regulatory T cell function and is inhibited by TNF-alpha in rheumatoid arthritis. Nat Med. 2013;19:322–328. doi: 10.1038/nm.3085. [DOI] [PubMed] [Google Scholar]
- 40.Valencia X, Stephens G, Goldbach-Mansky R, Wilson M, Shevach EM, Lipsky PE. TNF downmodulates the function of human CD4+CD25hi T-regulatory cells. Blood. 2006;108:253–261. doi: 10.1182/blood-2005-11-4567. [DOI] [PMC free article] [PubMed] [Google Scholar]
Associated Data
This section collects any data citations, data availability statements, or supplementary materials included in this article.
Data Availability Statement
The data sets used and/or analyzed during the current study are available from the corresponding author on reasonable request.