

Abstract
Background:
Beta-hydroxybutyrate (BHB) as a ketone body is the metabolic fuel in oxidative phosphorylation pathway. So far the effects of BHB on the biology of tumor cells is contradictory. Therefore, we investigated the effect of BHB on viability, metabolism, proliferation and migration of 5FU treated SW480 colon cancer cell line.
Methods:
we treated the SW480 cells with IC50 dose of 5-fluorouracil (5FU) for 72 h to isolate a subpopulation of 5FU treated cells that were resistant to it. Effects of BHB on cell viability was investigated by MTT assay. Measurement of oxygen consumption rate (OCR) in parallel with extracellular acidification rate (ECAR) upon BHB treatment was used for determination of metabolic profile of these cells. Investigating the relationship between metabolic phenotype and the status of differentiation and stemness was done by analyzing the expression of PGC-1α, c-MYC, NANOG, ALPi and KRT20 genes by qRT-PCR. Clonogenic and scratch assay were performed to determine the proliferation and migration abilities of incubated with BHB compared to untreated cells.
Results:
BHB increased cell viability in SW480 and 5FU treated SW480 cells. The results showed a significantly decreased ECAR and increased OCR in both cell types following BHB treatment reflecting the superiority of oxidative phosphorylation profile compared to glycolysis in both cell types. Also, treatment with BHB increases the expression of genes normally associated with stemness and mitochondrial biogenesis and decreases the expression of genes related to glycolytic program and differentiation in 5FU treated cells. Self-renewal and migration potential of BHB treated cells increased significantly.
Conclusion:
These findings suggest that BHB utilization via oxidative mitochondrial metabolism can fuel proliferation, migration and stemness in 5FU treated SW480 colon cancer cells.
Keywords: Beta-hydroxybutyrate, metabolic phenotype, colon cancer, 5-fluorouracil
Introduction
Colorectal cancer cells are very heterogeneous and diverse in terms of tissue and function. The high rates of proliferation in these cells make them to adapt their metabolism to supply metabolites for the production of ATP, maintaining the oxidation reduction balance, survival and growth. It seems that due to the limited availability of fuel sources subgroups of these cells with stemness properties and tumor formation ability called (Cancer Stem Cells) have flexibility in using a spectrum of glycolytic to oxidative phosphorylation metabolism so that they can survive in a harsh environment and restore the entire tumor mass again (Zeuner et al., 2014). This diversity is the result of the interaction of genetic factors, epigenetics and the microenvironment (Visvader, 2011). Although from about 100 years ago, cancer was known as a metabolic disorder, but the exact recognition of metabolic pathways of cancer stem cells have been of great interest to researchers in recent years, so that they can be targeted for specific treatments (Menendez, 2015).
One of the metabolites that are produced in the liver and consumed by cells as fuel in specific conditions like fasting, strenuous exercise and adhering very low carbohydrate diets is the beta-hydroxybutyrate (BHB) ketone body (Allen et al., 2014, Tan-Shalaby et al., 2016, Klement et al., 2017), which is metabolized within the Krebs cycle via degradation into acetyl-CoA in the oxidative phosphorylation pathway (Vidali et al., 2015). According to studies, BHB in addition to its role as a metabolic fuel, can act as an external signal through interaction with cell surface receptors (Newman and Verdin, 2014a). Besides that, BHB through post-translational modifications including inhibition of a particular subtype of histone deacetylases, increase in the histone acetylation and beta-hydroxylation epigenetic marks can regulate genes expression which are involved in reprogramming of cancer stem cells such as induction of differentiation, EMT and stemness (Bartmann et al., 2018, Kong et al., 2012, Dokmanovic et al., 2007, Zhang et al., 2013, Xie et al., 2016).
In the traditional view, the genetic pattern of the cancerous tissue was determining the metabolic pathway to meet its metabolic needs and since the aerobic glycolysis pathway has been considered for many years as the preferred route of cancer cell metabolism, the increase in ketone bodies following a ketogenic diet for example, including BHB, in some studies has been proposed as an auxiliary treatment for cancer by disrupting this metabolic pathway (Menendez, 2015, Seyfried et al., 2003, Zuccoli et al., 2010). Other studies have suggested that this ketone body is a suitable fuel for breast cancer stem cells in the direction of oxidative phosphorylation, which not only plays a role in treatment, but also contributes to the progression of metastatic growth of cancer cells in stress conditions (Bonuccelli et al., 2010, Martinez-Outschoorn et al., 2011). On the other hand, some researchers believe that the addition of BHB by preventing the induction of autophagy in adjacent fibroblasts of cancer cells prevents cachexia, preserves muscle mass and improves the general condition of patients (Shukla et al., 2014).
Considering this suggestion that cancer stem cells exist with different characteristics and abilities compared to bulk tumor cells and subtypes of the same tumor mass represent a spectrum of glycolytic to oxidative phosphorylation phenotype (Martinez-Outschoorn et al., 2016), determining the exact type of cell metabolism that can control the fate of cancer cells through epigenetic regulations seems to be necessary to lead to the adoption of appropriate treatment.
Given the inconsistencies in the effects of BHB as a mitochondrial fuel and the high prevalence and frequency of relapse after chemotherapy in colorectal cancer which has been much discussed (Hammond et al., 2016), in the present study we have investigated the effect of treatment with it on the metabolic phenotype of subpopulations of SW480 colorectal cancer cell line that are more resistant to a chemotherapy drug, 5-Fluorouracil (5FU) as a model of cells with more stemness properties (Denise et al., 2015).We have also analyzed the differences in the expression patterns of some stemness and differentiation genes, migration and colony formation abilities of these roughly chemo-resistant cells in comparison with wild type SW480 cells.
Materials and Methods
Cell culture and determination of IC50 dose for 5FU using MTT colorimetric assay
Human SW480 cells (obtained from National Cell bank of Iran, Pasteur Institute, Iran) were grown under standard conditions, including DMEM (GIBCO, Life Technologies) with 10% FBS (GIBCO, Life Technologies), 1% Pen/Strep (Sigma), 1% L-Glutamine (Sigma), 5% CO2, 95% humidity at 37 °C, and with media exchange every 2–3 days. Confluent cells were harvested by EDTA-trypsin. For Determination of IC50 dose of 5FU (Ebewe PHARMA, AUSTRIA), SW480 cells were seeded at 5,000cells/well in flat-bottom 96-well culture plates. The cells were incubated with 5FU for 72 h. After medium removal, the cells were incubated with MTT (Sigma, St. Louis, USA) solution (5 mg/mL in PBS) for 4 h and the resulting formazan was solubilized with DMSO (200 µL). The absorption was measured in an enzyme-linked immunosorbent assay (ELISA) reader (ELx808, BioTek). The IC50 of 5FU was calculated based on concentration and percentage of cell viability by measuring absorbance at 570 nm.
Cell viability analysis
To determine the effects of BHB (Sigma, St. Louis, USA) on the viability of SW480 and the isolated 5FU treated cells, Using the MTT colorimetric assay, 3000 cell/well were seeded and after 24 h, they were treated with BHB (50, 100, 250, 500, 1,000, 2,500, 5,000 µM) for 72 h. Then, after performing similar steps to the previous protocol for MTT, absorbance was read at 570nm.
Measurements of oxygen consumption and extracellular acidification rates
The analysis of metabolic phenotype was conducted based on measurements of extracellular oxygen consumption as an indicator of oxidative phosphorylation and extracellular acidification rate as a measure of glycolysis by investigating the changes in fluorescence signal from the fluorophore using the MitoXpress® Xtra kit and the pH-Xtra kit (LuxcelBioscience, Cork, Ireland) respectively in SW480 and 5FU treated SW480 cells using fluorescent indicators. Briefly, about 70,000 cells/well in 96-well plates were cultured overnight in a standard CO2 incubator and then cells were treated with BHB (at the concentration equal to calculated EC50 dose at 250µM) for 24 h that maintained for the duration of the experiment. For OCR measurement as recommendations by manufacturer, after addition of the probe and 2 drop of mineral oil for sealing, Fluorescence signal intensity was measured kinetically on a plate reader (Cytation 3, Bio-Tek) at 37°C every 1:30 minutes for at least 120 minutes in time-resolved fluorescence (TR-F) mode using a 365 nm excitation and 650 nm emission filters, delay times 30 and 70μs.
Extracellular acidification rate (ECAR) was determined separately after removing CO2 by keeping the cells in a CO2 free incubator at 37°C for three hours before measurements. The changes of intensity of fluorescence was measured with excitation and emission wavelengths of 380 nm and 615 nm every 1:30 minutes for at least 120 minutes in time-resolved fluorescence (TR-F) mode after adding pH-Xtra reagents. Using the slope of the linear portion of the curve obtained from plotting the fluorescence intensities against each time point, the mean values of 2 repeats of triplicate samples were statistically analyzed.
cDNA synthesis and RT-PCR assay
Total RNA was extracted by RNX-Plus solution according to the supplier’s protocol (Cinaclone, Iran). First, strand complementary DNA (cDNA) was synthesized by cDNA synthesis kit using 1 µg of the extracted RNA (2-step RT-PCR kit, Vivantis, USA), The polymerase chain reaction (PCR) for PGC-1α, c-MYC, NANOG, ALPi and KRT20 and glyceraldehyde-3-phosphate dehydrogenase (GAPDH) (as internal control) was performed by the Master PCR Kit (AmpliqonSYBR green master mix) according to the manufacturer’s instructions. The applied primers is presented in Table 1.
Table 1.
Details of the Primer Pairs Used in This Study
| Gene | Primer sequence |
|---|---|
| NANOG | F:AACTCTCCAACATCCTGAACCTC |
| R: CGTCACACCATTGCTATTCTTCG | |
| c-MYC | F:GCATACATCCTGTCCGTCCAAG |
| R:TTCCTTACGCACAAGAGTTCCG | |
| ALPi | F:CCTGGTTGGGAAATAAGCACTC |
| R:TTCAGAGGGAGGTCAGAAACAC | |
| PGC-1α | F:GTCACAACACTTACAAGCCAAACC |
| R:GCAGTTCCAGAGAGTTCCACAC | |
| KRT20 | F:TTGAACAGGAAATTGCTACTTACCG |
| R:ACCTTGCCATCCACTACTTCTTG | |
| GAPDH | F:CATCAAGAAGGTGGTGAAGCAG |
| R:GCGTCAAAGGTGGAGGAGTG |
Colony formation assay
To determine the Cells ability to form colonies, about 80-100 cells/well in 12-well plates were seeded overnight and treated with 250 µM of BHB. after 14 days of incubation, Colonies were fixed for 5 minutes with acetic acid/methanol 1:7 and then stained with 0.05% crystal violet (Sigma Chemical Company, Louis, MO, USA) for 2 h at room temperature, washed with tap water, air-dried, and Colonies of at least 50 cells were counted with the microscope. The colony formation potential was defined as the percent of the number of colonies formed to the number of primary seeded cells.
Scratch assay
To examine the ability of cells migration, after the formation of 90% confluence monolayer, a gap was created in the middle of the 12 –well plate with the head of the crystalline tip. Next, the wells were washed twice with PBS to remove loose cells and fresh medium along with 250 µM BHB was added. Photographs were taken at 0, 36 and 72 h to assess cell migration that was calculated as percentage of wound closure:
% of wound closure = [(At = 0 h – At = Δ h)/ At = 0 h] × 100%
At =0h is the area of wound measured at time 0 after scratching and At=Δh is the area of wound measured 36 or 72 hafter scratching (Yue et al., 2010).
Statistical analysis
Data are presented as mean ± standard deviation (S.D.). Statistical analysis was performed Using SPSS 21 software and was determined by two-tailed Student’s t-test, one-way ANOVA (Tukey post-hoc test). Measuring the distance between the edges of scratches was performed using ImageJ software. For OCR and ECAR, the slopes of individual linear regression lines were compared. P < 0.05 was considered to be statistically significant. The software GraphPad Prism 6 (La Jolla, CA 92037 USA) was used to create the Figures and determine the EC50 and IC50doses using the dose-response curve function of this software.
Results
Establishment of 5FU resistant colon cancer cell line from SW480 wild type
To determine the IC50 value of 5FU using the MTT test, the percentage of SW480 cell viability was plotted against increasing concentrations (0, 10, 50, 100, 150, 200, 300μM) of 5FU following 72 h exposure (Figure 1A), accordingly the IC50 value at 20 µM (10.62-39.74) for 5FU was calculated, as are shown (Figure 1B).
Figure 1.
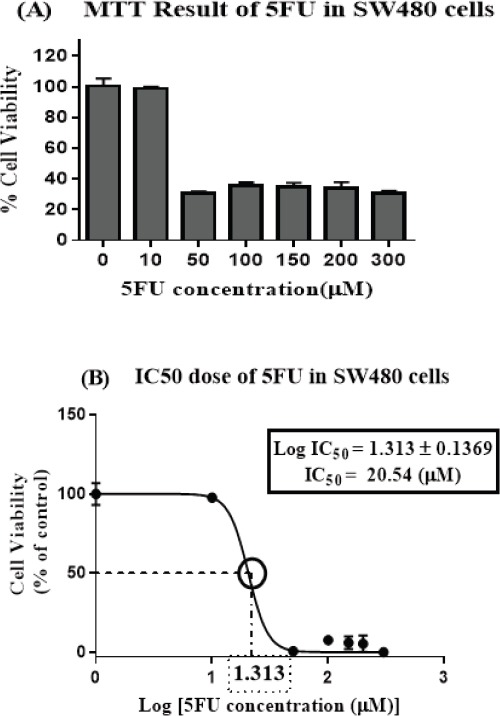
Cell Viability is Reduced by 5FU Treatment in SW480 Colon Cancer Cell Line. (A) SW480 cell line was treated with different concentrations of 5-FU (0, 10, 50, 100, 150, 200 and 300 µM) for 72 hours, Cell viability was measured with the MTT method (B) IC50 at 20 µM was determined as 50% growth inhibition using concentration-response curve. The results are provided as mean values with standard error (95% confidence interval IC50 =10.62-39.74) from at least three independent experiments and normalized to 100% of the control group.
Then the Confluent monolayer of SW480 cells were subjected to the IC50 dose of 5FU (equal to 20 μM) for 72 hours, after that the fresh complete media was added to the surviving cells for a couple of weeks provided for their proliferation. These cells, which were in the logarithmic phase, were isolated as our target population in all experiments in this study to be compared with their parent cells.
Incremental effects of BHB treatment on cell viability
We observed that 72h treatment of BHB at various concentrations (0, 100, 250, 500, 1,000, 2,500, 5,000 μM), increased cell survival in both groups of 5FU treated and SW480 cells at most concentrations. By increasing the BHB concentration up to 250 µM, an increasing trend is observed in the survival of the cells. But in concentrations between 250 and 500 µM or above, although cell viability is still higher than that of control group, a downward reversal trend can be seen (Figure 2A).
Figure 2.
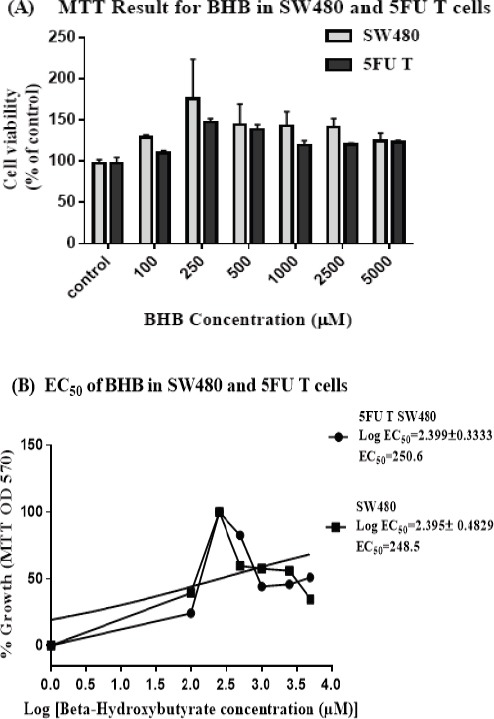
Cell Viability Increased after Beta-hydroxy Butyrate Treatment in 5FU Treated and SW480 Cells. (A) Cell viability measurement results with MTT method in SW480 and 5FU treated Cells. 5FU treated cells were established by treating the SW480 cells with 20 µM of 5FU for 72 hours, then after about 2 weeks rest and reaching the logarithmic phase, these cells were treated with different concentrations of BHB (0, 100, 250, 500, 1000, 2500 and 5000 µM) along with their parent cells for 72 hours (B) EC50 was calculated at 250 µM using concentration-response curve for each cell type. The results are provided as mean values with standard error (95% confidence interval EC50 =53.14-1182 for 5FU T and 26.26-2351 for SW480 cells) from at least three independent experiments and normalized to 100% of the control group.
The concentration-response curve was used to calculate the EC50 values at 250.6 (53.14-1182) and 248.5 (26.26-2351) µM for BHB (Figure 2C and D) in 5FU treated and SW480 cells respectively (Figure 2B).
Increase in oxygen consumption and decline in extracellular acidification rates
To determine whether 5FU treated cells in comparison with parent SW480 cells can use BHB as metabolic fuel, we measured the slope of oxygen consumption rate (OCR) values in parallel with extracellular acidification rate (ECAR) upon BHB treatment for at least 120 minutes (Figure 3A and 3B). The results showed a significantly decreased ECAR and increased OCR in both cell types following BHB treatment (Figure 3C), reflecting the superiority of oxidative phosphorylation profile compared to glycolysis in both cell types. While treatment with BHB resulted in a significant increase of about 5-fold of OCR compared to the control group (p<0.0001), ECAR showed a significant reduction after BHB treatment compared to control group in both cell types (p<0.0001).
Figure 3.
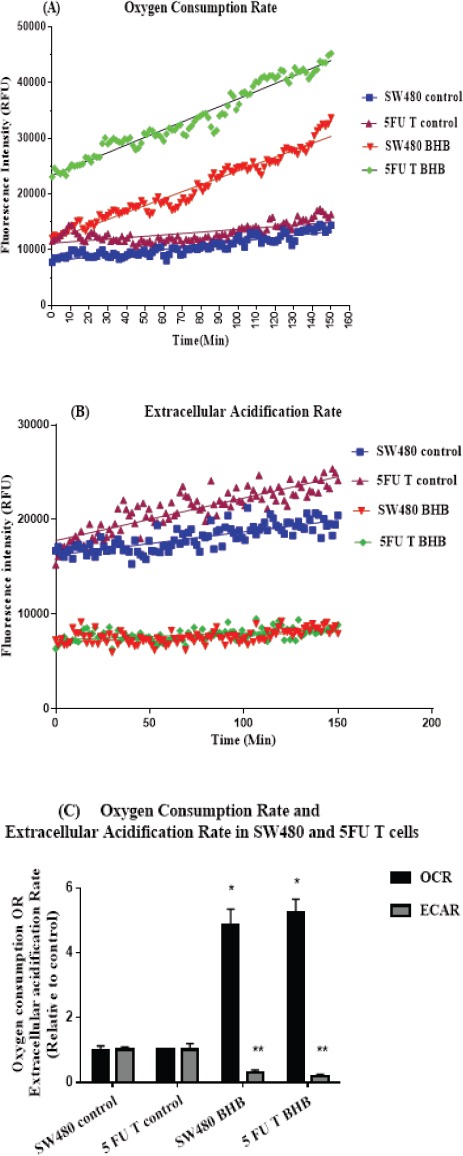
Increase in Oxygen Consumption Rate and Decline in Extracellular Acidification Rate after BHB Treatment in SW480 and 5FU Treated Cells. (A and B) Lifetime fluorescence value of MitoXpress-Xtra and pH-Xtra assessed as an indication of OCR and ECAR (mean ± SEM, n = 6) respectively in SW480 and 5FU treated cells Using the slope of the linear portion of the curves for 120 of the experiment relative to control (C) The real time-responses of average fluorescence value normalized to control for OCR and ECAR are shown in SW480 and 5FU treated cells respectively. *p < 0.0001 vs. control in OCR. **p < 0.0001 vs. control in ECAR
Analysis of gene expression
In order to investigate the relationship between metabolic phenotype and the status of differentiation and stemness, we analyzed the expression of some critical genes including NANOG, a stemness marker, c-MYC oncogene which seems to be related to the glycolytic program, Intestinal Alkaline Phosphatase (ALPi), a cell surface glycoprotein that used as an intestinal differentiation marker (Matsumoto et al., 1990), Keratin 20 (KRT20), a member of the intermediate filament and a well-known marker of intestinal differentiation and PPARGC1A (PGC-1α), a master regulator of mitochondrial biogenesis and the metabolic shift toward oxidative phosphorylation in 5FU treated and SW480 cells following 72 h treatment with BHB.
The analysis of the expression of genes in SW480 cells is shown in (Figure 4A), PGC-1α expression after treatment with BHB significantly decreased relative to control (p<0.0001). c-MYC expression after treatment with BHB increased significantly compared to control (p<0.05). No differences were observed in ALPi and NANOG expression in SW480 cells (p>0.05). KRT20, as a marker for the differentiation of colon cells, was not expressed at all.
Figure 4.
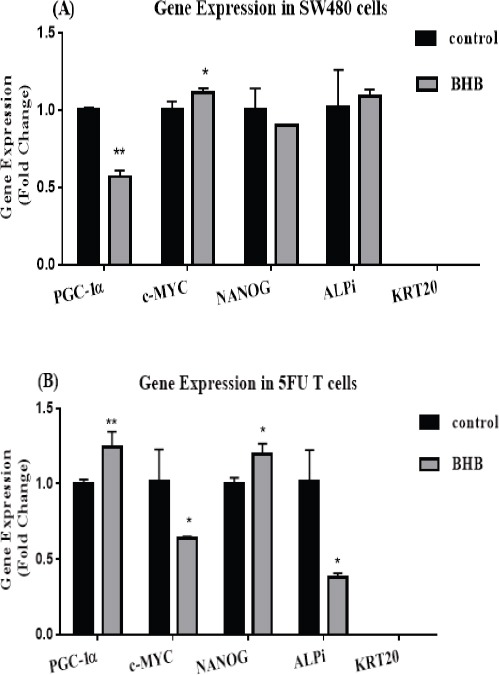
Relative Gene Expression. (A) PGC- 1α, c-MYC, NANOG, ALPi and KRT20 relative mRNA expression level determined by real-time PCR after 72 h treatment with BHB in SW480 cells (B) Relative expression of mRNA of genes mentioned in the A part after 72 h treatment with BHB in 5FU treated SW480 cells. Each column represents mean ± SEM of data from two independent experiments in duplicate reactions. *p < 0.05 vs. control. **p < 0.0001 vs. control.
As shown (Figure 4B), the expression of PGC-1α in 5FU treated cells showed a significant increase (p<0.0001) after BHB treatment. The expression of oncogenic c-MYC showed a significant decrease compared to control after BHB treatment (p<0.05). Treatment with BHB significantly reduced ALPi expression (p<0.05). The expression of NANOG after treatment with BHB significantly increased compared to control (p<0.05).
BHB treatment was associated with increased self-renewal ability
Self-renewal ability, which is one of the characteristics of stem cells, was investigated by treatment with BHB in 5FU treated compared to SW480 single cells using a clonogenic assay. As seen in (Figure 5) BHB treatment in both cell types caused a significant increase in colony formation potential compared to control (p<0.05).
Figure 5.
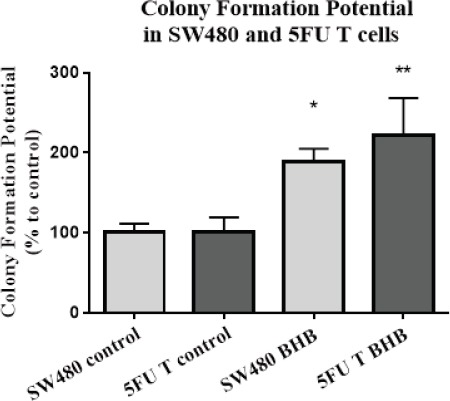
Beta-hydroxybutyrate Increased the Colony Formation Potential. Colony formation potential was calculated as the percent of number of produced colonies divided by the number of seeded single cells. Each colony composed of at least 50 cells. The results are provided as mean values with standard deviations from three independent experiments and normalized to 100% of the control group. *p < 0.05 vs. control of SW480. **p < 0.05 vs. control of 5FU treated cells.
Increased cell migration following BHB treatment
Migration ability of 5FU treated and SW480 cells following treatment with BHB, was investigated by scratch assay as a functional test. The first microscopic assessments at 0, 18, 36, and 72 hours showed that cells in both types migrated to the wound (Figure 6 A and B).
Figure 6.
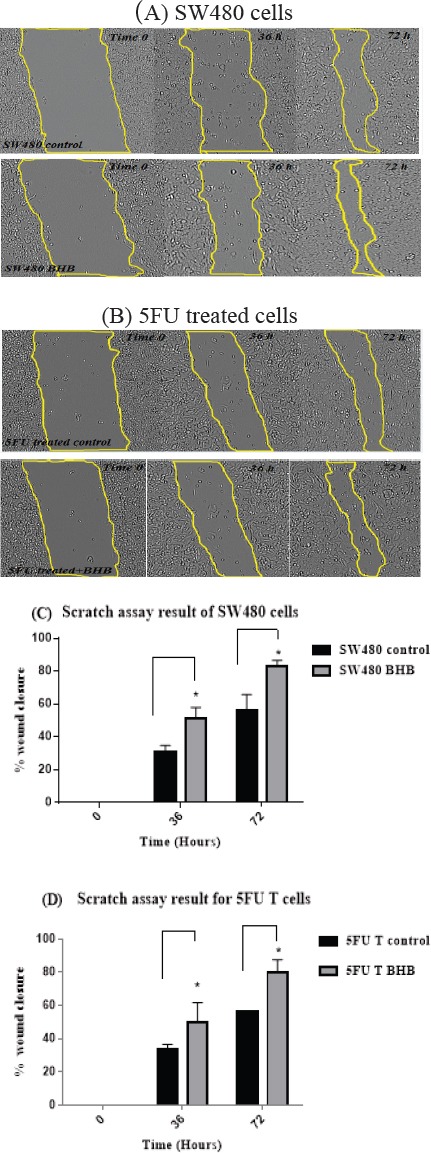
Migration of SW480 and 5FU Treated Cells. (A) Photographs of wounded SW480 cells. The photos were captured immediately (Time = 0) after scratching and after 36 and 72 h following BHB treatment using an inverted microscope equipped with a digital camera. The area restricted to lines indicate the boundary of migrated cells at the desired time point (B) Photographs of wounded 5FU treated SW480 cells (C) The effect of BHB treatment in migration was plotted as a percentage of wound closure in SW480 cells (D) migration as a percentage of wound closure in 5FU treated SW480 cells. The results are provided as mean values with standard deviations from at least three independent experiments.*p < 0.05 vs. control after 36 and 72 h.
As shown in (Figure 6 C and D) the average migration rate of SW480 and 5FU treated cells (wound closure percentage) showed a significant increase after 36 and 72 hours of BHB treatment using one-way ANOVA analysis (p<0.05).
Discussion
We provide here a proof of growth, survival, migration and expression of genes involved in mitochondrial biogenesis, stemness and differentiation with the consumption of BHB as one of the derivatives of Acetyl-CoA, in the pathway of oxidative mitochondrial phosphorylation in 5FU treated SW480 colon cancer cells.
A series of recent studies have shown that glycolytic phenotype has been dominant in the field of breast cancer, liver and nasopharyngeal carcinoma, similar to that of natural embryonic stem cells (ESCs) (Sancho et al., 2016). In addition, iPS Cells resulting from the reprogramming process of somatic cells have also been reported to increase glycolysis, which may indicate a link between this metabolic phenotype and those of the stem cells (Folmes et al., 2011).
On the other hand, studies on cancer stem cells in lung, colon, glioblastoma and adenocarcinoma of the pancreatic ducts have reported the oxidative mitochondrial phosphorylation, which is the preferred pathway of natural somatic cells, as the preferred metabolic phenotype in these cells (Janiszewska et al., 2012, Sancho et al., 2015, Ye et al., 2011, Peiris-Pagès et al., 2016, Bonuccelli et al., 2010). Using the data from measurement of oxygen consumption and extracellular acidity, our study showed that glycolytic activity decreased in favor of oxidative phosphorylation in BHB treated cells. Since our target cells in this study were only enriched on the basis of resistance to chemotherapy drug as one of the available methods for the isolation of cancer stem cells, we could not definitely call them stem cells, but they can be considered as a subpopulation of metastatic, undifferentiated and resistant to chemotherapy drug cancer cells that are able to use metabolic fuels in the oxidative phosphorylation pathway, which is consistent with the results of the studies mentioned above. In general it can be inferred that there is a plasticity in metabolic preference among different cancer cells.
The findings of the study on pancreatic ductal adenocarcinoma have proved that the expression of the transcription factor PGC-1α, a key regulator of mitochondrial biogenesis, tumorigenesis and self-renewal, is essential for the oxidative phosphorylation function. In addition, the c-MYC-dependent glycolytic program was found in cells that were more differentiated, which contradicted the fact that c-MYC increase stemness by increasing glycolysisthrough up-regulation of glycolytic enzymes and inhibiting PGC-1a expression. According to the results of this study, c-MYC can act as an upstream PGC-1α inhibitor, and knockdown or inhibition of c-MYC had led to increased expression of PGC-1α and, consequently, increased oxidative phosphorylation and decreased glycolysis (Sancho et al., 2015). Investigating the expression of genes associated with metabolic pathways in our study also indicated an increase in PGC-1a expression and decreased c-MYC expression following BHB use in 5FU treated cells, which confirms the ability of these cells to use the oxidative phosphorylation pathway.In this study, we can see a difference in the expression of PGC-1α and c-MYC between the two cell groups. There are studies that show 5FU itself displaces metabolism toward oxidative phosphorylation and it has the ability to activate AMPK and PGC-1α, which ultimately leads to increased mitochondrial biogenesis and oxidative phosphorylation (Denise et al., 2015, Luo et al., 2013, Kurz et al.,2004). The activation of the SIRT1 / PGC1-α axis has contributed in the development of resistance to chemotherapy and the metabolic shift towards oxidative phosphorylation in colon cancer cells that had metastasized to the liver (Vellinga et al., 2015).Therefore, the difference in gene expression between the two groups of cells can be attributed to the effects of 5FU.
There are studies that indicate the role of BHB as histone deacetylase (Newman and Verdin, 2014b, Shimazu et al., 2013), and taking into account the results of some studies that indicate that histone deacetylases play a role in inducing differentiation by regulating the expression of genes (Marks et al., 2000, Zhang et al., 2013), but the results of this study showed that BHB reduced the expression of ALPi, which is a marker of intestinal cell differentiation (Hinnebusch et al., 2004). KRT20 as a well-known differentiation factor of intestinal epithelial cells (Chan et al., 2009), also did not expressed in this study, and we even see an increase in the expression of the stem cell pluripotency factor NANOG which is related to stemness characteristics, may be through inducing mitochondrial fatty acid oxidation (FAO) genes expression and metabolic reprogramming (Chen et al., 2016). Although we did not investigate the molecular mechanisms of regulating genes expression in this study, but according to the results of some studies, it may be justified that BHB as a high-energy fuel and by increasing the Acetyl-CoA content may increase histone acetylation (Newman and Verdin, 2014b), that by loosening the structure of nucleosomes promote genes transcription that are involved in controlling the stemness (Verdone et al., 2005, Shi and Tu, 2015). The results of some existing studies indicate a role for histone acetylation in induction of stemness in embryonic stem cells (Moussaieff et al., 2015). Therefore, it seems that BHB acts as a tumor growth booster both through fueling via mitochondrial metabolism and also through epigenetic mechanisms.
In addition, increased proliferation capacity, ability to self-renewal and migration of these cells in the presence of BHB were evident in this study which is consistent with the results of studies conducted in breast cancer cells (Martinez-Outschoorn et al., 2011, Bonuccelli et al., 2010).
Fluorouracil is used as one of the first line drug in chemotherapy in many cases of cancers including colorectal and still, the complication of recurrence and metastasis is problematic (Loupakis et al., 2014, Longley and Johnston, 2005). Considering the results of this study and the similar studies available suggesting the ability of these cells to use mitochondrial aerobic metabolism, administering a ketogenic diet to patients as an auxiliary treatments, assuming that the Warburg effect does not allow cells to use ketones, is implausible and requires further studies.
In summary, the results of this study suggest that 5FU treated colon cancer cells are able to use aerobic metabolic fuel BHB, and their stemness features also increased. Given that this ability to change and flexibility in energy metabolism make it possible to adapt to different conditions and even develop more malignant and aggressive behaviors that ultimately determine the fate of the cell and host.
Funding Statement
This work was supported by Shahid Beheshti University of Medical Sciences, Tehran, Iran [grant number 10242-8-1].
Acknowledgements
The present authors would like to express their gratitudeto colleagues in Cellular and Molecular department of National Nutrition and Food Technology Research Institute, Faculty of Nutrition Science and Food Technology Shahid Beheshti University of Medical Sciences and Shahid Beheshti University of Medical Sciences, Tehran, Iran for supporting this study.
References
- 1.Allen BG, Bhatia SK, Anderson CM, et al. Ketogenic diets as an adjuvant cancer therapy:History and potential mechanism. Redox Biol. 2014;2:963–70. doi: 10.1016/j.redox.2014.08.002. [DOI] [PMC free article] [PubMed] [Google Scholar]
- 2.Bartmann C, JanakiRaman SR, Floter J, et al. Beta-hydroxybutyrate (3-OHB) can influence the energetic phenotype of breast cancer cells, but does not impact their proliferation and the response to chemotherapy or radiation. Cancer Metab. 2018;6:8. doi: 10.1186/s40170-018-0180-9. [DOI] [PMC free article] [PubMed] [Google Scholar]
- 3.Bonuccelli G, Tsirigos A, Whitaker-Menezes D, et al. Ketones and lactate “fuel” tumor growth and metastasis:Evidence that epithelial cancer cells use oxidative mitochondrial metabolism. Cell Cycle. 2010;9:3506–14. doi: 10.4161/cc.9.17.12731. [DOI] [PMC free article] [PubMed] [Google Scholar]
- 4.Chan CW, Wong NA, Liu Y, et al. Gastrointestinal differentiation marker Cytokeratin 20 is regulated by homeobox gene CDX1. Proc Natl Acad Sci U S A. 2009;106:1936–41. doi: 10.1073/pnas.0812904106. [DOI] [PMC free article] [PubMed] [Google Scholar]
- 5.Chen CL, Uthaya Kumar DB, Punj V, et al. NANOG metabolically reprograms tumor-initiating stem-like cells through tumorigenic changes in oxidative phosphorylation and fatty acid metabolism. Cell Metab. 2016;23:206–19. doi: 10.1016/j.cmet.2015.12.004. [DOI] [PMC free article] [PubMed] [Google Scholar]
- 6.Denise C, Paoli P, Calvani M, et al. 5-fluorouracil resistant colon cancer cells are addicted to OXPHOS to survive and enhance stem-like traits. Oncotarget. 2015;6:41706–21. doi: 10.18632/oncotarget.5991. [DOI] [PMC free article] [PubMed] [Google Scholar]
- 7.Dokmanovic M, Clarke C, Marks PA. Histone deacetylase inhibitors:overview and perspectives. Mol Cancer Res. 2007;5:981–9. doi: 10.1158/1541-7786.MCR-07-0324. [DOI] [PubMed] [Google Scholar]
- 8.Folmes CD, Nelson TJ, Martinez-Fernandez A, et al. Somatic oxidative bioenergetics transitions into pluripotency-dependent glycolysis to facilitate nuclear reprogramming. Cell Metab. 2011;14:264–71. doi: 10.1016/j.cmet.2011.06.011. [DOI] [PMC free article] [PubMed] [Google Scholar]
- 9.Hammond WA, Swaika A, Mody K. Pharmacologic resistance in colorectal cancer:a review. Ther Adv Med Oncol. 2016;8:57–84. doi: 10.1177/1758834015614530. [DOI] [PMC free article] [PubMed] [Google Scholar]
- 10.Hinnebusch BF, Siddique A, Henderson JW, et al. Enterocyte differentiation marker intestinal alkaline phosphatase is a target gene of the gut-enriched Kruppel-like factor. Am J Physiol Gastrointest Liver Physiol. 2004;286:23–30. doi: 10.1152/ajpgi.00203.2003. [DOI] [PubMed] [Google Scholar]
- 11.Janiszewska M, Suvà ML, Riggi N, et al. Imp2 controls oxidative phosphorylation and is crucial for preserving glioblastoma cancer stem cells. Genes Dev. 2012;26:1926–44. doi: 10.1101/gad.188292.112. [DOI] [PMC free article] [PubMed] [Google Scholar]
- 12.Klement RJ, Feinman RD, Gross EC, et al. Need for new review of article on ketogenic dietary regimes for cancer patients. Med Oncol. 2017;34:108. doi: 10.1007/s12032-017-0968-4. [DOI] [PubMed] [Google Scholar]
- 13.Kong D, Ahmad A, Bao B, et al. Histone deacetylase inhibitors induce epithelial-to-mesenchymal transition in prostate cancer cells. PLoS One. 2012;7:e45045. doi: 10.1371/journal.pone.0045045. [DOI] [PMC free article] [PubMed] [Google Scholar]
- 14.Kurz EU, Douglas P, Lees-Miller SP. Doxorubicin activates ATM-dependent phosphorylation of multiple downstream targets in part through the generation of reactive oxygen species. J Biol Chem. 2004;279:53272–81. doi: 10.1074/jbc.M406879200. [DOI] [PubMed] [Google Scholar]
- 15.Longley D, Johnston P. Molecular mechanisms of drug resistance. J Pathol. 2005;205:275–92. doi: 10.1002/path.1706. [DOI] [PubMed] [Google Scholar]
- 16.Loupakis F, Cremolini C, Masi G, et al. Initial therapy with FOLFOXIRI and bevacizumab for metastatic colorectal cancer. N Engl J Med. 2014;371:1609–18. doi: 10.1056/NEJMoa1403108. [DOI] [PubMed] [Google Scholar]
- 17.Luo L, Huang W, Tao R, et al. ATM and LKB1 dependent activation of AMPK sensitizes cancer cells to etoposide-induced apoptosis. Cancer lett. 2013;328:114–19. doi: 10.1016/j.canlet.2012.08.034. [DOI] [PMC free article] [PubMed] [Google Scholar]
- 18.Marks PA, Richon VM, Rifkind RA. Histone deacetylase inhibitors:inducers of differentiation or apoptosis of transformed cells. J Natl Cancer Inst. 2000;92:1210–6. doi: 10.1093/jnci/92.15.1210. [DOI] [PubMed] [Google Scholar]
- 19.Martinez-Outschoorn UE, Peiris-Pagés M, Pestell RG, et al. Cancer metabolism:a therapeutic perspective. Nat Rev Clin Oncol. 2017;14:11–31. doi: 10.1038/nrclinonc.2016.60. [DOI] [PubMed] [Google Scholar]
- 20.Martinez-Ootschoorn UE, Prisco M, Ertel A, et al. Ketones and lactate increase cancer cell 𠇌stemness,” driving recurrence, metastasis and poor clinical outcome in breast cancer:achieving personalized medicine via Metabolo-Genomics. Cell Cycle. 2011;10:1271–86. doi: 10.4161/cc.10.8.15330. [DOI] [PMC free article] [PubMed] [Google Scholar]
- 21.Matsumoto H, Erickson RH, Gum JR, et al. Biosynthesis of alkaline phosphatase during differentiation of the human colon cancer cell line Caco-2. Gastroenterology. 1990;98:1199–1207. doi: 10.1016/0016-5085(90)90334-w. [DOI] [PubMed] [Google Scholar]
- 22.Menedez JA. Metabolic control of cancer cell stemness:Lessons from iPS cells. Cell Cycle. 2015;14:3801–11. doi: 10.1080/15384101.2015.1022697. [DOI] [PMC free article] [PubMed] [Google Scholar]
- 23.Moussaieff A, Rouleau M, Kitsberg D, et al. Glycolysis-mediated changes in acetyl-CoA and histone acetylation control the early differentiation of embryonic stem cells. Cell Metab. 2015;21:392–402. doi: 10.1016/j.cmet.2015.02.002. [DOI] [PubMed] [Google Scholar]
- 24.Newman JC, Verdin E. Ketone bodies as signaling metabolites. Trends Endocrinol Metab. 2014a;25:42–52. doi: 10.1016/j.tem.2013.09.002. [DOI] [PMC free article] [PubMed] [Google Scholar]
- 25.Newman JC, Verdin E. β-hydroxybutyrate:much more than a metabolite. Diabetes Res Clin Pract. 2014b;106:173–81. doi: 10.1016/j.diabres.2014.08.009. [DOI] [PMC free article] [PubMed] [Google Scholar]
- 26.Peiris-Pagès M, Martinez-Outschoorn UE, Pestell RG, et al. Cancer stem cell metabolism. Breast Cancer Res. 2016;18:1. doi: 10.1186/s13058-016-0712-6. [DOI] [PMC free article] [PubMed] [Google Scholar]
- 27.Sancho P, Barneda D, Heeschen C. Hallmarks of cancer stem cell metabolism. Br J Cancer. 2016;114:1305–12. doi: 10.1038/bjc.2016.152. [DOI] [PMC free article] [PubMed] [Google Scholar]
- 28.Sancho P, Burgos-Ramos E, Tavera A. MYC/PGC-1αbalance determines the metabolic phenotype and plasticity of pancreatic cancer stem cells. Cell Metab. 2015;22:590–605. doi: 10.1016/j.cmet.2015.08.015. [DOI] [PubMed] [Google Scholar]
- 29.Seyfried TN, Sanderson TM, El-Abbadi MM. Role of glucose and ketone bodies in the metabolic control of experimental brain cancer. Br J Cancer. 2003;89:1375–82. doi: 10.1038/sj.bjc.6601269. [DOI] [PMC free article] [PubMed] [Google Scholar]
- 30.Shi L, Tu BP. Acetyl-CoA and the regulation of metabolism:mechanisms and consequences. Curr Opin Cell Biol. 2015;33:125–31. doi: 10.1016/j.ceb.2015.02.003. [DOI] [PMC free article] [PubMed] [Google Scholar]
- 31.Shimazu T, Hirschey MD, Newman J, et al. Suppression of oxidative stress by β-hydroxybutyrate, an endogenous histone deacetylase inhibitor. Science. 2013;339:211–4. doi: 10.1126/science.1227166. [DOI] [PMC free article] [PubMed] [Google Scholar]
- 32.Shukla SK, Gebregiworgis T, Purohit V, et al. Metabolic reprogramming induced by ketone bodies diminishes pancreatic cancer cachexia. Cancer Metab. 2014;2:1. doi: 10.1186/2049-3002-2-18. [DOI] [PMC free article] [PubMed] [Google Scholar]
- 33.Tan-Shalaby JL, Carrick J, Edinger K. Modified Atkins diet in advanced malignancies-final results of a safety and feasibility trial within the Veterans Affairs Pittsburgh Healthcare System. Nutr Metab. 2016;13:52. doi: 10.1186/s12986-016-0113-y. [DOI] [PMC free article] [PubMed] [Google Scholar]
- 34.Vellinga TT, Borovski T, de Boer VC, et al. SIRT1/PGC1αdependent increase in oxidative phosphorylation supports chemotherapy resistance of colon cancer. Clin Cancer Res. 2015;2290:2014. doi: 10.1158/1078-0432.CCR-14-2290. [DOI] [PubMed] [Google Scholar]
- 35.Verdone L, Caserta M, Di Mauro E. Role of histone acetylation in the control of gene expression. Biochem Cell Biol. 2005;83:344–53. doi: 10.1139/o05-041. [DOI] [PubMed] [Google Scholar]
- 36.Vidali S, Aminzadeh S, Lambert B. Mitochondria:The ketogenic diet--A metabolism-based therapy. Int J Biochem Cell Biol. 2015;63:55–9. doi: 10.1016/j.biocel.2015.01.022. [DOI] [PubMed] [Google Scholar]
- 37.Visvader JE. Cells of origin in cancer. Nature. 2011;469:314–22. doi: 10.1038/nature09781. [DOI] [PubMed] [Google Scholar]
- 38.Xie H, Zhang D, Chung D. Metabolic regulation of gene expression by histone lysine beta-hydroxybutyrylation. Mol Cell. 2016;62:194–206. doi: 10.1016/j.molcel.2016.03.036. [DOI] [PMC free article] [PubMed] [Google Scholar]
- 39.Ye XQ, Li Q, Wang GH, et al. Mitochondrial and energy metabolism-related properties as novel indicators of lung cancer stem cells. Int J Cancer. 2011;129:820–31. doi: 10.1002/ijc.25944. [DOI] [PubMed] [Google Scholar]
- 40.Yue PY, Leung EP, Mak N, et al. A simplified method for quantifying cell migration/wound healing in 96-well plates. J Biomol Screen. 2010;15:427–33. doi: 10.1177/1087057110361772. [DOI] [PubMed] [Google Scholar]
- 41.Zeuner A, Todaro M, Stassi G. Colorectal cancer stem cells:from the crypt to the clinic. Cell Stem Cell. 2014;15:692–705. doi: 10.1016/j.stem.2014.11.012. [DOI] [PubMed] [Google Scholar]
- 42.Zhang X, Cruz FD, Terry M, et al. Terminal differentiation and loss of tumorigenicity of human cancers via pluripotency-based reprogramming. Oncogene. 2013;32:2249–60. doi: 10.1038/onc.2012.237. [DOI] [PMC free article] [PubMed] [Google Scholar]
- 43.Zuccoli G, Marcello N, Pisanello A, et al. Metabolic management of glioblastoma multiforme using standard therapy together with a restricted ketogenic diet:Case Report. Nutr Metab (Lond) 2010;7:33. doi: 10.1186/1743-7075-7-33. [DOI] [PMC free article] [PubMed] [Google Scholar]