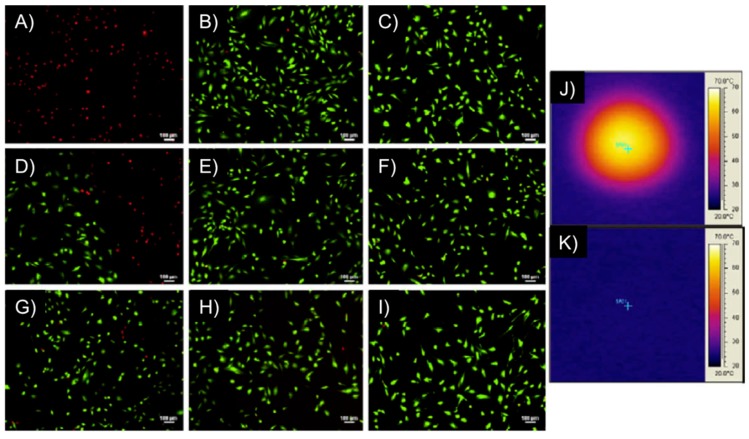
Figure 13.
M059K glioblastoma multiform/hydrogel heating results. Images (A–I) represent fluorescent microscopy images after Live/Dead assay of M059K cells, where (A,B) are at the center of the Petri dish; (D–F) are at the interface between live and dead cells and (G–I) are at the outer edge, unaffected by heat. The first column of images are for cells exposed to a DM gel (50 mol % PEG200MMA, 50 mol % TEGDMA) at 297 kHz and 25 kA/m for 5 min, the middle column are of cells exposed to an AMF only at 297 kHz and 25 kA/m for 5 min and the right column is of cells not exposed to gels or an AMF; Images (J,K) represent IR images after the cells had been heated with the gel for 5 min (J) and exposed to an AMF for 5 min (K). Adapted with permission from reference [62]. Copyright © 2010 Elsevier.

