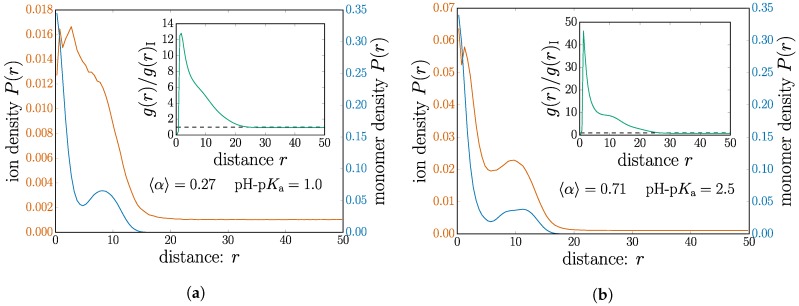
Figure 5.
(Color online) The distributions of ions and monomers around the nanogel center of mass. The inset shows the monomer-ion pair correlation function between the monomers and the mobile ions. The two cases are chosen (a) above and (b) below the Manning parameter. Both subplots have the same salt concentration M.

