Abstract
Objectives
Cortical and cancellous bone healing processes appear to be histologically different. They also respond differently to anti-inflammatory agents. We investigated whether the leucocyte composition on days 3 and 5 after cortical and cancellous injuries to bone was different, and compared changes over time using day 3 as the baseline.
Methods
Ten-week-old male C56/Bl6J mice were randomized to either cancellous injury in the proximal tibia or cortical injury in the femoral diaphysis. Regenerating tissues were analyzed with flow cytometry at days 3 and 5, using panels with 15 antibodies for common macrophage and lymphocyte markers. The cellular response from day 3 to 5 was compared in order to identify differences in how cancellous and cortical bone healing develop.
Results
Between day 3 and 5, the granulocytes increased in the cancellous model, whereas the lymphocytes (T cells, B cells, NK cells) and monocytes (CD11b+, F4/80+, CD206+, CD14+) increased in the cortical model.
Conclusion
These results suggest an acute type of inflammation in cancellous bone healing, and a more chronic inflammation in cortical healing. This might explain, in part, why cancellous healing is faster and more resistant to anti-inflammatory drugs than are diaphyseal fractures.
Cite this article: L. Tätting, O. Sandberg, M. Bernhardsson, J. Ernerudh, P. Aspenberg. Different composition of leucocytes in cortical and cancellous bone healing in a mouse model. Bone Joint Res 2018;7:620–628. DOI: 10.1302/2046-3758.712.BJR-2017-0366.R2.
Keywords: Metaphyseal, Diaphyseal, Cortical, Cancellous, Intramembranous, Fracture
Article focus
Cancellous versus cortical bone healing.
Key messages
The cellular response evolves differently in cancellous and cortical bone healing.
Cancellous healing has a cellular pattern of classical acute inflammation (granulocyte-rich).
Cortical healing has a pattern of classical chronic inflammation (lymphocyte-rich).
Strengths and limitations
Cancellous and cortical bone healing occur normally under vastly different conditions, making them hard to compare. In this study, the models were their own controls.
Flow cytometry is an inherently unstable and operator-dependent method.
One group consisted of only three animals. However, the spread among these three animals was narrow.
Introduction
Most fractures in humans occur in the metaphyses,1 near the joints. This area mainly consists of cancellous bone inside a thin cortical shell. Nevertheless, most studies on bone healing involve fractures of the diaphysis,2 which consists mainly of cortical bone. Much of our descriptive knowledge of normal fracture healing stems from the biomechanics, histology, and immunohistochemistry of diaphyseal fractures in animal models. At the same time, bone healing has revealed itself to be a very complex process involving many different types of immune cells, as well as osteoblasts and osteoclasts. Immune cells implicated in fracture healing include granulocytes,3,4 macrophages,5-8 T cells and B cells,9,10 CD4+ T cells,11,12 CD8+ T cells,13 and regulatory T cells.14 Together, these studies show that bone healing is not governed by any single type of cell, but by an interplay between most parts of the immune system. Again, these data pertain mainly to cortical bone healing. However, there might be important differences between cancellous and cortical bone healing. It has been shown in experimental models that the negative effect of anti-inflammatory agents is far less pronounced on metaphyseal bone healing than on diaphyseal healing.15,16 The reason for this is unclear, but it may be clinically and biologically important.
In this study, we used flow cytometry to examine the overall differences between models of cortical and cancellous bone healing at days 3 and 5 after injury. We compared an injury to the proximal tibia with a mid-femoral cortical defect. The models had equally important factors for the outcome of healing but differed in type of bone tissue (cancellous vs cortical). Both modelled a stable injury to bone without displacement, with free loading, and with minimally damaged soft tissue. Since cancellous and cortical bone healing are too different to be meaningfully compared directly, our aim was to compare changes in cellular composition from day 3 to day 5. This makes each model its own control, and the comparison meaningfully captures which immune cells increase or decrease from day 3 to 5 in each model. We have previously studied the healing of cancellous bone in the proximal mouse tibia using flow cytometry, histology, micro-CT, and biomechanics.17 Here, we report a descriptive study of leucocyte patterns in a comparison of cortical and cancellous healing.
Materials and Methods
All procedures were approved by the Regional Ethics Committee (2012 85-12), governed by the Swedish Animal Welfare Act (1988:534) and EU-Directive 2010/63/EU. In total, 46 ten-week-old C57/Bl6J mice were used for flow cytometry (n = 24), histology (n = 16), and micro-CT (n = 6). The mice were bought from Janvier Labs (Le Genest-Saint-Isle, France) and habilitated for one week before the start of the experiment. They were kept four per cage in a 12-hour day/night cycle with dry food and water ad libitum in our animal facility.
All mice were male, except for those used to examine the histological appearance of bone repair in the metaphyseal group (n = 10), which were female (due to an ordering error). For flow cytometry, mice were randomized to metaphyseal (n = 12) or diaphyseal (n = 12) trauma, representing cancellous and cortical injuries, respectively. Tissue from the traumatized region was harvested at days 3 (n = 6) and 5 (n = 6) after surgery. Histological samples were taken at days 0, 1, 3, 5, and 10 after surgery for the metaphyseal samples, and at days 3, 5, and 10 for the diaphyseal samples (n = 2). Micro-CT samples were taken at days 3, 5, and 10 after surgery (n = 2; only diaphyseal samples).
Surgical models
The mice had a mean weight at the time of surgery of 24 g (sd 1). The cancellous healing model used the proximal right tibia. The mice were given 0.2 mg/kg oxytetracycline subcutaneously for antibiotic prophylaxis, and 0.1 mg/kg buprenorphine subcutaneously for analgesia preoperatively, and were anaesthetized with isoflurane. The leg was shaved and washed with chlorhexidine. Under aseptic conditions, the medial aspect of the right proximal tibial shaft was exposed. A 0.4 mm diameter needle was used to drill a hole through the cortex, approximately 0.6 mm below the epiphysis in a posterolateral direction. A 0.4 mm diameter needle, which was bent like a hook (for details see Tätting et al17), was inserted. The cancellous bone of the metaphysis was traumatized by rotating the needle. The skin was sutured. The mice were given 0.1 mg/kg buprenorphine subcutaneously twice daily for two days after surgery and were killed after three or five days by immediate cervical dislocation without anaesthesia. The tibia was explanted, and the proximal part divided 1 mm distal of the point where the needle had been inserted. The proximal tibia was divided sagittally, and the medullary tissue, distal to the metaphyseal plate, was retrieved using a bent needle as a spoon. The tissue was placed in a support buffer consisting of Roswell Park Memorial Institute (RPMI) 1640 medium, 4% foetal bovine serum (FBS), 5 mM ethylenediaminetetraacetic acid (EDTA), and 25 mM 4-(2-hydroxyethyl)-1-piperazineethanesulfonic acid (HEPES), and was kept on ice.
The cortical healing model used the mid-diaphysis of the femur. The mice were anaesthetized as described above and the leg was shaved and washed with chlorhexidine. The lateral cleavage between the quadriceps and hamstrings was divided to expose the femur. The anterior cortex was removed in a 2 mm long and 1 mm wide section, resulting in a longitudinal furrow through the entire depth of the cortex into the bone marrow. Debris was removed from the cavity using of a bent 0.4 mm needle. The muscles were released to cover the furrow and the skin was sutured. The mice were given 0.1 mg/kg buprenorphine subcutaneously twice daily for two days after surgery. After the mice were killed as described above, the femur was exposed and the tissue filling the furrow was retrieved using a bent needle and placed in a support buffer, and kept on ice.
The tissue was digested with collagenase IV 300 U/ml (Thermo Fisher Scientific, Waltham, Massachusetts) and DNase I 300 U/ml (Roche, Basel, Switzerland) in support buffer, with 20 mM magnesium added, for 20 minutes at 37°C. It was then washed (600 g for six minutes at 4°C for all centrifuge steps) with support buffer and filtered through a 30 µm nylon strainer. The tissue suspension was then washed with staining buffer (BioLegend, San Diego, California). Zombie Red and anti-CD16/32 (BioLegend) were added to stain for dead cells and to block unspecific Fc-binding. The suspension was incubated in the dark on ice for 20 minutes. An aliquot of 1/10 (vol/vol) from each tissue suspension was used to form a pooled sample from the respective tissue of all animals in the group to be used for ‘fluorescence minus one’ (FMO) gating. Thus, each mouse contributed cells to the FMO of each antibody stain. The remaining 9/10 (vol/vol) of cells from each tissue suspension was divided equally into two staining tubes for immune phenotyping. Tissues for flow cytometric analysis were harvested and prepared on the same day.
Staining was performed in two panels (Table I), in the dark on ice for 30 minutes. Cells were then fixed in 2% paraformaldehyde (BioLegend) for 20 minutes at room temperature, followed by washing twice with staining buffer. Cells were stored at 8°C for one day before flow cytometry.
Table I.
Antibodies used in this study
| Conjugate | Titre | Stock, µg/µl | Clone | Company |
|---|---|---|---|---|
| Lymphocytes | ||||
| CD3-PE | 1:200 | 0.2 | 17A2 | BioLegend |
| CD8-PacOr | 1:100 | 0.1 | 5H10 | Life Technologies |
| CD200-APC | 1:100 | 0.2 | OX-90 | BioLegend |
| CD45-FITC | 1:200 | 0.5 | 30-F11 | BioLegend |
| CD19-PB | 1:100 | 0.5 | 6D5 | BioLegend |
| IgM-PE | 1:320 | 0.2 | RMM-1 | BioLegend |
| CD25-PECy7 | 1:200 | 0.2 | PC61 | BioLegend |
| CD4-PerCP/Cy5.5 | 1:200 | 0.2 | RM4-5 | BioLegend |
| NK1.1-AF700 | 1:400 | 0.5 | PK136 | BioLegend |
| Macrophages | ||||
| CD11b-V500 | 1:200 | 0.2 | M1/70 | BD |
| CCR7-PerCP/Cy5.5 | 1:20 | 0.5 | 4B12 | BioLegend |
| CD45-FITC | 1:200 | 0.5 | 30-F11 | BioLegend |
| CD206-AF467 | 1:100 | 0.5 | C068C2 | BioLegend |
| F4/80-PB | 1:1000 | 0.5 | BM8 | BioLegend |
| CD115-PE | 1:2000 | 0.2 | AFS98 | BioLegend |
| CD14-APC/Cy7 | 1:40 | 0.2 | Sa14-2 | BioLegend |
Flow cytometry was performed on a FACS Aria III cell sorter (BD Biosciences, Franklin Lakes, New Jersey) equipped with a purple (405 nm), blue (488 nm), green (561 nm), and red (633 nm) laser. A nozzle of 100 µm was used. Wavelength filters were used as recommended by the manufacturer. Cytometer Setup & Tracking Beads (BD Biosciences) were used to ensure its stability. Compensation was performed with cellular controls from mice, and with VersaComp Beads (Beckman Coulter, Inc., Brea, California), depending on the antigen. Antibodies were titrated for optimal resolution in case of commonly expressed antigens, otherwise the recommended titre from the manufacturer was used.
Gating was set on FMOs for continuously expressed antigens and through visual inspection for discretely expressed antigens. Initial gating was done on singlet cells, live cells, and CD45+ cells to define single living leucocytes. Gating was performed in FlowJo vX.0.7 (Tree Star, Inc., Ashland, Oregon). Data from gating were graphed using a script written in Python v3.4 (Python Software Foundation, Beaverton, Oregon). Gating was done according to Supplementary Figure a.
The SkyScan 1174 micro-CT system (Bruker, Billerica, Massachusetts) was used with a 0.25 mm aluminium filter, 50 kV scan in 180°. The pixel size was 12.4 μm, with rotations step 0.3°, and frame field averaging 3. Corrections were done for beam hardening and ring artefacts using NRecon software (SkyScan version 1.6.8.0).
The histology of the models was prepared for visual guidance in interpretation of the flow cytometric results. The tibiae and femurs were fixed in 4% formaldehyde, decalcified in 10% formic acid, dehydrated in a series of increasing concentrations of ethanol, and embedded in paraffin. The tibiae were sectioned longitudinally and the femurs transversely in sections 4 µm thick, which were stained with haematoxylin and eosin (H&E). Ten female mice were used for histology of the cancellous model. Two mice were killed immediately after surgery (day 0) and the others at days 1, 3, 5. For the cortical model, six male mice were used; two were killed at days 3, 5, and 10, respectively.
Statistical analysis
All statistics were calculated for descriptive purposes. No hypotheses were tested, hence no p-values are presented. Data for cell populations were expressed as fraction of singlet/scatter/live/CD45+ cells (leucocytes). Confidence intervals (CI) were calculated using a Student’s t-test with Welch’s correction for unequal variances (R Version 3.4; The R Foundation, Vienna, Austria).
Results
Three of six mice in the femoral surgery group were killed on day 3 due to a complete femoral fracture. There were no other adverse events or exclusions. Examples of gating are shown in Supplementary Figures b and c. One third of the leucocytes were not part of the analysis, mainly as a result of a population with low CD45 expression and events between gates. The low CD45 population was almost exclusively positive for CD19, but to a large extent negative for immunoglobulin M (IgM) (Supplementary Fig. b). These cells were presumed to be immature B cells.
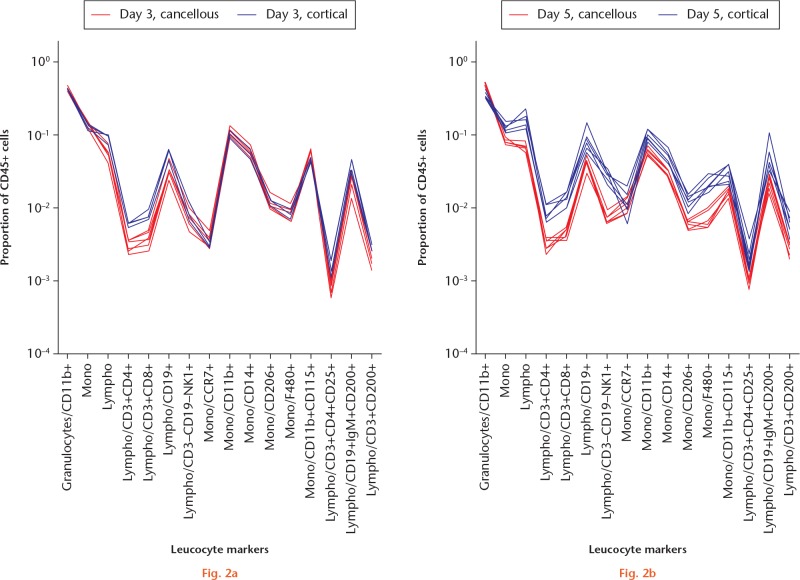
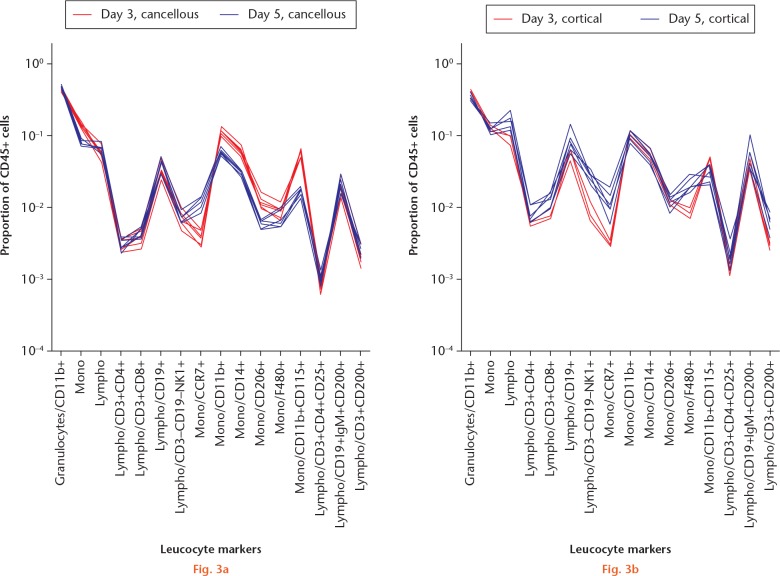
The major leucocyte subpopulations in the cancellous and cortical models were surprisingly similar on day 3 (Figs 1 and 2a). On day 3, in both models, the leucocytes were dominated by granulocytes, with fewer monocytes and still fewer lymphocytes. On day 5, the major populations had developed in different directions. In the cancellous bone, the proportion of granulocytes had increased at the expense of monocytes (Fig. 3a). In contrast, lymphocytes had increased in the cortical model at the expense of granulocytes (Fig. 3b).
Fig. 1.
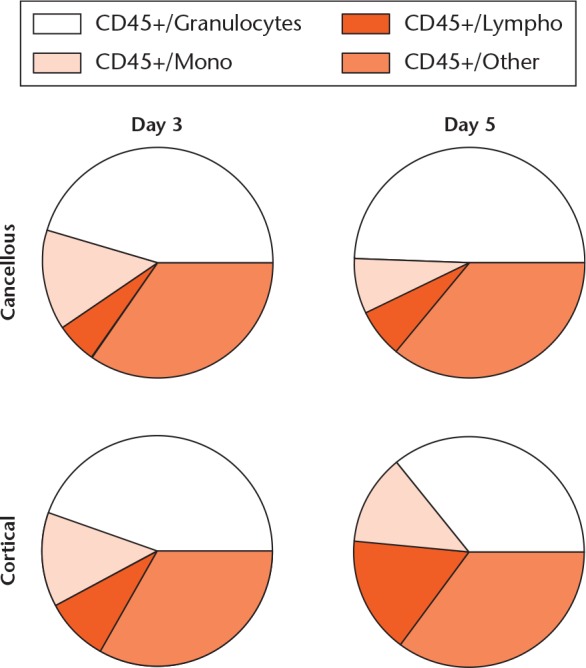
Major cell populations in the cancellous and cortical models at days 3 and 5. Major populations were gated from Doublet/Live/CD45+ positive cells. ‘CD45+/Other’ denotes cells that fell between gates or were weakly CD45+ positive; presumably mainly immature B cells. For the cortical model at day 3, n = 3/6; for the other groups, n = 6/6.
Graphs showing comparison of a) the traumatized proximal tibia (cancellous) and b) the femoral cortical defect (cortical) models for different timepoints. Regenerating tissue was analyzed with flow cytometry. Day 3: each red line indicates a mouse with a cancellous injury (n = 6/6) and each blue line represents one with a cortical defect (n = 3/6). At this timepoint, red and blue lines tend to overlap, indicating a generally similar pattern. Major cell populations were gated from singlet/scatter/live/CD45+ cells and subpopulations gated as shown along the x-axis. Each subpopulation is shown as a fraction of the total leucocyte count (singlet/scatter/live/CD45+ cells) on a logarithmic scale.
Graphs showing comparison of a) the traumatized proximal tibia (cancellous) and b) the femoral cortical defect (cortical) models at different timepoints (days 3 and 5). Regenerating tissue from the traumatized proximal tibia was analyzed with flow cytometry. Leucocyte ‘signatures’ can be seen in the cancellous model. Each animal is represented by a line, day 3 (red) and 5 (blue). Regenerating tissue from the mid-femoral diaphysis was analyzed and presented as above. For day 3, n = 3/6. Major cell populations were gated from singlet/scatter/live/CD45+ cells and subpopulations gated as shown along the x-axis. Each subpopulation is shown as a fraction of the total leucocyte count (singlet/scatter/live/CD45+ cells) on a logarithmic scale.
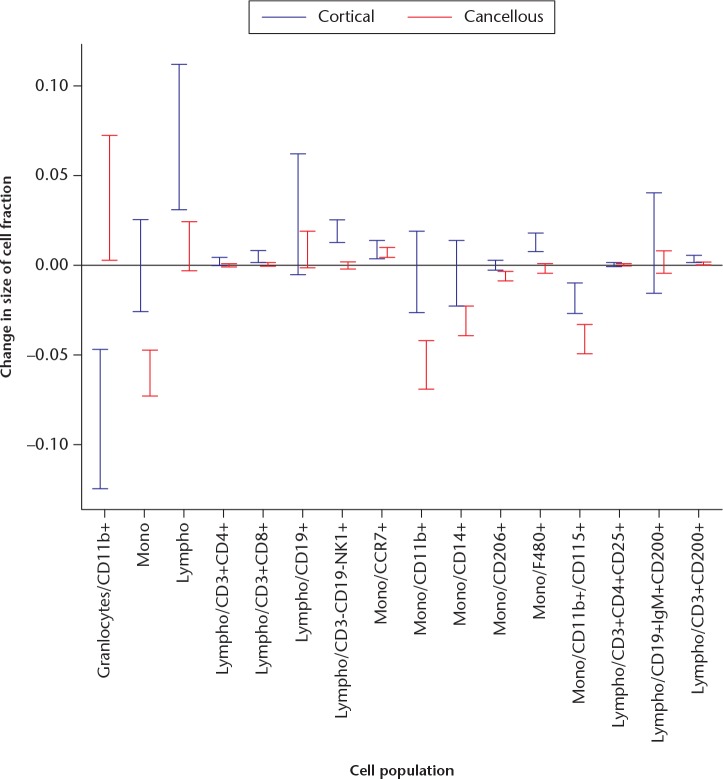
In order to see the detailed differences between the models clearly, data were plotted as a line for each mouse. These plots describe the leucocyte composition graphically for each animal. At day 3, both models showed a similar leucocyte composition, although the data could suggest less frequent T-helper and T-cytotoxic lymphocytes in the cancellous model (Fig. 2a). At day 5, the leucocyte composition was noticeably different between the models (Fig. 2b). In the cancellous model, a higher proportion of granulocytes had made virtually all other cell populations less frequent except for CCR7+ monocytes and macrophages, compared with the cortical model. In order to see whether there were other differences in the pattern, all cell populations were related to all non-granulocyte CD45+ cells (CD45+ cells minus granulocytes). Several differences remained (Fig. 4). The cellular response at the cancellous site still showed a smaller proportion of all lymphocytes compared with the cortical site. Confidence intervals (CIs) for the changes in the proportions of leucocytes are shown in Figure 5.
Fig. 4.
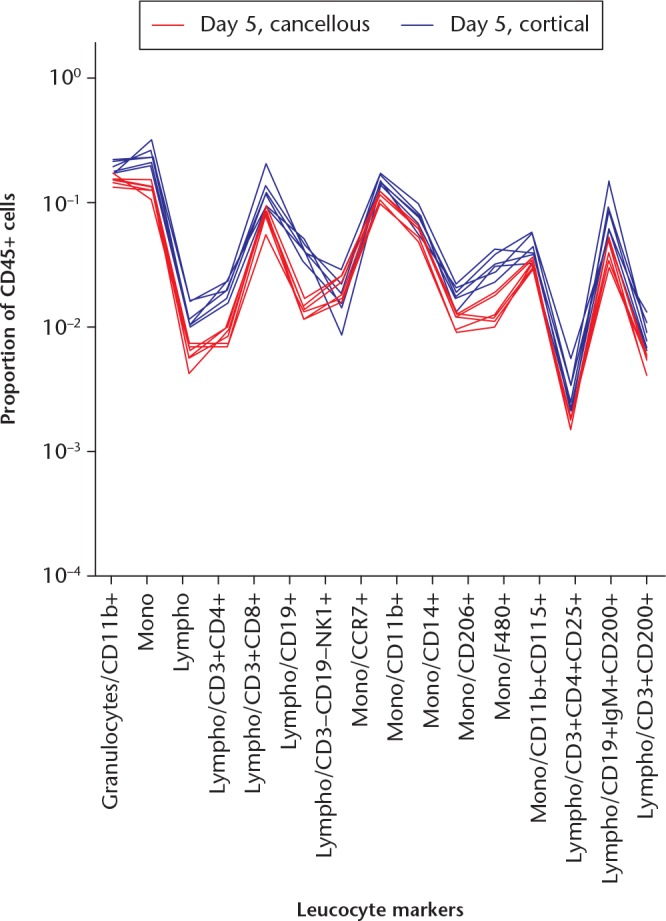
A graph showing cellular responses in the cancellous and cortical models at day 5 adjusted for the increase in granulocytes in the cancellous model. Markers were related to the sum of CD45+ cells (doublet/live/CD45+) subtracted by the granulocyte count (doublet/live/CD45+ minus doublet/live/CD45+/granulocyte-). Each red line indicates a mouse with cancellous injury and each blue line indicates a mouse with a cortical defect. The differences in cell populations remain after taking the difference in numbers of granulocytes into account.
Fig. 5.
A graph showing the change in the size of the cell fraction for each subpopulation from day 3 to day 5 in the cancellous and cortical models, with 95% confidence intervals. For example, granulocytes/CD11b+ (far left) decreased by 5% to 15% in the cortical model (blue), but increased by 0.5% to 7% in the cancellous model (red).
Principal component analysis
A supplementary principal component analysis was undertaken to see if the results withstood an unsupervised methodology (Supplementary Figs da and db). The analysis revealed a first principal component to consist mainly of lymphoid cell populations and granulocytes, and a second principal component to consist of monocytes. The main difference between the models from day 3 to 5 was in the first principal component, where they moved in opposite directions, corresponding to an increase of lymphoid cells in the cortical model and an increase of granulocytes in the cancellous model.
Micro-CT
In the cortical model, there was little mineralization in the defect at days 3 and 5, and substantially more at day 10 (Fig. 6). Previous studies using the metaphyseal model have shown substantial bone formation already on day 5.17
Fig. 6.
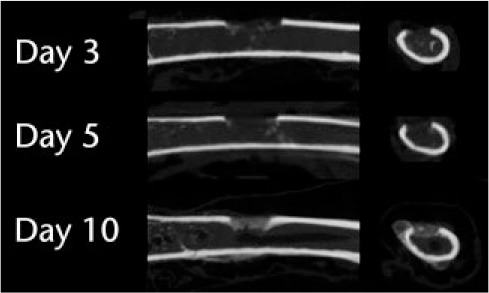
Micro-CT images of the model of the defect in the tibial shaft show little mineralization on days 3 and 5 but more by day 10.
The cortical model at day 3 showed mainly debris, some haematoma, and scattered, weakly stained cells in most of the marrow (Fig. 7). At day 5, a dense, strongly stained, seemingly haematopoietic bone marrow had been restored in much of the volume. At the place of the removed cortex there was a layer of bigger, somewhat spindle-shaped paler cells that could be of mesenchymal origin, but there was no clearly visible extracellular matrix (ECM). At day 10, this same region contained woven bone with a sharp demarcation from the marrow. Thus, one gets the impression that marrow cells had invaded a large part of the traumatized region without leading to any bone formation, whereas bone was formed only in or near the plane of the removed cortex.
Fig. 7.
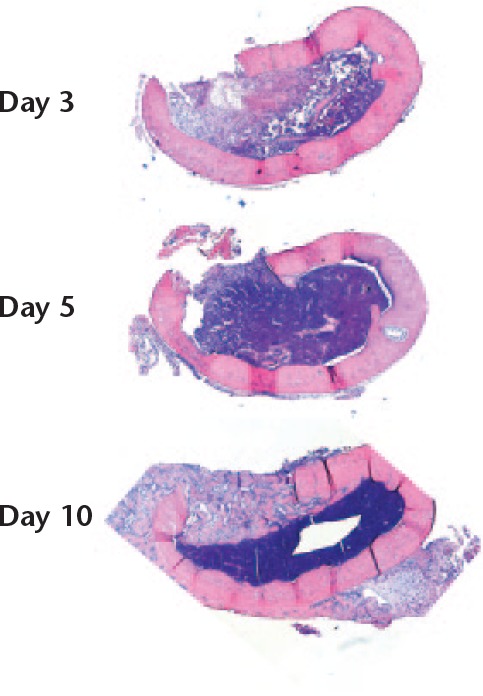
Coronal sections of the femur. A longitudinal defect was created (upwards in the images). There was increasing cellularity of the bone marrow from days 3 to day 5. Immature bone filled the cortical gap by day 10, with a sharp demarcation from the regenerating marrow. Magnification 16×, haematoxylin and eosin.
In contrast, the changes observed in the cancellous model occurred homogeneously and more quickly in the traumatized region (Fig. 8). Mesenchymal-looking cells (spindle-shaped, larger with weaker staining) dominated already at day 3 and woven bone was abundant at day 5.
Fig. 8.

The proximal tibia, traumatized with the nook of a needle. Frontal sections. Day 0 represents immediately following trauma. The traumatized area is approximately centred in all pictures. At days 0 and 1, a haematoma can be seen extending well beyond the zone of the initial trauma. At day 5, the traumatized region is filled with woven bone. At day 10, there has been some remodelling. Magnification 4×, haematoxylin and eosin.
Discussion
This study showed striking similarities between the models for cancellous and cortical healing for major types of leucocyte by day 3, followed by increasing differences by day 5. Granulocytes increased in proportion in cancellous healing, whereas lymphocytes increased in cortical healing. However, the difference appeared more obvious when comparing the pattern of many cell types, rather than when comparing single cell populations. Micro-CT and histology showed that bone formation came later in the femoral diaphysis than in the tibial metaphysis. It is unclear why this is so. The similar patterns of leucocytes at day 3, while showing a marked difference at day 5, argue against a simple shift of an otherwise similar process between the tissues in favour of an actual difference in patterns of healing. The timepoints in the current study were chosen from experience in a previous study,17 where we noted that bone formation was visible at day 5 in the cancellous model. In the current study, no data were collected in a later phase of bone healing than day 5. The results thus represent an early phase with the beginning of bone formation. For practical reasons, the cortical model could not be studied at day 1 as the cellular material was too scarce. It was thought that there would be enough cells for flow cytometric analysis at days 3 and 5 and that the transition from inflammation to bone formation could be measured.
Cancellous bone healing appears to be specifically characterized by fast differentiation of stromal cells in the marrow into osteoblasts, without the need for pre-existing bone surfaces for the supply of cells or support.18 In contrast, cortical healing probably involves the contribution of mesenchymal cells recruited from other sources, and inflammatory cells are probably responsible for attracting these cells and regulating their behaviour. Fine control of inflammation is managed by specialized lymphocytes and the increase in lymphocytes in the diaphysis from day 3 to 5 could represent such local control.
The difference in the fraction of granulocytes between cancellous and cortical healing has not been previously reported. In a diaphyseal mouse model, depletion of granulocytes led to impaired mechanical healing.3,4 This may be due to inhibited recruitment of monocytes.4 In our experiment, the higher influx of granulocytes and monocytes in the cancellous model indicates a more aggressive inflammatory environment compared with the diaphyseal model. Earlier studies by our group showed that the cancellous model formed bone in spite of anti-inflammatory treatment with dexamethasone and indomethacin, while healing was impaired by the same drugs in a diaphyseal model.15,16 These drugs were chosen for their broad effect on inflammation. However, granulocytes in particular have been shown to increase their superoxide production in response to certain antigens after incubation with indomethacin.19 It is possible that the higher presence of granulocytes either makes the tissue more resistant to, or compensates for, the effects of these anti-inflammatory drugs.
Regarding lymphocytes, our results complement the understanding of bone healing, in that available experimental models on lymphocytes in diaphyseal fractures mainly indicate that they are detrimental. Mice devoid of T and B cells (Rag-/-) have shown improved healing of diaphyseal fractures.9 Mice devoid of gamma/delta (γδ) T-cells have been reported to have a better outcome,20 although this is a small subpopulation of lymphocytes. It has also been shown that a CD8+ effector memory T cell subgroup is related to delayed bone healing in humans.13 The increasing numbers of lymphocytes over time in our cortical healing model suggest a possible regulatory role for these cells. As other studies have suggested the same cells to be detrimental, it seems likely that they regulate bone healing in a yet undetermined manner. Connections between lymphocytes and osteogenesis have also been shown. For example, Th17 lymphocytes have been shown to enable osteoblast development,12 but the complete interactions between lymphocytes and bone formation is still unknown.
Cancellous bone healing mainly occurs in metaphyseal areas and cortical healing in diaphyseal areas of long bones. Because of this, anatomical factors may also affect the outcome of healing. Diaphyseal femoral fractures in mice have been shown to recruit nearby muscle stem cells by means of tumour necrosis factor alpha (TNF-α),21 suggesting a scarcity of local cells. In contrast, local stem cells are probably sufficiently abundant in the metaphysis.22 Another difference is that diaphyseal fractures are inherently unstable, whereas metaphyseal fractures are usually stable. Our models aimed to reduce such differences as much as possible in order to isolate cancellous and cortical healing. Both models were stable, had minimal damage to surrounding soft tissue, allowed free loading of animals, and included as little as possible of the other mode of healing (cancellous or cortical).
One problem with the cancellous versus cortical comparison in this study is that while the cancellous lesions appeared homogeneous, there was a tendency in the cortical lesion towards a division in the subvolumes for future marrow and bone at day 5, which both contributed cells for flow cytometry.
The small number of histological specimens allowed no quantification of histological outcomes. Histology was performed to show that bone formation took place in the models and to give a visual correlation to flow cytometry. Both models were visualized with histology at days 3 and 5 as a guide to the interpretation of flow cytometric data. In the cortical model, it was known that no bone formation would take place before day 3 and no histology was performed days 0 or 1 in this model. Importantly, histology showed that bone formation took place in the models and gave a histological correlation to the tissues captured for flow cytometry.
Flow cytometry is inherently biased by the operator. In this study, all cell preparation and gating were performed by the same author, for consistency. We only had three mice on which to perform flow cytometry in the cortical model at day 3, which, from a statistical perspective, is small. However, the intragroup variation among these animals was still small enough to distinguish differences between the models clearly. We used many markers targeting the same phenotype (e.g. CD11b, CD14, and F4/80) for macrophages. This adds strength to the results as markers for the same phenotype were expressed in concordance. This can also be seen in the supplementary principal component analysis where, for example, all macrophage markers are sole contributors to the second principal component. The choice of CD200 as a marker of bone healing is unusual. It was chosen as it has been shown to downregulate macrophages,23 which are essential to bone healing.24
We used a mouse model to study cancellous and cortical bone healing. Mice have been used extensively in studies of bone biology, with findings that can be applied to humans.25 However, as with all preclinical research using animals, our data need to be validated using material from fractures in humans for clinical conclusions to be drawn. If our data were replicated in humans, some of the implications would include a more biologically orientated approach to fracture healing to complement the mechanical principles that dominate today.
Histology of the cancellous model was made on female mice, while all other data were collected from males. This was due to an ordering error and is a limitation that was not planned. However, we do not believe this to have had any discernible impact on the results. All quantified variables in this study are from male mice. The young age of the mice (ten weeks) makes it unlikely that the use of female mice for histology would contribute a significant difference to what would have been obtained with male mice alone.
In summary, our data show that the composition of leucocytes in cortical and cancellous healing diverges between days 3 and 5 after injury. As most fractures have a considerable involvement of cancellous bone, a better understanding of fracture healing will require more study of repair processes in such bone.
Footnotes
Author Contributions: L. Tätting: Designed the study, Collected and analyzed the data.
O. Sandberg: Performed the surgeries, Designed the study, Retrieved the samples.
M. Bernhardsson: Performed the microCT scans and histology.
J. Ernerudh: Interpreted the data.
P. Aspenberg: Designed the study, Wrote the manuscript.
Conflict of Interest Statement: None declared
Follow us @BoneJointRes
Supplementary material
The gating process followed in this study, examples of gating, and principal component analysis.
Funding Statement
This study was funded by the Swedish Research Council (VR 02031-47-5), European Community’s Seventh Framework Programme (FP7/2007-2013) under grant agreement N° 279239.
References
- 1. Singer BR, McLauchlan GJ, Robinson CM, Christie J. Epidemiology of fractures in 15,000 adults: the influence of age and gender. J Bone Joint Surg [Br] 1998;80-B:243–248. [DOI] [PubMed] [Google Scholar]
- 2. Mills LA, Simpson A. In vivo models of bone repair. J Bone Joint Surg [Br] 2012;94-B:865–874. [DOI] [PubMed] [Google Scholar]
- 3. Kovtun A, Bergdolt S, Wiegner R, et al. The crucial role of neutrophil granulocytes in bone fracture healing. Eur Cell Mater 2016;32:152–162. [DOI] [PubMed] [Google Scholar]
- 4. Chan JK, Glass GE, Ersek A, et al. Low-dose TNF augments fracture healing in normal and osteoporotic bone by up-regulating the innate immune response. EMBO Mol Med 2015;7:547–561. [DOI] [PMC free article] [PubMed] [Google Scholar]
- 5. Chang MK, Raggatt L-J, Alexander KA, et al. Osteal tissue macrophages are intercalated throughout human and mouse bone lining tissues and regulate osteoblast function in vitro and in vivo. J Immunol 2008;181:1232–1244. [DOI] [PubMed] [Google Scholar]
- 6. Vi L, Baht GS, Whetstone H, et al. Macrophages promote osteoblastic differentiation in-vivo: implications in fracture repair and bone homeostasis. J Bone Miner Res 2015;30:1090–1102. [DOI] [PubMed] [Google Scholar]
- 7. Alexander KA, Chang MK, Maylin ER, et al. Osteal macrophages promote in vivo intramembranous bone healing in a mouse tibial injury model. J Bone Miner Res 2011;26:1517–1532. [DOI] [PubMed] [Google Scholar]
- 8. Wu AC, Raggatt LJ, Alexander KA, Pettit AR. Unraveling macrophage contributions to bone repair. Bonekey Rep 2013;2:373–377. [DOI] [PMC free article] [PubMed] [Google Scholar]
- 9. Toben D, Schroeder I, El Khassawna T, et al. Fracture healing is accelerated in the absence of the adaptive immune system. J Bone Miner Res 2011;26:113–124. [DOI] [PubMed] [Google Scholar]
- 10. Könnecke I, Serra A, El Khassawna T, et al. T and B cells participate in bone repair by infiltrating the fracture callus in a two-wave fashion. Bone 2014;64:155–165. [DOI] [PubMed] [Google Scholar]
- 11. Sato K, Suematsu A, Okamoto K, et al. Th17 functions as an osteoclastogenic helper T cell subset that links T cell activation and bone destruction. J Exp Med 2006;203:2673–2682. [DOI] [PMC free article] [PubMed] [Google Scholar]
- 12. Nam D, Mau E, Wang Y, et al. T-lymphocytes enable osteoblast maturation via IL-17F during the early phase of fracture repair. PLoS One 2012;7:e40044. [DOI] [PMC free article] [PubMed] [Google Scholar]
- 13. Reinke S, Geissler S, Taylor WR, et al. Terminally differentiated CD8+ T cells negatively affect bone regeneration in humans. Sci Transl Med 2013;5:177ra36. [DOI] [PubMed] [Google Scholar]
- 14. Zaiss MM, Axmann R, Zwerina J, et al. Treg cells suppress osteoclast formation: a new link between the immune system and bone. Arthritis Rheum 2007;56:4104–4112. [DOI] [PubMed] [Google Scholar]
- 15. Sandberg O, Aspenberg P. Different effects of indomethacin on healing of shaft and metaphyseal fractures. Acta Orthop 2015;86:243–247. [DOI] [PMC free article] [PubMed] [Google Scholar]
- 16. Sandberg OH, Aspenberg P. Glucocorticoids inhibit shaft fracture healing but not metaphyseal bone regeneration under stable mechanical conditions. Bone Joint Res 2015;4:170–175. [DOI] [PMC free article] [PubMed] [Google Scholar]
- 17. Tätting L, Sandberg O, Bernhardsson M, Ernerudh J, Aspenberg P. Isolated metaphyseal injury influences unrelated bones. Acta Orthop 2017;88:223–230. [DOI] [PMC free article] [PubMed] [Google Scholar]
- 18. Aspenberg P, Sandberg O. Distal radial fractures heal by direct woven bone formation. Acta Orthop 2013;84:297–300. [DOI] [PMC free article] [PubMed] [Google Scholar]
- 19. Gay JC, English D, Lukens JN. Stimulation of neutrophil oxidative metabolism by indomethacin. Agents Actions 1985;16:336–341. [DOI] [PubMed] [Google Scholar]
- 20. Colburn NT, Zaal KJM, Wang F, Tuan RS. A role for gamma/delta T cells in a mouse model of fracture healing. Arthritis Rheum 2009;60:1694–1703. [DOI] [PMC free article] [PubMed] [Google Scholar]
- 21. Glass GE, Chan JK, Freidin A, et al. TNF-alpha promotes fracture repair by augmenting the recruitment and differentiation of muscle-derived stromal cells. Proc Natl Acad Sci U S A 2011;108:1585–1590. [DOI] [PMC free article] [PubMed] [Google Scholar]
- 22. Siclari VA, Zhu J, Akiyama K, et al. Mesenchymal progenitors residing close to the bone surface are functionally distinct from those in the central bone marrow. Bone 2013;53:575–586. [DOI] [PMC free article] [PubMed] [Google Scholar]
- 23. Hoek RM, Ruuls SR, Murphy CA, et al. Down-regulation of the macrophage lineage through interaction with OX2 (CD200). Science 2000;290:1768–1771. [DOI] [PubMed] [Google Scholar]
- 24. Sandberg OH, Tätting L, Bernhardsson ME, Aspenberg P. Temporal role of macrophages in cancellous bone healing. Bone 2017;101:129–133. [DOI] [PubMed] [Google Scholar]
- 25. Haffner-Luntzer M, Kovtun A, Rapp AE, Ignatius A. Mouse models in bone fracture healing research. Curr Mol Bio Rep 2016;2:101–111. [Google Scholar]


