Abstract
Spatial analysis of gene localization using fluorescent in-situ hybridization (FISH) labeling is potentially a new method for early cancer detection. Current methodology relies heavily upon accurate segmentation of cell nuclei and FISH signals in tissue sections. While automatic FISH signal detection is a relatively simpler task, accurate nuclei segmentation is still a manual process which is fairly time consuming and subjective. Hence to use the methodology as a clinical application, it is necessary to automate all the steps involved in the process of spatial FISH signal analysis using fast, robust and accurate image processing techniques. In this work, we describe an intelligent framework for analyzing the FISH signals by coupling hybrid nuclei segmentation algorithm with pattern recognition algorithms to automatically identify well segmented nuclei. Automatic spatial statistical analysis of the FISH spots was carried out on the output from the image processing and pattern recognition unit. Results are encouraging and show that the method could evolve into a full fledged clinical application for cancer detection.
I. INTRODUCTION
Analysis of preferential gene localization is a promising area in genome biology [1], [2] and is emerging as a method for cancer detection [3]. Localization of the genes in interphase nuclei has implications for their function, such as transcriptional activity, and they can relocate depending on physiological and pathological situations. Hence as a method to detect cancer, attempts are being made to differentiate between normal and cancerous tissue sections depending on preferential gene localization. Target genes are fluorescent in-situ hybridization (FISH) labeled and nuclei counterstained in tissue sections. They are imaged using microscopy. Next the nuclei in these tissue section images are segmented and spatial statistical analysis of the FISH signal locations is carried out. Manual processing of the tissue sections have shown considerable promise in differentiating normal and cancerous tissue sections [3]. However the high manual processing time prohibits its use as a clinical application. A fast, robust and accurate automatic procedure is essential for performing nuclear segmentation, FISH segmentation and spatial statistical analysis.
Segmentation [4], [5], [6] of cell nuclei in tissue images is the first step in the workflow and there is no universal method that can be used. Developing a completely automatic method for nuclei segmentation is a big challenge and requires the use of a combination of advanced image processing and pattern analysis methods to produce satisfactory results. The task of segmenting nuclei for this application is uniquely different to other tasks. On the one hand there is considerable variation in size and morphological features of the nuclei because of the inherent difference between normal and cancerous tissues and truncation of the nuclei by the physical sectioning of the tissue. We believe that these variations significantly exceed variations due to differences in cell stages. On the other hand many more nuclei are imaged than are needed for analysis, enabling us to emphasize on highly accurate segmentation of a subset of nuclei rather than attempting to segment as many nuclei as possible. The texture makes it difficult to distinguish between the boundary intensity variations and inside texture variations while variation in shape, size and other morphological cues used by image analysis and pattern recognition algorithms [7] to identify and segment good nuclei makes it difficult to identify well segmented nuclei.
Above difficulties have led us to use a hybrid data driven segmentation algorithm along with an intelligent supervised pattern classification system to accurately segment a subset of nuclei. Another unique feature of our approach is the use of the intelligent pattern analysis system combining output of multiple classifiers [8] to select the accurately segmented nuclei. The classifier keeps learning the features of additional manually segmented nuclei. The individual nuclei thus obtained are then used for automatic FISH segmentation and spatial statistical analysis.
II. Samples and Images
For FISH labeling 4–5μm thick formalin fixed, paraffin embedded human normal and cancerous breast tissue sections were used. The detailed information of the tissue sections used and FISH labeling procedure is available in [3]. The sections were imaged using an Olympus IX70 microscope controlled by a Deltavision System (Applied Precision) with SoftWORX 3.5.1 (Applied Precision) and fitted with a charge-coupled device camera (CoolSnap; Photometrics), using a 60X, 1.4 oil objective lens and an auxiliary magnification of 1.5. 3-D Z-stacks were acquired with a step size of 0.2 or 0.5 μm. The image pixel resolution was 1024 × 1024, with a pixel size of 0.074 μm per pixel in both X and Y direction. For nuclear segmentation maximum intensity projections (MIP) of the original DAPI (blue) channel were used, while the red and green FISH channels were deconvolved using SoftWORX 3.5.1. Analyzed cells were chosen randomly and were heterogenous with respect to their differentiation state and cell cycle phase.
The nuclei were in slightly different focal planes in the tissue. However since the tissue sections were 4–5 μm thick, the resolution and accuracy of the analysis was not affected by the variation in focal depth. Also use of MIPs of the image stacks alleviated the problem.
III. Nuclei segmentation and identification
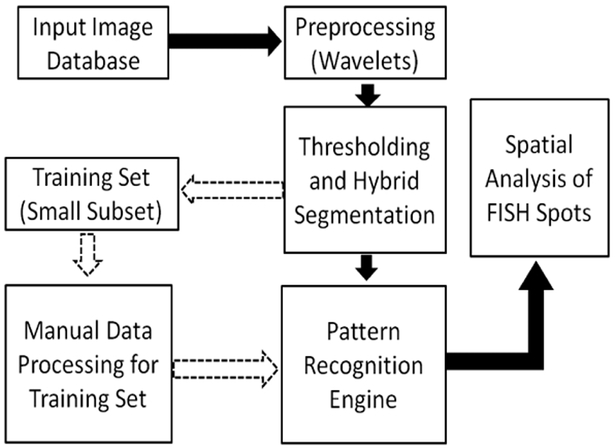
Fig. 1 shows the block diagram of the proposed image analysis framework.
Fig. 1.
System Block Diagram
A. Wavelet Based Preprocessing
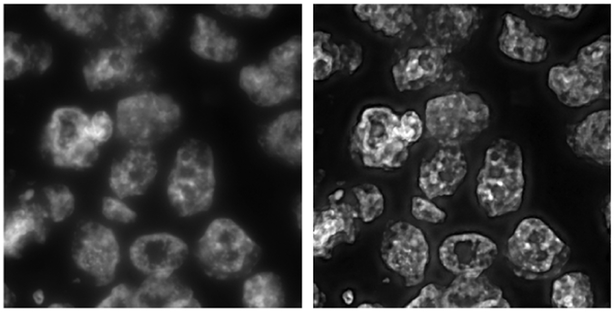
The preprocessing step involved use of wavelet based enhancement of the object boundaries using LastWave toolbox [9]. The method involved storing the “edges” in the image using a chain coded extrema representation and selectively enhancing the edges in different spatial scales using an user-defined factor. We used a bi-cubic spline wavelet to analyze the edges upto 5 scales and the edges (extrema) in scales 2 to 4 were multiplied by a factor of 3. On reconstruction the images showed well enhanced object boundaries as shown in Fig. 2. Though this step accentuated the inside texture of the nuclei, the advantage offered by the boundary enhancement overshadowed this shortcoming of the procedure.
Fig. 2.
(a) Original blue DAPI channel (b) Wavelet based preprocessing output
B. Thresholding and Hybrid Segmentation Algorithm
The contrast enhanced images were binarized using a combination of the isodata and triangle thresholding algorithms available in DIPImage [10]. Morphological operations of binary closing and opening along with a size based screening removed small objects resulting from noisy background and texture within the nuclei.
Labeling the foreground objects in the processed thresholded image provided a good indication of the regions containing the nuclei in the image. However, the boundaries of the nuclei in the thresholded image were inaccurate and were not satisfactorily close to the actual object boundaries. To further improve the boundary accuracy a level set [11] based algorithm was used in which each individual boundary from the thresholding operation evolved tightly around the visually perceived object boundaries. This method was a variational formulation for geometric active contours that forced the level set to be close to a signed distance function. The formulation consisted of an internal energy term that penalized the deviation of the level set function from a signed distance function and an external energy term in the form of the image gradient magnitude that drove the motion of the zero level set towards desired image features. Considering ϕ as a signed distance function plus a constant
| (1) |
is a metric to measure how close ϕ is to a signed distance function in The variational formulation is
| (2) |
where μ > 0 controls the effect of penalizing the deviation of ϕ from a signed distance transform. εm(ϕ) is the energy term that drives the motion of the zero level curve of ϕ. The evolution equation
| (3) |
is the gradient flow that minimizes the overall energy functional ε.
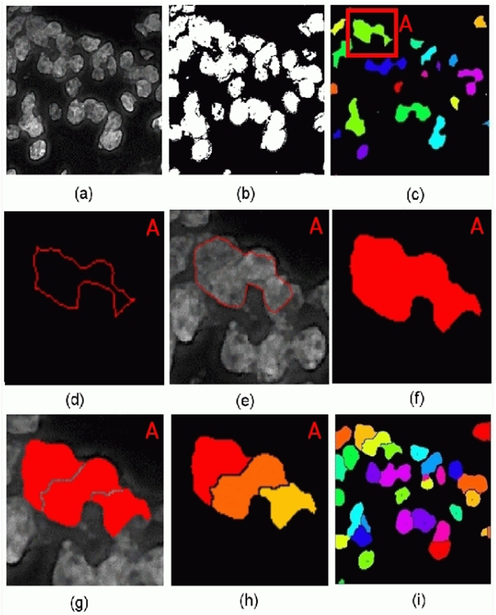
Until this point no effort was made to separate clustered nuclei and the level set evolved object boundaries surround clusters of nuclei in a number of cases. The next step attempted to break up the nuclei clusters into individual nuclei using the watershed algorithm [10]. As a post processing step the fragments of the watershed output were merged using a preset size value of nuclei. To improve the segmentation and detection accuracy of the algorithm the size parameter should dynamically adjust to the nuclei size. Fig. 3 shows the intermediate results for the segmentation procedure.
Fig. 3.
(a) Original DAPI channel after preprocessing (b) Thresholded image (c) Labeled image after morphological operations showing the input seeds for the level set segmentation algorithm with a single seed highlighted in red box A (d) Initial contour for level set algorithm for A (e) Level set evolved contour overlayed on the DAPI channel for A (f) Binary version of the evolved level set contour for A (g) Output image after applying watershed segmentation algorithm on the level set output region for A (h) Labeled version of the watershed output for A (i) Final segmentation on the entire image using the hybrid segmentation algorithm
At this point, although we used the level set and watershed algorithm for performing the segmentation, they can be replaced by any other segmentation algorithm. For instance, we have also experimented using graph based segmentation [12] methods which give better segmentation results under certain circumstances (data not shown).
C. Pattern Recognition Engine
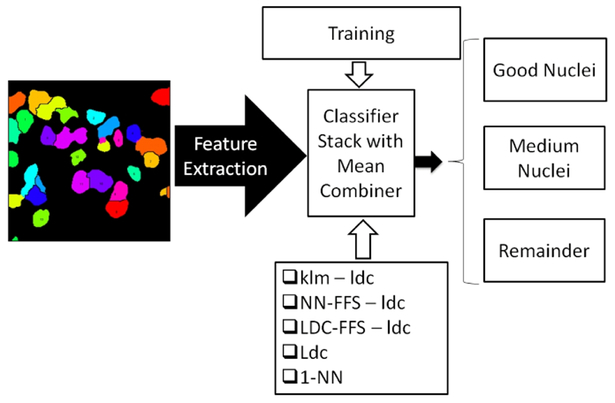
The pattern recognition engine selected the subset of accurately segmented nuclei. Fig. 4 shows the framework. We used a supervised classifier and the training was done on a subset of 5 segmented images from each of the 9 tissue section datasets. This was about 25% of the entire dataset. The training set was carefully selected so that the classifier encountered all feature variations in the dataset. The training set was further partitioned such that 80% was to be used as training set and the remaining 20% as validation set. The segmented objects in the training and validation set were manually classified into 3 classes: ‘Good Nuclei’ (nuclei segmented almost perfectly), ‘Medium Nuclei’ (nuclei having small boundary inaccuracies) and the ‘Remainder’ (objects never used for subsequent analysis).
Fig. 4.
Pattern recognition module showing the stacked classifier for identifying nuclei that can be used for the FISH analysis
For any pattern recognition engine to work well, the feature space used for representing the object features has a vital role to play. In this case shape (perimeter to area ratio, Feret diameters), texture (mean intensity, intensity standard deviation), size (size, perimeter) and other morphological cues were used as the feature set to identify a well segmented nuclei. The dimensionality of the feature space was 24.
Fig. 4 shows the stacked classifier combining: (i)linear discriminant classifier on a principal component analysis reduced space capturing 95% of the variance(klm-ldc); (ii)linear discriminant classifier on the best 3 features selected by 1 nearest neighbor leave-one-out error(NN-FFS-ldc); (iii)linear discriminant classifier on the best 3 features selected by linear discriminant classifier leave-one-out error(LDC-FFS-ldc); (iv)linear discriminant classifier(Ldc); and (v)1-Nearest neighbor classifier(1-NN). The stacked classifier was used to harness the feature extraction power of all the classifiers which often show a complementary discriminating behavior. The classifier was trained on the manually classified training set and then validated on the validation set to identify the combiner to be used for the stacked classifier. Product, mean, median, maximum, minimum and voting combiners [8] were tested. Mean combiner performed the best among the 6 providing 93% correct classification on the validation set.
Our simulations with the training and validation set showed that the stacked classifier performed better than the individual classifiers. One major aim of this work was to design the pattern recognition engine so that it can identify the well segmented nuclei with a high degree of accuracy and confidence, since the immense variation in nuclear features makes it practically impossible to accurately segment every nucleus in an image.
IV. Spatial Analysis of FISH Signals
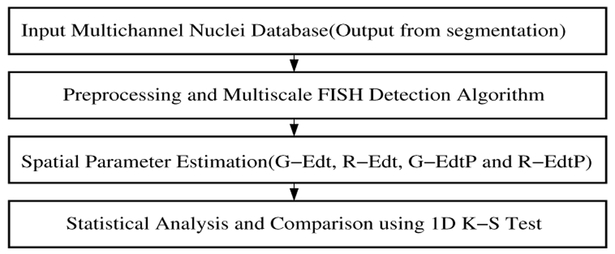
Spatial analysis of FISH signals is shown in Fig. 5. Details of the procedure can be found in [13]. FISH signals were segmented using a multiscale Gaussian filtering and enhancement scheme. Radial position of the spots were then calculated using a shape independent Euclidean distance transform (EDT) based metric. Once the spots were located and their radial position identified, 4 parameters were used to quantify the spatial position of the gene spots. They were GEdt, R-Edt (Green and Red spot EDT metric), G-EdtP and R-EdtP (probabilistic measure for the green and red spots to be near the nuclear periphery). 1-D Kolmogorov-Smirnov Test (K-S Test) was used to compare the spatial distribution of the genes to uniform random distribution of points in the nuclei. Spatial randomness or non-randomness of the gene spots was used to predict whether the spatial localization of that gene can be used for cancer detection.
Fig. 5.
FISH segmentation and analysis module
V. Experiments and Results
Experiments for evaluating the performance of the automatic method were done in three stages resulting in 3 sets of outputs which differ in their degree of automation. The sets were the following: NMFM (Nuclei selection manual, FISH screening manual), NMFA (Nuclei selection manual, FISH screening automatic) and NAFA (Nuclei selection automatic, FISH screening automatic), where nuclei selection was done on the output of the automatic nuclei segmentation module and FISH screening was done from the automatic FISH segmentation module output.
The degree of spatial similarity of the spots among the 3 output sets was used as the metric to evaluate the efficacy of the automation process. Table I shows the probability that the FISH distribution between NMFM and NAFA are similar. In the majority of cases the probability that the two methods calculated gave similar results was more than 50% and in only one instance was there a significant difference of 5% (D8 for green) level. This justifies the use of the hybrid segmentation and nuclei selection procedure for high throughput tissue screening.
TABLE I.
Table showing the probability that the spatial FISH signals for NMFM and NAFA are similar using 1-D K-S test
| Dataset | Dl | D2 | D3 | D4 | D5 | D6 | D7 | D8 | D9 |
|---|---|---|---|---|---|---|---|---|---|
| G-Edt | 0.43 | 0.56 | 0.81 | 0.87 | 0.88 | 0.16 | 0.98 | 0.05 | 0.67 |
| G-EdtP | 0.42 | 0.65 | 0.79 | 0.70 | 0.79 | 0.42 | 0.31 | 0.06 | 0.61 |
| R-Edt | 0.94 | 0.48 | 0.33 | 0.17 | 0.57 | 0.29 | 0.96 | 0.18 | 0.96 |
| R-EdtP | 0.98 | 0.66 | 0.29 | 0.16 | 0.47 | 0.11 | 0.76 | 0.80 | 0.74 |
As an intermediate step the automation efficacy of the FISH segmentation procedure was tested. Table II shows the probability of similarity of the FISH distribution between NMFM and NMFA. Most of the signal distributions were statistically very similar enabling us to use the existing automatic FISH segmentation procedure.
TABLE II.
Table showing the probability that the spatial FISH signals for NMFM and NMFA are similar using 1-D K-S test
| Dataset | Dl | D2 | D3 | D4 | D5 | D6 | D7 | D8 | D9 |
|---|---|---|---|---|---|---|---|---|---|
| G-Edt | 0.79 | 0.99 | 1.00 | 1.00 | 1.00 | 0.98 | 0.72 | 0.98 | 0.58 |
| G-EdtP | 0.64 | 0.72 | 0.99 | 0.99 | 0.88 | 0.83 | 0.20 | 0.80 | 0.63 |
| R-Edt | 0.51 | 0.43 | 0.27 | 1.00 | 1.00 | 1.00 | 0.99 | 0.82 | 1.00 |
| R-EdtP | 0.50 | 0.41 | 0.21 | 1.00 | 0.98 | 0.99 | 0.99 | 0.65 | 1.00 |
VI. Conclusions and Future Work
Progress towards building a framework for automatic nuclei segmentation and spatial gene analysis in interphase nuclei for cancer detection is reported. Manual analysis of similar datasets had shown that the method is promising for cancer detection.
Spatial analysis of genes also has potential to be used for cancer staging. It is most likely that analysis of multiple genes might be required for the purpose. Other morphological features, such as nuclear size, are a potential cue for cancer staging too. However the data used for the paper was not used for this purpose.
For the system to work as a diagnostic tool automation is essential so that the analysis can be done in a timely and cost effective way. The results show that the proposed hybrid automatic segmentation method has considerable promise for automating the analysis. However improvement is still needed. Some of the future work involves: incorporating dynamic learning systems so that the pattern analysis system becomes increasingly more expert, improving the segmentation module for more accurate boundary detection, identifying more feature sets for improved identification of good nuclei and exploring advanced pattern classification methods with neural networks and support vector machines.
Acknowledgments
This project has been funded in whole or in part with federal funds from the National Cancer Institute, National Institutes of Health, under Contract No. HHSN261200800001E. The content of this publication does not necessarily reflect the views or policies of the Department of Health and Human Services, nor does mention of trade names, commercial products, or organizations imply endorsement by the U.S. Government.
References
- [1].Takizawa T, Meaburn KJ and Misteli T, The Meaning of Gene Positioning, Cell, 2008, Vol. 135, Issue 1, pp 9–13 [DOI] [PMC free article] [PubMed] [Google Scholar]
- [2].Meaburn KJ and Misteli T, Cell biology: Chromosome territories, Nature, 2007, 445, pp 379–381 [DOI] [PubMed] [Google Scholar]
- [3].Meaburn KJ, Gudla PR, Khan S, Lockett SJ and Misteli T, Cancer Detection Based on Spatial Genome Organization, submitted to Journal of Cell Biology [Google Scholar]
- [4].Gudla PR, Nandy K, Collins J, Meaburn KJ, Misteli T and Lockett SJ, A High-Throughput System for Segmenting Nuclei Using Multiscale Techniques, Cytometry Part A, 2008, Vol. 73A, Issue 5, pp 451–466 [DOI] [PMC free article] [PubMed] [Google Scholar]
- [5].McCullough D, Gudla P, Harris B, Collins J, Meaburn K, Nakaya M, Yamaguchi T, Misteli T, Lockett SJ, Segmentation of Whole Cells and Cell Nuclei From 3-D Optical Microscope Images Using Dynamic Programming, IEEE Transactions on Medical Imaging, 2008, Vol. 27, pp 723734. [DOI] [PMC free article] [PubMed] [Google Scholar]
- [6].Laurain V, Ramoser H, Nowak C, Steiner GE and Ecker R, “Fast Automatic Segmentation of Nuclei in Microscopy Images of Tissue Sections”, Proceedings of the 2005 IEEE Engineering in Medicine and Biology Conference, Shanghai, China, 2005, pp 3367–3370 [DOI] [PubMed] [Google Scholar]
- [7].Duda RO, Hart PE and Stork DG, Pattern Classification, Second Edition, 2000, Wiley-Interscience, New York, N. Y. [Google Scholar]
- [8].Kittler J, Hatef M, Duin RPW, and Matas J, On Combining Classifiers, IEEE Transactions On Pattern Analysis and Machine Intelligence, 1998, Vol. 20, No. 3, pp 226–239 [Google Scholar]
- [9].LastWave, http://www.cmap.polytechnique.fr/~bacry/LastWave
- [10].DipImage, http://www.diplib.org/
- [11].Li C, Xu C, Gui C and Fox MD, Level Set Evolution Without Re-initialization: A New Variational Formulation, Proceedings of the 2005. IEEE Computer Society Conference on Computer Vision and Pattern Recognition, 2005, San Diego, C. A., pp 430–436 [Google Scholar]
- [12].Felzenszwalb PF and Huttenlocher DP, Efficient Graph-Based Image Segmentation, International Journal of Computer Vision, 2004, Vol. 59, Issue 2, pp 167–181 [Google Scholar]
- [13].Gudla PR, Nandy K, Philip M, Meaburn KJ, Misteli T and Lockett SJ, FLO:An Unbiased Spatial Analysis Of FISH Signals In Irregular Shaped Nuclei, manuscript under preparation


