Abstract
Background:
Accurate digital pathology image analysis depends on high-quality images. As such, it is imperative to obtain digital images with high resolution for downstream data analysis. While hematoxylin and eosin (H&E)-stained tissue section slides from solid tumors contain three-dimensional information, these data have been ignored in digital pathology. In addition, in cytology and bone marrow aspirate smears, the three-dimensional nature of the specimen has precluded efficient analysis of such morphologic data. An individual image snapshot at a single focal distance is often not sufficient for accurate diagnoses and multiple whole-slide images at different focal distances are necessary for diagnostics.
Materials and Methods:
We describe a novel computational pipeline and processing program for obtaining a super-resolved image from multiple static images at different z-planes in overlapping but separate frames. This program, MULTI-Z, performs image alignment, Gaussian smoothing, and Laplacian filtering to construct a final super-resolution image from multiple images.
Results:
We applied this algorithm and program to images of cytology and H&E-stained sections and demonstrated significant improvements in both resolution and image quality by objective data analyses (24% increase in sharpness and focus).
Conclusions:
With the use of our program, super-resolved images of cytology and H&E-stained tissue sections can be obtained to potentially allow for more optimal downstream computational analysis. This method is applicable to whole-slide scanned images.
Keywords: Cytology, digital pathology, high resolution, super resolution
INTRODUCTION
While there is a global shift toward image processing and digitizing medical slides and images, there is a clear and definite obstacle: the limited depth of focus in optical microscopes and imaging systems. Due to this limitation, it is not possible to easily capture a singular image with high spatial resolution.
In general, low image pixel resolution is caused by extrinsic and intrinsic factors. The intrinsic factors are due to the interaction between wave particles of light and the substance.[1] Optical microscopes have the capability to only focus on one object plane in the field of view or a specific z-level at a certain time, disregarding crucial cellular features at different planes. The design of the optical microscope, focal length, and distance to specimen limit the depth of field to a two-dimensional plane of focus when viewing slides.
In imaging systems, changing the aperture and thus the f-number allows for focusing of different distance from the capturing device. Conversely, with a microscope, slight alterations in the distance of the specimen allows for shifts in focus of separate layers of a slide. Hence, when examining tissue section slides under a magnification, a single plane is insufficient due to slight differences in the object plane focal lengths. Subsequently, we must take multiple images of a single field of view at different z-levels to appropriately represent the entire information in that field of view on the slide.
The extrinsic factors include resolution enhancements on captured images.[2] Hence, with a set of images of different focal depths, super-resolution (SR) techniques are necessary to generate an accurate representation of the slide in one image. This allows for more efficient analysis of digital slides, expedites collaboration, and improves downstream computational analysis.
The high-resolution medical images allow for reliable digital duplication of information for collaboration in accurate diagnoses. In addition, with the rapid development of computer-assisted diagnostic models (i.e., computational algorithms that use digital image data to generate diagnoses), there is an increased focus on improving accuracy models.[3,4,5,6] An overlooked aspect in the development of these computer-assisted diagnostic models is the quality of the training data or the input images, thus providing an unrealized potential in improving accuracy of diagnostic models with super-resolved images.
SR imaging refers to a set of techniques that improve and enhance resolution of images. Harris[7] introduced the mathematical foundation of SR algorithms with a theory on solving diffraction in 1964, then Tsai et al.[8] addressed the problem in the context of enhancing the spatial resolution using the spatial aliasing effect, and subsequently, many studies have been conducted using a frequency domain approach; all these approaches use multiple low-resolution images to generate a single super-resolved image.[9,10,11] These techniques have a broad scale of applications, including security surveillance, astronomy, entomology, satellite photographs, and medical images. A commonly used approach to increase spatial resolution (i.e., the number of independent pixels values used to construct an image) is to use signal processing techniques.[2] This includes focus stacking, that is, an approach to produce SR images from a subset of low-resolution images with varying focal depths.
Currently, the most common approaches for focus stacking, or more specifically multifocus image fusion, use either Fourier analysis (i.e., to decompose an image into its sinusoidal components in the frequency domain) or edge detection (i.e., a set of techniques used to identify “sharp” regions of an image).[1,9,12] While these approaches work well in certain cases, they do not perform well for feature-oriented detection.[13] In addition, we have considered using a weighted or enhanced map method, but these approaches are aimed to reduce noise and smooth the images, which can cause a loss of valuable data from images of tissue slides. We have proposed a method utilizing a scale-normalized Laplacian operator on Gaussian smoothed images to generate the scale-space representation. This approach will detect the highest resolution regions (strongest edges) through applying the Laplacian operator to produce a gradient map, which is used to generate an image with a greater depth of field (apparent plane of focus). When applied to bone marrow aspirate and cytology smears and tissue sections, this approach utilizes a Laplacian of Gaussian (LoG) feature detector, identifying individual cells, lymphocytes, monocytes, and neutrophils that are focused in the image and maintaining the entire composition of a specific geometric cellular feature in the final image to prevent distortion. The Laplacian operator is a kernel that is convolved on an image to generate a gradient map and highlight intensity changes. Creating a single super-resolved image from a set of low-resolution images is computationally cheaper for downstream analysis as it does not require the analysis of multiple images of the same scene at different z-planes. In addition, having a single super-resolved digital medical slide allows for easy sharing of data at a low cost.
MATERIALS AND METHODS
Data
Images were taken using a SPOT Insight camera (SPOT Imaging, Sterling Heights, MI, USA), 4.0 megapixel, mounted to an Olympus BX41 (Olympus, Waltham, MA, 02453) microscope using SPOT Basic (SPOT Imaging) image capture software. All codes were written in Python on Mac OS (Apple Inc.; Cupertino, CA, USA). In addition, the OpenCV library (from https://opencv.org/) version 3.5.5 was used for basic implementations of published algorithms.
Computational methods
Image alignment
When capturing images of the slides under an optical microscope, the microadjustments in the z-plane may be accompanied with slight zoom or positioning variations. Appropriate compensation must be taken to alleviate the misalignment from these slight variations, and the images must be precisely aligned to allow for comparison.
We utilized a feature detection algorithm to locate the descriptors and key points. The Scale-Invariant Feature Transform (SIFT)[14,15] approach was used to find key points and descriptors of an image. Lowe's SIFT algorithm utilizes scale-space filtering with the difference of Gaussian, an approximation of LoG to detect blobs (local extrema) for comparison. Figure 1 shows the detected key points in the image. The SIFT algorithm was selected for this task as it performed with the highest match rate for images that were rotated of variable intensity, sheared, and noisy.[16]
Figure 1.
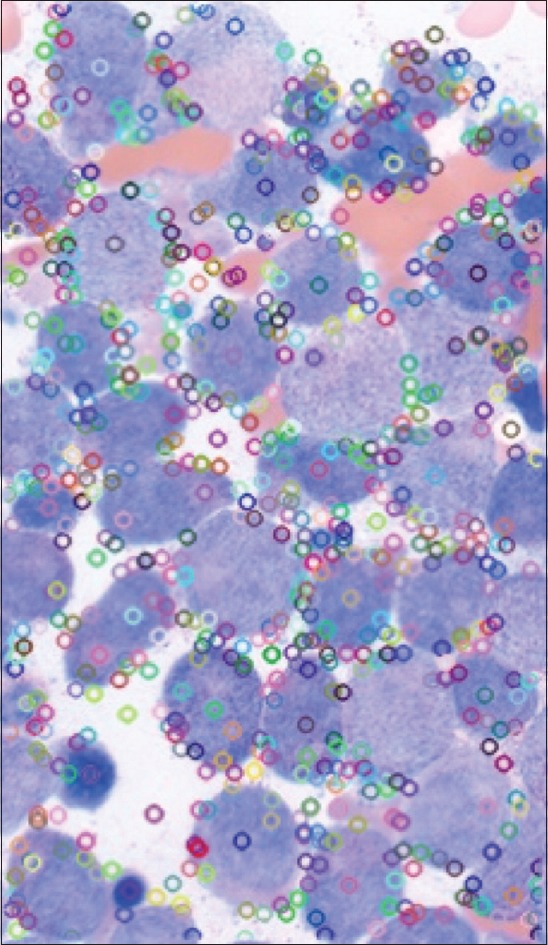
Illustration of identified key points using scale-invariant feature transforms. Key points are identified and noted with variably colored circles
Given these key points, we chose to use a Brute-Force matcher that accepts the descriptors of one feature and compares it with all descriptors of another image, using a set of proportional distance measurements to pinpoint a match [Figure 2]. Then, with a ratio test[14,15] set at a threshold of 80%, we determined the strong matches from the data. These strong matches were ordered from nearest to furthest.
Figure 2.

Correlation map of strong matches between two images in different z-levels. Two images of the same region of a digital slide, at different z-levels, showing “key point” identification, represented by circles in each image and their correlation, illustrated by a gray horizontal line link
Subsequently, the homography was calculated using the strong matches to describe the relation of the images in the same frame.[17] The homography matrix is a mathematical expression that outlines how to wrap and orient the images so that they can be expressed in one coordinate frame. Specifically, the Random Sample Consensus[18] algorithm was used to determine the transformational relationship of the images while filtering out the extraneous correlations.[18] The maximum reprojection error was set to 2.0 to ensure flexibility without losing precision. The images were then transformed using the homography matrix with a linear interpolation method in order to align the images with features in the exact same position in every image.
Image convolution
A differential blob detector known as the LoG is initially convolved with a kernel represented by the following Gaussian function[19] where σ is the standard deviation.

Moreover, the Laplacian filter, which is derived from discretization of the Laplace equation, is applied to the Gaussian scale-space representation.[20]

The operations of convolving an image with the LoG kernel is equivalent to calculating the Laplace of an image convolved with the Gaussian kernel. The expression below illustrates the equivalence of these two methods in two-dimensional cases.

Therefore, Gaussian smoothing was performed on the images using a kernel of size 3 × 3. Through a set of optimization experiments, we have determined that a 3 × 3 Gaussian kernel is ideal for this microscopy case.

The Gaussian smoothing is used to reduce the likelihood of false positives during feature detection. Gaussian smoothing occurs through convolving the above kernel above through each pixel of the image, resulting in a transformation of the image.
Feature detection and stacking
The Laplacian filter, as shown below, was applied on the Gaussian smoothed images. The Laplace is calculated through the addition of the x and y second derivatives.

The LoG, in this case, is often mislabeled as an edge detector. In contrast with search-based edge detection, which finds local extrema of the first order derivative, the Laplacian is a second-order derivative operator. The zero-crossings of the second derivative locate the extrema of the first-order derivative function and are the inflection points of the function. Since the Laplacian is calculated as the sum of the second derivatives, the zero-crossing will be localized along the gradient. When the second derivative in all directions is added, it will yield a negative response along a convex edge gradient transition and positive response on a concave edge gradient transition, thus resulting in zero-crossing on curved edges. The addition of these values leads to the blob detection around distinct features with a strong inflection.[20] Figure 3 illustrates the image representation after the Laplacian kernel is convolved on the Gaussian smoothed image.
Figure 3.
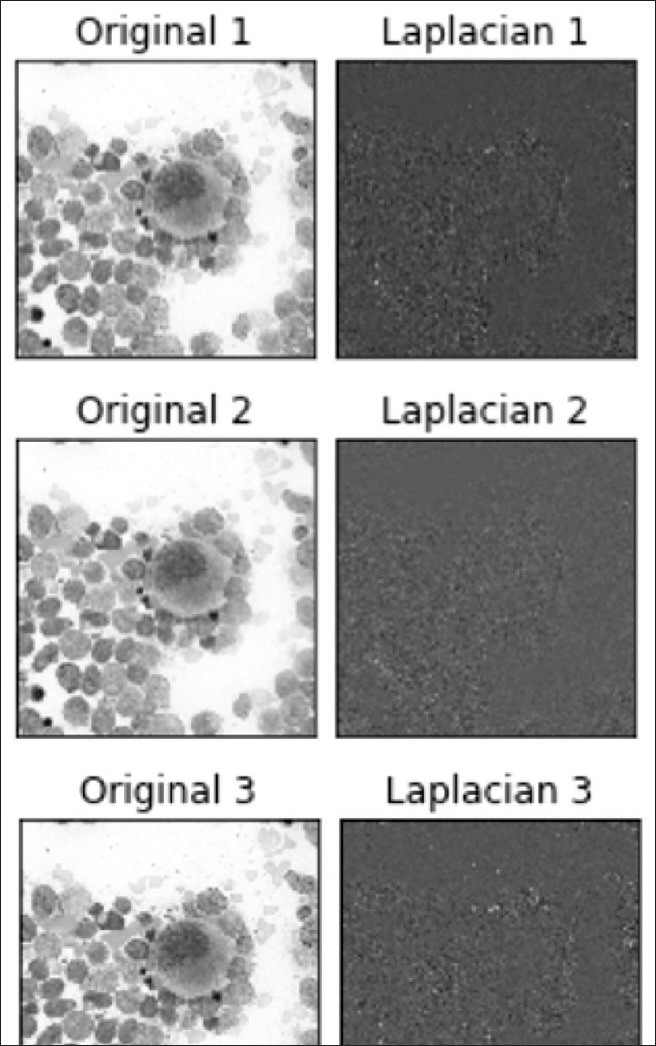
Plot of Laplacian of Gaussian filter on three images at different z-levels. Different z-levels of the same region of interest (×400 magnification) with the Laplacian of Gaussian filter applied. The Laplacian of Gaussian filter results are seen to the right of each image
After computing the Laplacian, the absolute magnitude of the values was calculated. The absolute value allows us to locate both the strong positive and negative responses. Then, through determining the maximum value for each pixel value from the set of images, we can create a final image with the strong in focus responses, in the shape of small blobs. Finally, using a Boolean mask, we determined which pixels and regions to use for the output.
Data analysis
Beyond professional subjective evaluation, we used six main quantification techniques to perform the analysis on whether our approach yielded high-resolution images. We selected a series of objective comprehensive analysis methods to assess the performance of our approach.
The Structural Similarity Index Measure (SSIM) is a commonly used quality metric that quantifies the similarity of images through evaluating the correlation, luminance distortion, and contrast distortion.[21,22] This metric is known to mirror the human visual system to provide an intuitive measurement. We use it as an independent control test to illustrate the presence of difference between the images with the formula below.
SSIM (f, g) = I (f, g)c(f, g) s (f,g)
The mean square error (MSE) is an error metric that can be used to assess image quality and quantify the average change in pixel value between two images.[23]First used by Carl Friedrich Gauss to quantify variance, MSE is a widely used technique for signal and wavelet strength analysis.[22] The MSE was calculated to elucidate the presence of a significant decrease in noise and shift in signal strength. The MSE between two images is calculated with the formula below, with M and N as the number of rows and columns in the images. Figure 4 illustrates the complete workflow diagram for the MULTI-Z approach.
Figure 4.
MULTI-Z workflow diagram

The peak signal-to-noise ratio (PSNR) is a logarithmic metric that is partially based off the MSE and is used as a comparative image quality measurement. PSNR provides a greater insight on images with several varying dynamic ranges. In general, a higher PSNR connotes a higher image quality and focus. The PSNR is represented with the logarithmic decibel scale and is computed on 8-bit images using the equation below.

Average gradient (AG) was calculated to illustrate the image contrast and the mean sharpness of the image. With this metric, the larger the value, the sharper the image. As a quantification of the clarity, the AG is given by the formula below.[24,25]

The Shannon entropy is a universal measure of the amount of information contained in an image.[26] The higher the entropy of an image, the greater the amount of information contained within the image. In medical applications, the difference in entropy is generally restricted as the output should not contain manufactured or predicted information and must be solely composed of the provided information. The entropy is calculated with the formula below.

The final quantitative assessment used was the variance of Laplacian method.[27] The value was calculated through convolving the Laplacian kernel and subsequently calculating the variance. Images with a larger variance, more zero-crossings of the second derivative, are more focused.
RESULTS
The aim of the described algorithm was to generate high-resolution pathology images to present the three-dimensional cellular structures that are lost with the optical microscope's two-dimensional representation of a three-dimensional surface as shown in Figure 5.
Figure 5.
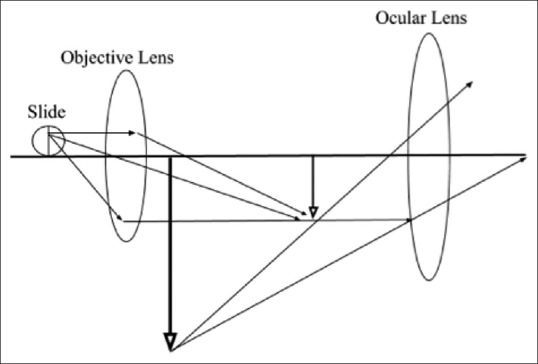
Optical microscope geometric ray model. Schematic diagram of an optical microscope that details the path of light and the plane of focus, illustrating the three-dimensional aspect to a cell or tissue on a glass slide
The algorithm was applied to a series of cases and the six quantitative values were calculated as shown below. Figure 6 contains a series of images at different z-planes with respective regions of interest demarcated. The simulation and experimental results are shown in Table 1. The stacking for each set of images was repeated ten times to ensure consistent reproducibility of results. The average run time for the program for a set of three images is 8.21 s.
Figure 6.
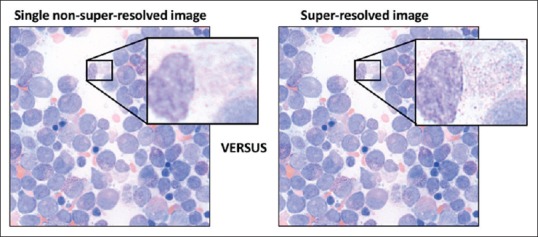
Image result from super-resolution processing on bone marrow aspirate smears using MULTI-Z. Left: nonsuper-resolved image; Right MULTI-Z postprocessing super-resolved image. Boxed areas highlight a small region which is magnified further to clearly, but subjectively, demonstrate the increased image data and resolution provided by processing images through MULTI-Z
Table 1.
Quantitative results of image improvement following processing by MULTI-Z
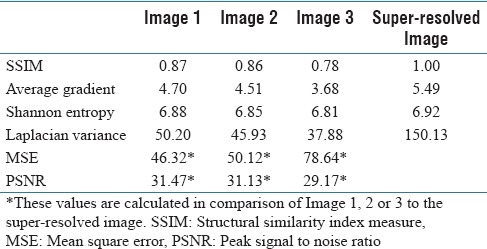
The program clearly yielded images with a greater depth of field. This new application of a blob detection algorithm minimizes any visual cellular discontinuities or reduction of information with smoothing while stacking the most focused regions. The quantitative analysis from this simulation is summarized in Table 1.
The results from Table 1 indicate that there is an increase in the amount of information carried by the one image in comparison with any of the other images. In addition, the PSNR and AG show a significant increase in sharpness and focus with a 24% increase in AG. The stacking program clearly increases the sharpness of the image, providing vital three-dimensional information analysis.
DISCUSSION
Here, we describe a method for generating high-resolution digital images from several stacked images in varying z-planes. The underlying aim of this study was to be able to produce a technique to generate super-resolved pathology slide images that contain all of the relevant in-focus information in a three-dimensional field of view and not to introduce artifacts. These digital “slides” can be used for downstream analysis and easy sharing of data for collaboration. While such algorithms have been developed previously,[1,11,24,28,29] ours differs in that we are using a multifocus blob detector for detecting focused cellular geometric structures and regions to compose a final image. Applying our algorithm to bone marrow aspirate and cytology smears and tissue sections allows for a significant improvement in information entropy and image sharpness.
Several studies have evaluated the diagnostic accuracy of current z-plane stacking methods.[30,31,32,33,34] The diagnostic accuracy of stacking 20 z-plane levels was equivalent to glass slide microscopy as evaluated by 24 experienced cytologists.[32] Another impact evaluation found no statistically significant difference in diagnostic accuracy between the quality assessment of a digital slide generated from stacking three to five z-plane levels and a glass slide.[31] The study also revealed a greater average quality assessment for multiple z-plane stacked images over a single z-plane image.[31]
Our program increases the depth of field and allows for a dynamic range of information (i.e., focused material in front and behind the median focused plane of the image) to be provided, bypassing the intrinsic restrictions of optical microscopes and imaging devices. In addition, our program does not have restrictions on the number of images with varying focal planes that can be provided to the algorithm for processing. Our program is applicable to whole-slide scanned images at ×100 magnification or higher.
An obvious extension of this work is combining frequency and spatial domain approaches for image reconstruction of the three-dimensional object. Another important extension of this work could be in the use of wavelet transforms for image reconstruction.
Challenges in real-world implementation remain, such as the speed of generating these super high-resolution images after processing by MULTI-Z. Super-resolving 5 digital images at varied z-planes at a field of view of ×1000 magnification may take on the order of 1–10 s to generate a final image (depending on the size of image, CPU speed, and RAM size). Generating a whole-scanned slide at ×1000 magnification would currently be magnitude folds greater in time. Further work is needed to address this barrier to efficient utilization of the algorithm and solutions could come in the form of down-sampling of image data before alignment to increase processing capability further.
Yet questions remain such as whether the fusion of images causes introduction of microartifacts during the composition process, not distinguishable to the human visual system or metrics tested here, but significant enough to cause errors in downstream analysis. Although we did not include such data, subjective observation by three pathologists did not identify any artifacts in our analyzed and original image datasets; uniform subjective consensus was that there was a clear increase in resolution and clarity of images after SR processing by MULTI-Z.
CONCLUSION
Here, we present a novel SR processing method: MULTI-Z. This program generates SR images from multiple images at variable z-planes and uniquely performs image alignment, image convolution, and image fusion producing a final image with an objective measured increase in “relevant data” by 24%. Work to capitalize on the increased morphologic data produced by this method is an important direction of future studies, both assessment of the application of this methodology for rapid pathologic diagnoses of bone marrow aspirate specimens and cytology smears and use of images produced by this technology for downstream machine learning programs to assess morphologic features of neoplastic cells.
Financial support and sponsorship
Nil.
Conflicts of interest
There are no conflicts of interest.
Footnotes
Available FREE in open access from: http://www.jpathinformatics.org/text.asp?2018/9/1/48/248452
REFERENCES
- 1.Kouame D, Ploquin M. Super-resolution in medical imaging: An illustrative approach through ultrasound. In: 2009 IEEE International Symposium on Biomedical Imaging: From Nano to Macro. IEEE. 2009:249–52. [Google Scholar]
- 2.Park SC, Park MK, Kang MG. Super-resolution image reconstruction: A technical overview. IEEE Signal Process Mag. 2003;20:21–36. [Google Scholar]
- 3.Danaee P, Ghaeini R, Hendrix DA. A deep learning approach for cancer detection and relevant gene identification. Pac Symp Biocomput. 2017;22:219–29. doi: 10.1142/9789813207813_0022. [DOI] [PMC free article] [PubMed] [Google Scholar]
- 4.Li H, Weng J, Shi Y, Gu W, Mao Y, Wang Y, et al. An improved deep learning approach for detection of thyroid papillary cancer in ultrasound images. Sci Rep. 2018;8:6600. doi: 10.1038/s41598-018-25005-7. [DOI] [PMC free article] [PubMed] [Google Scholar]
- 5.Cruz-Roa A, Gilmore H, Basavanhally A, Feldman M, Ganesan S, Shih NNC, et al. Accurate and reproducible invasive breast cancer detection in whole-slide images: A deep learning approach for quantifying tumor extent. Sci Rep. 2017;7:46450. doi: 10.1038/srep46450. [DOI] [PMC free article] [PubMed] [Google Scholar]
- 6.Weaver DL, Krag DN, Manna EA, Ashikaga T, Harlow SP, Bauer KD, et al. Comparison of pathologist-detected and automated computer-assisted image analysis detected sentinel lymph node micrometastases in breast cancer. Mod Pathol. 2003;16:1159–63. doi: 10.1097/01.MP.0000092952.21794.AD. [DOI] [PubMed] [Google Scholar]
- 7.Harris JL. Diffraction and resolving power. J Opt Soc Am. 1964;54:931. [Google Scholar]
- 8.Tsai RY, Huang T. Vol. 1. Greenwich: JAI Press Inc; 1984. Multipleframe image restoration and registration. In: Advances in Computer Vision and Image Processing; pp. 317–39. [Google Scholar]
- 9.Greenspan H. Super-resolution in medical imaging. Comput J. 2009;52:43–63. [Google Scholar]
- 10.Yue L, Shen H, Li J, Yuan Q, Zhang H, Zhang L. Image super-resolution: The techniques, applications, and future. Signal Process. 2016;128:389–408. [Google Scholar]
- 11.Greenspan H. Super-resolution in medical imaging. Comput J. 2008;52:43–63. [Google Scholar]
- 12.Gupta C, Gupta P. A study and evaluation of transform domain-based image fusion techniques for visual sensor networks. Int J Comput Appl. 2015;116:26–30. [Google Scholar]
- 13.Lindeberg T. Scale-space. In: Wiley Encyclopedia of Computer Science and Engineering. Hoboken, NJ, USA: John Wiley and Sons, Inc; 2008. pp. 2495–504. [Google Scholar]
- 14.Lowe DG. Distinctive image features from scale-invariant keypoints. Int J Comput Vis. 2004;60:91–110. [Google Scholar]
- 15.Lowe DG. Object Recognition from Local Scale-Invariant Features. 1999. [Last accessed on 2018 Jul 19]. Available from: http://www.cs.ubc.ca/~lowe/papers/iccv99.pdf .
- 16.Karami E, Prasad S, Shehata M. Image Matching Using SIFT, SURF, BRIEF and ORB: Performance Comparison for Distorted Images. [Last accessed on 2018 Jul 20]. Available from: https://www.arxiv.org/pdf/1710.02726.pdf .
- 17.Vincent E, Laganiére R. Detecting planar homographies in an image pair. Proceedings of the 2nd International Symposium on Image and Signal Processing and Analysis. 2001:182–7. [Google Scholar]
- 18.Foley JD, Fischler MA, Bolles RC. Random Sample Consensus: A Paradigm for Model Fitting with Apphcatlons to Image Analysis and Automated Cartography. 1981. [Last accessed on 2018 Jul 23]. Available from: http://www.delivery.acm.org/10.1145/360000/358692/p381-fischler.pdf?ip=171.66.213.131&id=358692&acc=ACTIVESERVICE&key=AA86BE8B6928DDC7.0AF80552DEC4BA76.4D4702B0C3E38B35.4D4702B0C3E38B35&__acm__=1532395792_c4b104a2fb009756c37b01cf63a1168d .
- 19.Jacques L, Duval L, Chaux C, Peyré G. Panorama on Multiscale Geometric Representations, Intertwining Spatial, Directional and Frequency Selectivity. 2018. [Last accessed on 2018 Jul 25]. Available from: https://www.arxiv.org/pdf/1101.5320v2.pdf .
- 20.Kong H, Akakin HC, Sarma SE. A generalized laplacian of gaussian filter for blob detection and its applications. IEEE Trans Cybern. 2013;43:1719–33. doi: 10.1109/TSMCB.2012.2228639. [DOI] [PubMed] [Google Scholar]
- 21.Wang Z, Bovik AC, Sheikh HR, Simoncelli EP. Image quality assessment: From error visibility to structural similarity. IEEE Trans Image Process. 2004;13:600–12. doi: 10.1109/tip.2003.819861. [DOI] [PubMed] [Google Scholar]
- 22.Ndajah P, Kikuchi H, Yukawa M, Watanabe H, Muramatsu S. An investigation on the quality of denoised images. Int J Circuits Syst Signal Process. 2011;5:424–34. [Google Scholar]
- 23.Sharma A, Saroliya A. A Brief Review of Different Image Fusion Algorithm. Int J Sci Res. 2015;4:2650–2. [Google Scholar]
- 24.Wang W, Chang F. A multi-focus image fusion method based on Laplacian pyramid. J Comput. 2011;6:2559–66. [Google Scholar]
- 25.Sharma A, Sharma R. Quality assesment of gray and color images through image fusion technique 1. IJEEE. 2014;1:1–6. [Google Scholar]
- 26.Shannon CE. [Last accessed on 2018 Jul 29];Mathematical Theory of Communication. 27 Available from: http://www.math.harvard.edu/~ctm/home/text/others/shannon/entropy/entropy.pdf . [Google Scholar]
- 27.Bansal R, Raj G, Choudhury T. IEEE. 2016. Blur image detection using Laplacian operator and Open-CV. In: 2016 International Conference System Modeling&Advancement in Research Trends (SMART) pp. 63–67. [Google Scholar]
- 28.Burt PJ, Kolczynski RJ. Enhanced image capture through fusion. In: 1993 (4th) International Conference on Computer Vision. IEEE Computer Society Press. 1993:173–82. [Google Scholar]
- 29.Method for Fusing Images and Apparatus Therefor. 1993. May, [Last accessed on 2018 Jul 18]. Available from: https://www.patents.google.com/patent/US5488674 .
- 30.Ross J, Greaves J, Earls P, Shulruf B, Van Es SL. Digital vs. traditional: Are diagnostic accuracy rates similar for glass slides vs. whole slide images in a non-gynaecological external quality assurance setting? Cytopathology. 2018;29:326–34. doi: 10.1111/cyt.12552. [DOI] [PubMed] [Google Scholar]
- 31.Hanna MG, Monaco SE, Cuda J, Xing J, Ahmed I, Pantanowitz L, et al. Comparison of glass slides and various digital-slide modalities for cytopathology screening and interpretation. Cancer Cytopathol. 2017;125:701–9. doi: 10.1002/cncy.21880. [DOI] [PubMed] [Google Scholar]
- 32.Evered A, Dudding N. Accuracy and perceptions of virtual microscopy compared with glass slide microscopy in cervical cytology. Cytopathology. 2011;22:82–7. doi: 10.1111/j.1365-2303.2010.00758.x. [DOI] [PubMed] [Google Scholar]
- 33.Donnelly AD, Mukherjee MS, Lyden ER, Bridge JA, Lele SM, Wright N, et al. Optimal z-axis scanning parameters for gynecologic cytology specimens. J Pathol Inform. 2013;4:38. doi: 10.4103/2153-3539.124015. [DOI] [PMC free article] [PubMed] [Google Scholar]
- 34.Madabhushi A, Lee G. Image analysis and machine learning in digital pathology: Challenges and opportunities. Med Image Anal. 2016;33:170–5. doi: 10.1016/j.media.2016.06.037. [DOI] [PMC free article] [PubMed] [Google Scholar]


