Abstract
AIM
To identify the effects and mechanism of action of Polygonatum kingianum (P. kingianum) on dyslipidemia in rats using an integrated untargeted metabolomic method.
METHODS
A rat model of dyslipidemia was induced with a high-fat diet (HFD) and rats were given P. kingianum [4 g/(kg•d)] intragastrically for 14 wk. Changes in serum and hepatic lipid parameters were evaluated. Metabolites in serum, urine and liver samples were profiled using ultra-high performance liquid chromatography/mass spectrometry followed by multivariate statistical analysis to identify potential biomarkers and metabolic pathways.
RESULTS
P. kingianum significantly inhibited the HFD-induced increase in total cholesterol and triglyceride in the liver and serum. P. kingianum also significantly regulated metabolites in the analyzed samples toward normal status. Nineteen, twenty-four and thirty-eight potential biomarkers were identified in serum, urine and liver samples, respectively. These biomarkers involved biosynthesis of phenylalanine, tyrosine, tryptophan, valine, leucine and isoleucine, along with metabolism of tryptophan, tyrosine, phenylalanine, starch, sucrose, glycerophospholipid, arachidonic acid, linoleic acid, nicotinate, nicotinamide and sphingolipid.
CONCLUSION
P. kingianum alleviates HFD-induced dyslipidemia by regulating many endogenous metabolites in serum, urine and liver samples. Collectively, our findings suggest that P. kingianum may be a promising lipid regulator to treat dyslipidemia and associated diseases.
Keywords: Dyslipidemia, Lipid regulation, Metabolomics, Multivariate statistical analysis, Polygonatum kingianum, Ultra-high performance liquid chromatography/mass spectrometry
Core tip: We investigated the effects and the underlying mechanism of action of Polygonatum kingianum (P. kingianum) on high-fat diet (HFD)-induced dyslipidemia in rats using an integrated untargeted metabolomic method. The results indicated that P. kingianum alleviated HFD-induced dyslipidemia by regulating a large number of endogenous metabolites in serum, urine and liver. This involved phenylalanine, tyrosine, tryptophan, valine, leucine and isoleucine biosynthesis, and tryptophan, tyrosine, phenylalanine, starch, sucrose, glycerophospholipid, arachidonic acid, linoleic acid, nicotinate, nicotinamide and sphingolipid metabolism. P. kingianum may be a promising lipid regulator to remedy dyslipidemia and further alleviate its related diseases.
INTRODUCTION
Dyslipidemia is a core characteristic of the metabolic syndrome, and is an important risk factor for atherosclerosis, coronary heart disease, stroke and other cardiovascular and cerebrovascular diseases. It is also closely related to many significant diseases such as diabetes and nephropathy[1]. Dyslipidemia is divided into two types, referred to as primary and secondary dyslipidemia. Primary dyslipidemia has a genetic history and may be caused by congenital enzyme defects. Secondary dyslipidemia is usually present in patients with diseases such as diabetes mellitus, hypothyroidism, nephrotic syndrome, biliary obstruction, pancreatitis, gout, alcoholism, and various liver disorders[2]. The improvement in living standards and associated lifestyle changes have led to dyslipidemia being considered one of the most important risk factors for metabolic diseases worldwide[3]. Therefore, management of dyslipidemia is of vital importance to prevent and cure a variety of acute and chronic human diseases.
The commonly used lipid regulators include statins, fibrates, nicotinic acid and variants, bile acid sequestrants and inhibitors of cholesterol absorption. These drugs can be effective for treating dyslipidemia, but have significant adverse effect profiles[4]. For example, statins may increase blood glucose concentrations, cause rhabdomyolysis or damage the liver and kidneys[5]. Traditional Chinese medicines (TCMs) are one of the world’s oldest herbal medicines and have been applied extensively by TCM practitioners for thousands of years[6]. TCMs have an indispensable role in the prevention and treatment of human diseases, especially those that are complicated and chronic[7]. As a complementary therapy technique with fewer side effects than Western medicines, TCMs have been employed widely to regulate lipid metabolic disorders[8]. Thus, TCMs may serve as the basis for development of new lipid-regulating drugs or health products.
Rhizoma polygonati, first recorded in Mingyi Bielu in 220-450 AD (written by Hong-Jing Tao), has been used as a TCM and nutritional food for over 2000 years. Polygonatum kingianum Coll. et Hemsl., Polygonatum sibiricum Red. and Polygonatum cyrtonema Hua are described in the Chinese Pharmacopoeia (2015 edition) as legal sources of Rhizoma polygonati. Polygonatum kingianum (P. kingianum; Figure 1) is mainly distributed in the Chinese provinces of Yunnan, Sichuan, Guizhou and Guangxi. It is mainly comprised of saponins and polysaccharides, and has pharmacological activities that include immune system stimulation, anti-aging effects and blood glucose regulation[9,10]. Our previous research showed that the total saponins and total polysaccharides from P. kingianum had blood glucose and lipid regulating activities[11,12]. However, the lipid-regulating effects of P. kingianum and the mechanism for these remain unclear.
Figure 1.
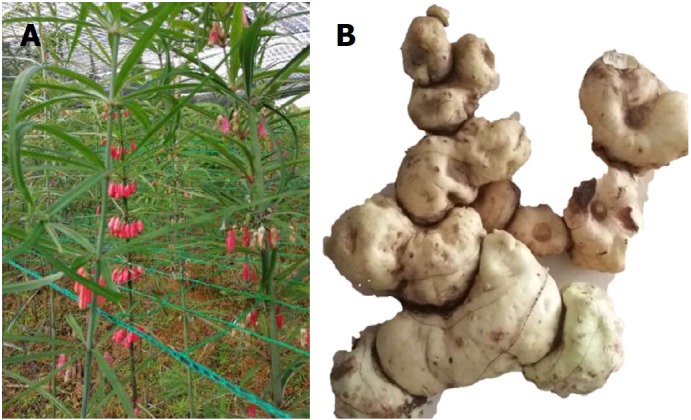
Polygonatum kingianum. A: Whole plant photograph of Polygonatum kingianum (P. kingianum); B: Rhizome of P. kingianum, which represents the medicinal part of this plant used in this study.
Metabolomics can comprehensively characterize small molecule metabolites in biological systems. It can also provide an overview of metabolic status and global biochemical events after external stimulation such as in disease models and after drug treatment[13]. Metabolomics is a novel method in pharmacological and pharmacodynamic studies that is increasingly employed to assess the therapeutic and toxic effects of herbal TCMs and TCM prescriptions, and their mechanism of action[14].
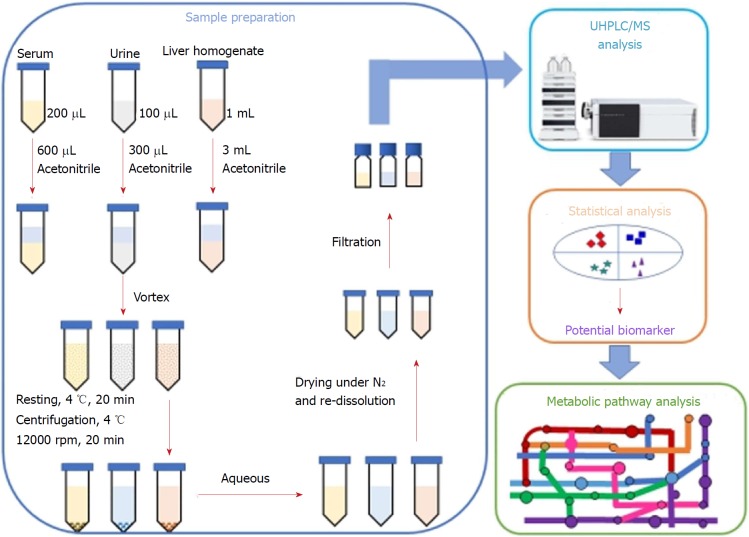
In the present study, we investigated the lipid-regulating effects and the underlying mechanism of action of P. kingianum on high-fat diet (HFD)-induced dyslipidemia in rats. An integrated untargeted metabolomic method was used, which was based on ultra-high performance liquid chromatography/mass spectrometry (UHPLC/MS) analysis of serum, urine and liver samples (Figure 2). The results indicated that P. kingianum alleviated HFD-induced dyslipidemia by regulating many endogenous metabolites in serum, urine and liver samples. Taken together, these findings indicated that P. kingianum may be a promising lipid regulator to treat dyslipidemia and further alleviate associated diseases.
Figure 2.
Workflow of the integrated untargeted metabolomic method based on ultra-high performance liquid chromatography/mass spectrometry analysis of serum, urine and liver samples. UHPLC/MS: Ultra-high performance liquid chromatography/mass spectrometry.
MATERIALS AND METHODS
Chemicals, reagents and materials
Kits for quantifying triglyceride (TG) and total cholesterol (TC) concentrations were purchased from ZhongshengBei Biotech Co., Ltd. (Beijng, China). Bicinchoninic Acid (BCA) Protein Determination Kit was obtained from Beyotime Institute of Biotechnology (Shanghai, China). Simvastatin was purchased from Hangzhou Merck East Pharmaceutical Co., Ltd. (Hangzhou, China). HPLC-grade formic acid and acetonitrile were acquired from Merck (Darmstadt, Germany). Basal rodent diet (calories provided from carbohydrates, proteins and fat were 62%, 26% and 12%, respectively) was obtained from Suzhou Shuangshi Experimental Animal Feed Technology Co., Ltd. (Suzhou, China). Cholesterol, refined lard, and eggs were supplied by Beijing Boao Extension Co., Ltd. (Beijing, China), Sichuan Green Island Co., Ltd. (Chengdu, China) and Wal-Mart Supermarket (Kunming, China), respectively. High-purity deionized water was purified using a Milli-Q system (Millipore, Bedford, MA, United States). All other reagents were of analytical grade or higher. The rhizome of P. kingianum was purchased from Wenshan Shengnong Trueborn Medicinal Materials Cultivation Cooperation Society (Wenshan, China) on 07 April 2017. Samples were authenticated by Professor Jie Yu and a voucher specimen (No. 8426) was deposited in the Key Laboratory of Preventing Metabolic Diseases of Traditional Chinese Medicine, Yunnan University of Traditional Chinese Medicine (Kunming, China).
Preparation of P. kingianum extract
P. kingianum rhizome was processed according to regulations in the Chinese Pharmacopoeia (2015 edition). Briefly, fresh P. kingianum rhizome was separated from fibrous roots, washed, cut into thick slices and dried at 50 °C. The dried materials were then infiltrated in a 5-fold volume of Shaoxing rice wine (Beijing Ershang Wangzhihe Food Co., Ltd., Beijing, China), and then placed in a steam sterilizer (LDZX-50 KBS, Shanghai Shenan Medical Instrument Factory, Shanghai, China) at 120 °C for 2.5 h. After cooling for 3 h, the steamed materials were dried at 60 °C.
The steamed and dried P. kingianum sample was pulverized, immersed in a 7-fold volume of water for 30 min and then decocted with water for 60 min. The filtrates were collected after leaching. The dregs were decocted successively with a 7-fold volume of water for a further 60 min, and the extracted liquids filtered. The two filtrates were then combined and condensed using an R-210 rotatory evaporator (Büchi Labortechnik AG, Flawil, Switzerland) under reduced pressure at 50 °C. Finally, the concentrates were lyophilized to a powder using a FD5-3 freeze dryer (SIM International Group Co. Ltd., Newark, DE, United States). The obtained sample powder was stored in a desiccator at room temperature until use.
Animal experiments
Healthy male Sprague-Dawley rats (200 ± 50 g) were obtained from Dashuo Biotech. Co., Ltd. (Chengdu, China). They were adjusted to a controlled environment (22 ± 1 °C temperature; 60% ± 10% humidity; and a 12 h/12 h light/dark cycle) with free access to water and a commercial laboratory complete food. Experiments complied with the Guide for the Care and Use of Laboratory Animals as published by the United States of America National Institutes of Health and specifically approved by the Institutional Ethical Committee on Animal Care and Experimentations of Yunnan University of Traditional Chinese Medicine (R-062016003) (Kunming, China). All reasonable efforts were made to minimize animal suffering.
After one week of adaptive feeding, rats were randomized into four groups (n = 5 rats per group): normal control (normal saline), model (normal saline), simvastatin [1.8 mg/(kg•d)] and P. kingianum [4 g/(kg•d)] groups. The simvastatin group served as a positive control. The rats were given the treatments intragastrically once a day for 14 consecutive weeks. Simvastatin and P. kingianum were prepared separately in normal saline. Dyslipidemia was induced with an HFD (comprised of 1% cholesterol, 10% refined lard, 10% eggs and 79% basic feed) for 14 wk in all groups except for the normal control group.
Sample collection
To collect urine samples, rats in each experimental group were housed in metabolic cages for the last three weeks of the 14 wk of treatment. Samples were collected from the metabolic cages and transferred immediately into sterile tubes. After the last administration at week 14, rats were fasted for 12 h and then anesthetized with chloral hydrate. Fasting blood was collected from the hepatic portal vein, and the liver was harvested and stored at -80 °C until use. Blood samples were allowed to clot at 4 °C and centrifuged at 10000 g for 10 min, after which serum was collected and stored at -80 °C until assayed.
Measurement of lipid parameters in serum and liver
TG and TC concentrations were determined using 100 μL of serum and 100 μL of liver homogenate supernatant, in which the protein concentration was measured by BCA assay. All parameters were evaluated on a SpectraMax Plus 384 Microplate Reader (Molecular Devices, Sunnyvale, CA, United States) using commercially available diagnostic kits in accordance with the manufacturer’s instructions.
Sample pre-treatment for UHPLC/MS analysis
Serum samples: Aliquots of serum (200 μL) were diluted with 600 μL of acetonitrile. After vortex-mixing and resting at 4 °C for 20 min, the samples were centrifuged at 12000 rpm and 4 °C for 15 min. The collected supernatants were dried under a gentle nitrogen stream. The obtained residues were re-dissolved in 100 μL of acetonitrile for metabolomics analysis.
Urine samples: Samples were lyophilized to a powder using a FD5-3 freeze dryer (SIM International Group Co. Ltd., Newark, DE, United States). The obtained sample powders were dissolved with 100 μL of water and then diluted with 300 μL of acetonitrile. After vortex-mixing and resting at 4 °C for 20 min, the samples were centrifuged at 12000 rpm and 4 °C for 15 min. The collected supernatants were dried with a gentle nitrogen stream. The residues were re-dissolved in 100 μL of acetonitrile for metabolomics analysis.
Liver samples: Samples were thawed at room temperature before pre-treatment. Liver tissue (0.2 g) from each rat was homogenized with 1.0 mL of normal saline and then diluted with 300 μL of acetonitrile. After vortex-mixing and resting at 4 °C for 20 min, the samples were centrifuged at 12000 rpm and 4 °C for 15 min. The collected supernatants were dried with a gentle nitrogen stream. The residues were re-dissolved in 100 μL of acetonitrile for metabolomics analysis.
Conditions of UHPLC/MS analysis
UHPLC/MS analyses were performed on an UHPLC Dionex Ultimate 3000 system coupled with a Thermo Scientific Q-Exactive TM hybrid quadrupole-orbitrap mass spectrometer with a heated-electrospray ionization probe (Thermo Fisher Scientific, San Jose, CA, United States). The UHPLC system consisted of a quaternary pump, an auto-sampler with a temperature control function, a column box, and a photodiode array (PDA) detector.
UHPLC conditions for all samples were: (1) chromatographic column: Thermo C18 column (100 mm × 2.1 mm I.D., 1.9 μm); (2) mobile phase: 0.1% formic acid (A) and acetonitrile (B) with a gradient program (0-3 min, 5% B; 3-5 min, 5% B → 23% B; 5-10 min, 23% B → 43% B; 10-13 min, 43% B → 64% B; 13-16 min, 64% B → 85% B; 16-18 min, 85% B → 100% B; 18-20 min, 100% B → 100% B); (3) flow rate: 0.2 mL/min; and (4) sample injection volume: 4 μL.
MS conditions for all samples were: (1) flow rate: 0.2 mL/min (split from UPLC effluent); (2) detection mode: positive and negative ion; (3) heat block and curved desolvation line temperature: 250 °C; nebulizing nitrogen gas flow: 1.5 L/min; interface voltage: (+) 3.5 kV, (-) -2.8 kV; (4) mass range: MS, m/z 100-1000; MS2 and MS3, m/z 50-1000; (5) dynamic exclusion time: 10 s; and (6) workstation: Xcalibar 3.0.63 for liquid chromatography combined with data processing, molecular prediction, and precise molecular weight calculations.
Statistical analysis
Lipid concentrations in serum and liver are expressed as the mean ± standard deviation (SD). Statistical analyses were performed using SPSS software (13.0 for Windows; SPSS, Chicago, IL, United States). Differences between groups were analyzed by one-way analysis of variance (ANOVA, Dunnett’s method). P < 0.05 (two-tailed) was considered statistically significant.
All UHPLC/MS raw files were exported in Xcalibur Raw File (.raw) format and converted to computable document format (.cdf) with Xcalibur 2.0 software (Thermo Fisher Scientific, Waltham, MA, United States). The converted file was then transferred into XCMS online (https://xcmsonline.scripps.edu) to output all data, including groups and comparisons. After that, multivariate statistical analysis, including principal components analysis (PCA) and orthogonal partial least squares discriminant analysis (OPLS-DA), was performed on SIMCA-P 14.1 software (Umetrics, Umeå, Sweden). Potential biomarkers were selected according to the parameters of variable importance in the projection (VIP > 1.0) from OPLS-DA. The metabolites were identified using METLIN database and compared with data reported previously. Finally, biochemical reactions involving the identified metabolites were found through the Kyoto Encyclopedia of Genes and Genomes (KEGG) in MetaboAnalyst4.0 online (http://www.metaboanalyst.ca).
RESULTS
Effects of HFD and P. kingianum on body weight and food intake
In the present study, a HFD rat model was used to investigate the potential effect of P. kingianum on HFD-mediated dyslipidemia that was induced by administration of an HFD over a 14-wk period. P. kingianum extract was administered by oral gavage at s dosage of 4 g/(kg•d) during HFD administration. During the experiment, none of the rats died, and they had healthy-looking fur, normal drinking habits, moved freely and rapidly responded to external stimuli. As shown in Table 1, the HFD slightly increased body weight, but P. kingianum and simvastatin showed a non-significant effect on body weight and food intake.
Table 1.
Body weight and food intake of rats
| Normal control | Model | Simvastatin | P. kingianum | |
| Initial body weight (g) | 200.87 ± 8.83 | 206.69 ± 8.51 | 205.03 ± 6.26 | 206.72 ± 7.82 |
| Final body weight (g) | 494.81 ± 37.43 | 518.08 ± 40.50 | 487.62 ± 30.26 | 480.14 ± 29.91 |
| Body weight gain (g) | 293.94 ± 28.61 | 311.39 ± 31.98 | 282.59 ± 24.01 | 273.42 ± 22.10 |
| Food intake (g) | 15670.81 | 15042.53 | 14969.08 | 14903.86 |
Values represent the mean ± SD from five animals. P. kingianum: Polygonatum kingianum.
Effects of P. kingianum on lipids in serum and liver samples from HFD-fed rats
The effects of P. kingianum on lipids in serum and liver samples were first assessed in a rat model of HFD-induced dyslipidemia. As shown in Table 2, 14 wk of HFD feeding resulted in a significant increase in TC concentration, but had no significant effect on TG concentration in serum. These effects were significantly reduced by simvastatin, which is known to correct dyslipidemias[15]. Similar to simvastatin, P. kingianum remarkably prevented HFD-induced dyslipidemias. Furthermore, Table 3 shows that after 14 wk of HFD feeding, hepatic TC and TG concentrations were significantly increased compared with the normal control group. However, these effects were significantly reduced by P. kingianum and simvastatin treatment.
Table 2.
Effects of Polygonatum kingianum on total cholesterol and triglyceride concentrations in rat serum
| Group | TC (mmol/L) | TG (mmol/L) |
| Normal group | 1.42 ± 0.11c | 0.91 ± 0.21 |
| Model group | 1.56 ± 0.11a | 0.97 ± 0.22 |
| P. kingianum group | 1.43 ± 0.13c | 0.76 ± 0.13c |
| Simvastatin group | 1.15 ± 0.09bd | 0.77 ± 0.09c |
Values represent the mean ± SD from five animals.
P < 0.05,
P < 0.01 vs the relative normal group.
P < 0.05,
P < 0.01 vs the relative model group. P. kingianum: Polygonatum kingianum; TC: Total cholesterol; TG: Triglyceride.
Table 3.
Effects of Polygonatum kingianum on total cholesterol and triglyceride concentration in rat liver
| Group | TC (mmol/gprot) | TG (mmol/gprot) |
| Normal group | 0.77 ± 0.19d | 1.46 ± 0.12d |
| Model group | 1.17 ± 0.22b | 2.83 ± 0.71b |
| P. kingianum group | 0.95 ± 0.15c | 1.20 ± 0.28d |
| Simvastatin group | 0.94 ± 0.15c | 1.37 ± 0.43d |
Values represent the mean ± SD from five animals. aP < 0.05,
P < 0.01 vs the relative normal group.
P < 0.05,
P < 0.01 vs the relative model group. P. kingianum: Polygonatum kingianum; TC: Total cholesterol; TG: Triglyceride.
Metabolomic profiling of serum, urine and liver samples
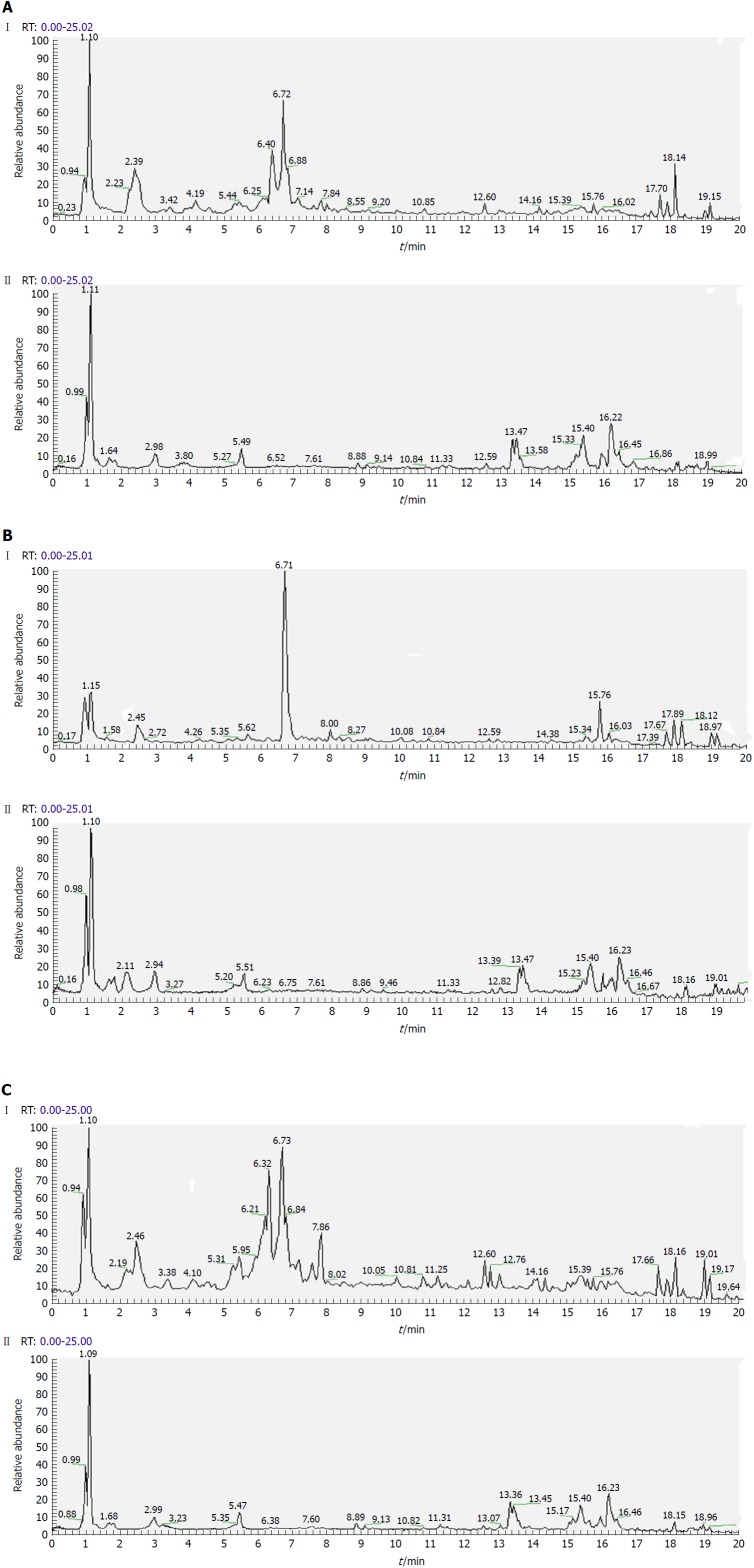
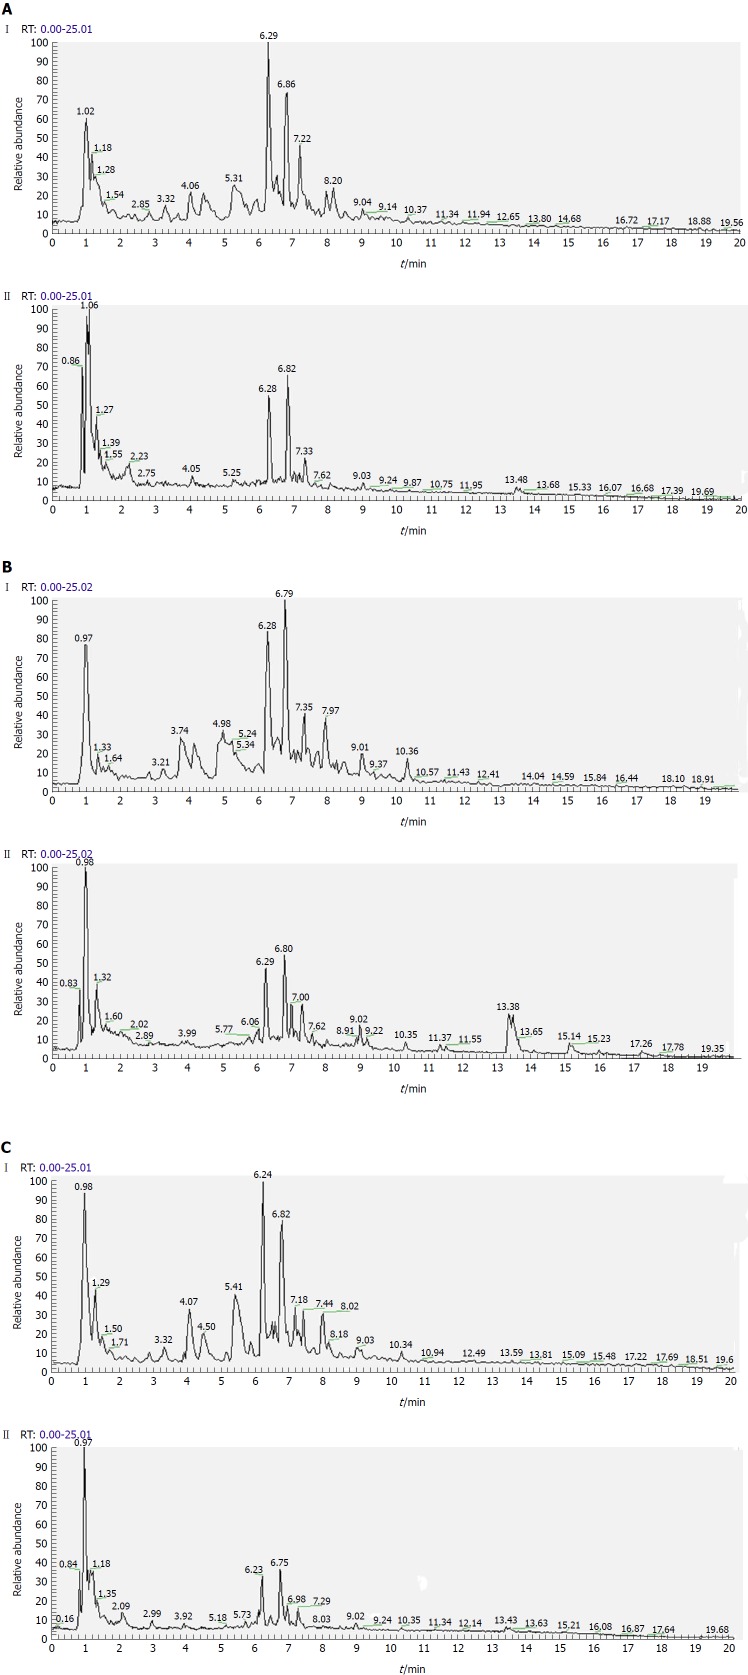
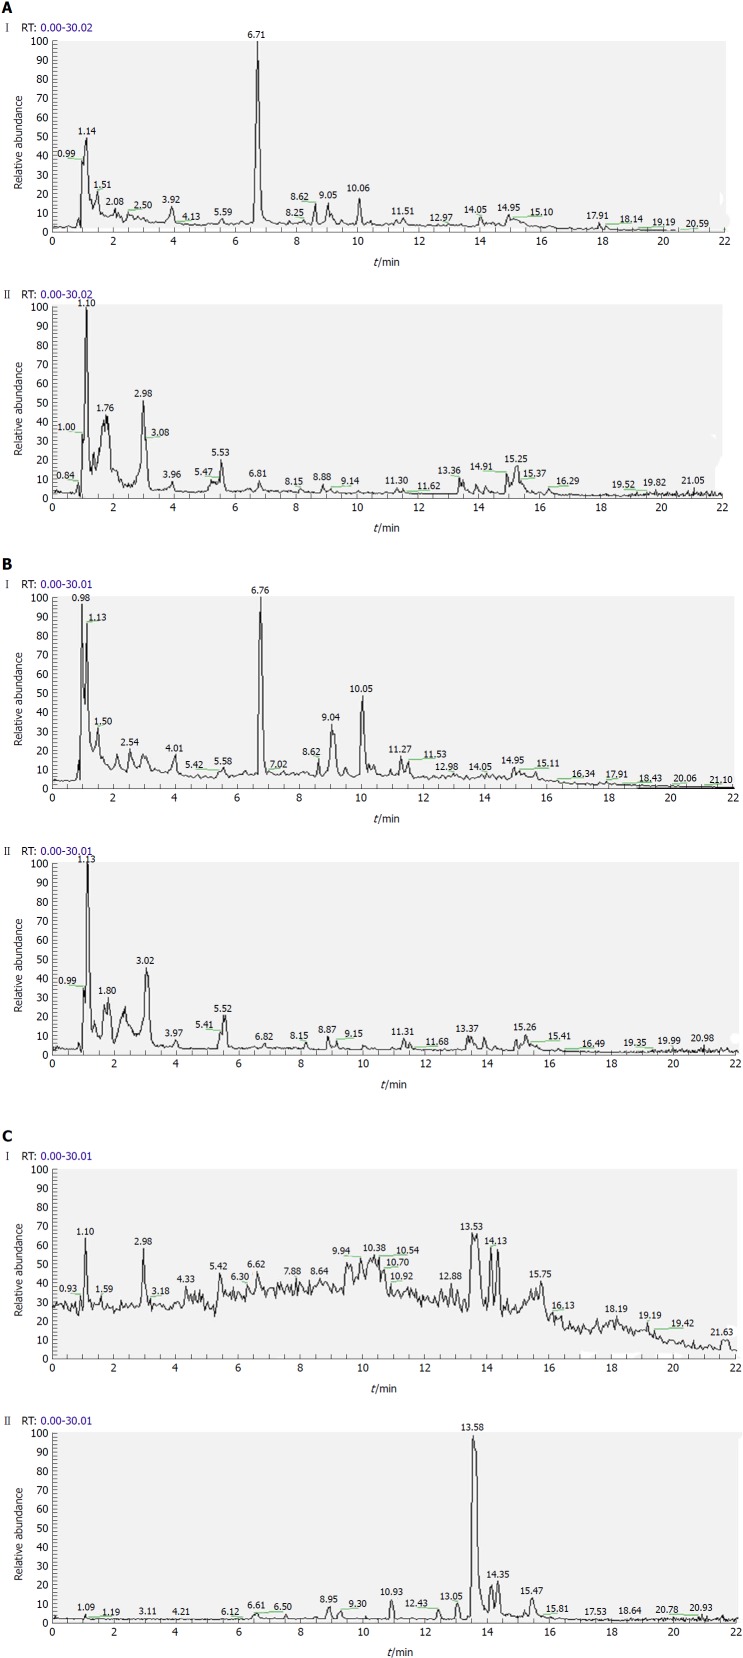
Separation conditions of the three samples on the UHPLC column were optimized in terms of peak number, peak shape and reproducibility. Figures 3-5 shows representative total ion current profiles of the positive and negative ion modes of the four groups in serum, urine and liver, respectively. A large number of molecules were profiled by UHPLC/MS in the analyzed samples. Moreover, there were significant differences in peak number and intensity between the four groups within each of the three sample types. This indicated different metabolomic states in the different groups. Hence, after 14 wk of HFD feeding and administration of P. kingianum and simvastatin, the metabolites in serum, urine and liver samples were significantly different.
Figure 3.
Representative total ion current profiles of serum samples in the negative (I) and positive (II) ion modes. A: Control group; B: Model group; and C: Polygonatum kingianum group.
Figure 4.
Representative total ion current profiles of urine samples in the negative (I) and positive (II) ion modes. A: Control group; B: Model group; and C: Polygonatum kingianum group.
Figure 5.
Representative total ion current profiles of liver samples in the negative (I) and positive (II) ion modes. A: Control group; B: Model group; and C: Polygonatum kingianum group.
Multivariate statistical analysis of metabolomic data
PCA and OPLS-DA are frequently used for multivariate data analysis because of their ability to cope with highly multivariate, noisy, collinear and possibly incomplete data. PCA is an unsupervised pattern recognition method that is initially used to discern the presence of inherent similarities in profiles. OPLS-DA is a supervised pattern recognition approach based on a partial least squares algorithm that has higher sensitivity for biomarker detection than other methods.
Serum samples
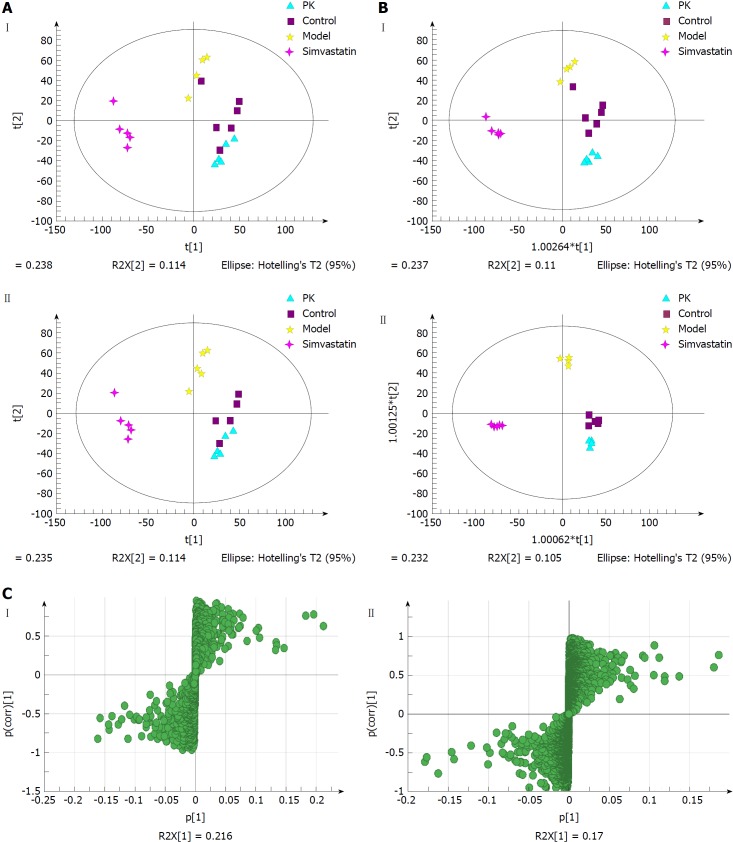
Figure 6A shows the PCA score plots of serum samples in positive and negative ion modes. The normal control, model, simvastatin and P. kingianum groups were located in four different regions of the scatter score map. The four sample sets were basically separated. Additionally, the P. kingianum group was closer to the normal group than the simvastatin group and partially overlapped with the normal group. This indicated that the composition and concentration of metabolites in the P. kingianum group was more similar to the control group. Thus, P. kingianum treatment remarkably prevented HFD-induced pathological changes.
Figure 6.
Multivariate statistical analysis of serum samples from model and Polygonatum kingianum groups in the negative (I) and positive (II) ion modes. A: Principal components analysis score plots; B: Orthogonal partial least squares discriminant analysis score plots; C: S-plot loading diagram. PK: Polygonatum kingianum.
OPLS-DA was performed to further verify sample separation from the four groups, to maximize separation between groups and to identify biomarkers from them (Figure 6B). The OPLS-DA score plots were described by the cross-validation parameter, R2Y, and Q2, which represent the total explained variation for the X matrix and the predictability of the model, respectively. In positive and negative ion modes, the four groups were also significantly separated. The P. kingianum and simvastatin groups were both close to the control group, which further indicated that P. kingianum treatment strongly prevented HFD-induced pathological changes.
To further evaluate the component changes after treatment, an S-Plot loading diagram was established based on OPLS-DA. As shown in Figure 6C, each point represents a variable that shows the biomarker that caused the difference between the model and P. kingianum groups. The importance of each variable to the classification was evaluated by the VIP value, with molecules with a VIP > 1.0 selected as potential biomarkers.
Urine samples
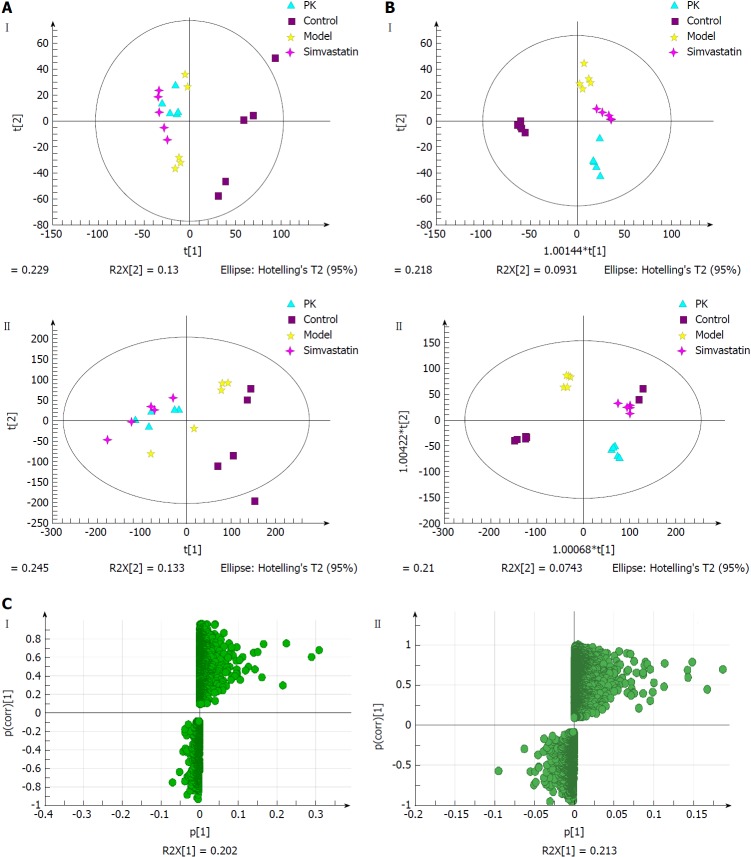
Figure 7A shows the PCA score plots of urine samples in positive and negative ion modes. The control group was clearly distinguished from the other three groups, which overlapped partially. In the negative ion mode, there were abnormal sets in the control group, which might be due to individual sample differences that resulted in outlier sample points being outside the 95% confidence interval. The model group was significantly different from the control group. The P. kingianum and simvastatin groups had a tendency to deviate from the model group, while the P. kingianum group was closer to the cross than the simvastatin group. Compared with the model group, the P. kingianum group had a tendency to approach the part samples of the control group and deviate from the part samples of the control group. This was because the appearance of the outlier sample points seriously affected the clustering result. In the positive ion mode, outlier sample points appeared in the control group. The model group had a tendency to deviate to the left compared with the control group. The P. kingianum group partially overlapped with the simvastatin group, but did not approach the control group. This was considered to be related to the outlier sample points of the control group.
Figure 7.
Multivariate statistical analysis of urine samples from model and Polygonatum kingianum groups in the negative (I) and positive (II) ion modes. A: Principal components analysis score plots; B: Orthogonal partial least squares discriminant analysis score plots; C: S-plot loading diagram. PK: Polygonatum kingianum.
Figure 7B shows the OPLS-DA diagrams of urine samples in positive and negative ion modes. The results suggested that the samples from all groups were perfectly separated, and samples in each group were well clustered. The model group was significantly different from the control group, indicating that physiological metabolism in the urine of rats was seriously interfered with by the HFD. The sample points of the P. kingianum group showed a tendency to approach the control group, indicating that HFD-induced changes were relieved after P. kingianum administration. Figure 7C shows the S-Plot loading diagram of urine samples and the substances with a VIP > 1.0 that were selected as biomarkers.
Liver samples
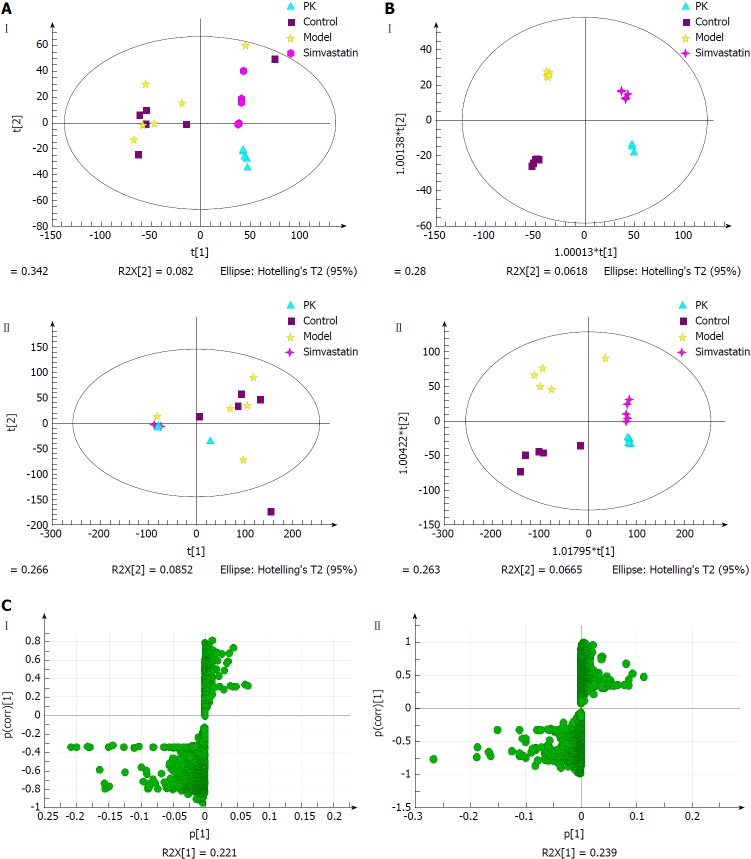
Figure 8A displays the PCA score plots of liver samples in positive and negative ion modes. In the negative ion mode, all samples were distributed within the 95% confidence interval. The control group partially overlapped with the model group, which might be due to the unsupervised pattern recognition of PCA analysis. In the positive ion mode, there were outlier sample points in the control group. The P. kingianum group was significantly different from the control and model groups, indicating that P. kingianum administration interfered with metabolism in the rats.
Figure 8.
Multivariate statistical analysis of liver samples from model and Polygonatum kingianum groups in the negative (I) and positive (II) ion modes. A: Principal components analysis score plots; B: Orthogonal partial least squares discriminant analysis score plots; C: S-plot loading diagram. PK: Polygonatum kingianum.
Figure 8B showed the OPLS-DA diagrams of liver samples in positive and negative ion modes. The results suggested that the samples from all groups were perfectly separated, and the samples in each group were well clustered. The P. kingianum group was closer to the control group than the simvastatin group, which indicated that P. kingianum had significant effects on metabolomic changes in the liver. Figure 8C shows the S-Plot loading diagrams of urine samples and the substances with a VIP > 1.0 that were selected as biomarkers.
Potential biomarker identification
Nineteen compounds were identified from serum samples, including four in the negative ion mode and 15 in the positive ion mode. They were amino acids, carbohydrates and esters (Table 4). There were 24 compounds identified from urine samples, including seven in the negative ion mode and 17 in the positive ion mode. They were amino acids, organic acids and esters (Table 5). Finally, 38 compounds were identified from liver samples, including 18 in the negative ion mode and 22 in the positive ion mode. They were amino acids, organic acids and esters (Table 6).
Table 4.
Potential biomarkers identified from serum samples
| Retention time (min) | Molecular weight (Da) | VIP | Potential biomarker | Formula |
Change trend |
| Model-PKRP | |||||
| ESI- | |||||
| 0.928261 | 215.032 | 6.26699 | 2-C-Methyl-D-erythritol 4-phosphate | C5H13O7P | down |
| 8.30572 | 245.048 | 2.59774 | Pimpinellin | C13H10O5 | down |
| 17.7034 | 327.233 | 1.53493 | 3-Methyl-5-pentyl-2-furannonanoic acid | C19H32O3 | down |
| 13.0574 | 437.291 | 1.03338 | 4,4'-Diaponeurosporene | C30H42 | up |
| ESI+ | |||||
| 1.11629 | 132.102 | 21.806 | Isoleucine | C6H13NO2 | down |
| 0.997628 | 132.077 | 16.0576 | 3-Guanidinopropanoate | C4H9N3O2 | up |
| 1.0913 | 118.087 | 14.9589 | Aminopentanoic acid | C5H11NO2 | up |
| 15.9773 | 496.338 | 14.2141 | LysoPC(16:0) | C24H50NO7P | up |
| 2.1554 | 166.086 | 11.8849 | L-Phenylalanine | C9H11NO2 | down |
| 5.46147 | 205.097 | 10.6298 | L-Tryptophan | C11H12N2O2 | up |
| 0.9767 | 203.053 | 10.4336 | α-D-Glucose | C6H12O6 | down |
| 18.5687 | 400.332 | 9.59788 | Palmitoyl-L-carnitine | C23H45NO4 | down |
| 1.09687 | 150.058 | 9.09347 | L-Methionine | C5H11NO2S | down |
| 1.10844 | 182.081 | 8.07313 | L-Tyrosine | C9H11NO3 | up |
| 5.6576 | 202.086 | 6.72953 | 2'-Aminobiphenyl-2,3-diol | C12H11NO2 | down |
| 6.83329 | 160.096 | 6.65796 | 4-Hydroxystachydrine | C7H13NO3 | up |
| 0.960596 | 140.068 | 6.04106 | Pentanoic acid | C5H11NO2 | down |
| 15.0993 | 478.306 | 1.00334 | 1-Oleoyl lysophosphatidic acid | C21H41O7P | down |
| 10.4394 | 288.216 | 2.12052 | L-Octanoylcarnitine | C15H29NO4 | down |
VIP: Variable importance in the projection.
Table 5.
Potential biomarkers identified from urine samples
| Retention time (min) | Molecular weight (Da) | VIP | Potential biomarker | Formula |
Change trend |
| Model-PKRP | |||||
| ESI- | |||||
| 9.00895 | 213.113 | 1.42124 | 2,2'-(3-Methylcyclohexane-1,1-diyl) diacetic acid | C11H18O4 | up |
| 3.93717 | 218.103 | 1.32234 | Pantothenic acid | C9H17NO5 | up |
| 14.0675 | 265.148 | 1.35019 | Cumanin | C15H22O4 | up |
| 1.11379 | 254.981 | 1.3057 | Ascorbate-2-sulfate | C6H8O9S | down |
| 0.990052 | 308.099 | 1.2533 | N-Acetylneuraminic acid | C11H19NO9 | down |
| 3.03597 | 365.135 | 1.15211 | Tetrahydropentoxyline | C17H22N2O7 | down |
| 17.8994 | 303.233 | 1.12374 | Arachidonic acid | C20H32O2 | up |
| ESI+ | |||||
| 8.40988 | 173.117 | 1.51559 | 4-Hydroxynonenoic acid | C9H16O3 | up |
| 6.14752 | 172.007 | 1.50165 | L-Homocysteine sulfonic acid | C3H9NO3S2 | up |
| 10.4959 | 187.126 | 1.47714 | 1-Phenyl-5-propyl-1H-pyrazole | C12H14N2 | up |
| 8.40656 | 155.106 | 1.46075 | 4-Oxo-2-nonenal | C9H14O2 | up |
| 8.2458 | 190.115 | 1.44948 | N6-Carbamoyl-DL-lysine | C7H15N3O3 | up |
| 1.89902 | 213.123 | 1.39163 | Butethal | C17H22N2O7 | up |
| 13.7859 | 256.263 | 1.38483 | Palmitic amide | C16H33NO | up |
| 6.67969 | 172.097 | 1.34087 | (3-Methylcrotonyl)glycine methyl ester | C8H13NO3 | up |
| 17.9836 | 315.252 | 1.33499 | 9,10-DiHOME | C18H34O4 | up |
| 3.91979 | 220.118 | 1.30061 | Pantothenic acid | C9H17NO5 | up |
| 7.08734 | 192.066 | 1.26102 | 5-Hydroxyindoleacetic acid | C10H9NO3 | up |
| 0.839605 | 146.165 | 1.24838 | Spermidine | C7H19N3 | up |
| 0.924092 | 170.093 | 1.24502 | 1-Methylhistidine | C7H11N3O2 | up |
| 1.09509 | 189.123 | 1.23644 | N-Alpha-acetyllysine | C8H16N2O3 | up |
| 9.40433 | 139.112 | 1.20585 | 2-Pentylfuran | C9H14O | up |
| 7.33104 | 143.107 | 1.20454 | 2-Octenoic acid | C8H14O2 | up |
| 3.91714 | 222.122 | 1.19506 | Vinyl-L-NIO | C9H17N3O2 | up |
VIP: Variable importance in the projection.
Table 6.
Potential biomarkers identified from liver samples
| Retention time (min) | Molecular weight (Da) | VIP | Potential biomarker | Formula |
Change trend |
| Model-PKRP | |||||
| ESI- | |||||
| 3.95787 | 218.103 | 9.02621 | Pantothenic acid | C9H17NO5 | up |
| 5.52016 | 203.082 | 5.17533 | L-Tryptophan | C11H12N2O2 | up |
| 17.9144 | 303.232 | 2.67441 | Arachidonic acid | C20H32O2 | up |
| 8.18557 | 241.073 | 2.08795 | Lumichrome | C12H10N4O2 | down |
| 17.6944 | 327.233 | 2.03102 | Docosahexaenoic acid | C22H32O2 | down |
| 9.27129 | 201.112 | 1.77891 | Sebacic acid | C10H18O4 | down |
| 18.1942 | 279.232 | 1.75755 | Linoleic acid | C18H32O2 | up |
| 11.3188 | 464.302 | 1.75082 | Glycocholic acid | C26H43NO6 | down |
| 13.9455 | 313.24 | 1.66517 | 9,10-DiHOME | C18H34O4 | down |
| 15.9588 | 319.227 | 1.58662 | 16R-HETE | C20H32O3 | up |
| 7.08734 | 353.234 | 1.56066 | PGE1 | C20H34O5 | up |
| 10.8984 | 227.128 | 1.45155 | Traumatic acid | C12H20O4 | down |
| 2.5168 | 251.079 | 1.41613 | Deoxyinosine | C10H12N4O4 | down |
| 11.4285 | 221.081 | 1.39399 | Apiole | C12H14O4 | down |
| 16.2815 | 339.199 | 1.28069 | Canrenone | C22H28O3 | down |
| 11.4127 | 351.219 | 1.14883 | PGE2 | C20H32O5 | up |
| 15.6357 | 343.228 | 1.0584 | Medroxyprogesterone | C22H32O3 | down |
| 19.0468 | 281.249 | 1.03242 | Ethyl palmitoleate | C18H34O2 | down |
| ESI+ | |||||
| 5.58168 | 205.097 | 25.6421 | L-Tryptophan | C11H12N2O2 | up |
| 1.12985 | 123.055 | 23.4569 | Niacinamide | C6H6N2O | up |
| 3.94534 | 220.118 | 15.5283 | Pantothenic acid | C9H17NO5 | down |
| 1.07398 | 244.092 | 13.5445 | Cytarabine | C9H13N3O5 | down |
| 1.65458 | 182.081 | 12.3842 | L-Tyrosine | C9H11NO3 | up |
| 0.901697 | 132.077 | 8.82297 | 3-Guanidinopropanoate | C4H9N3O2 | down |
| 0.990524 | 203.053 | 8.06945 | L-(+)-Gulose | C6H12O6 | down |
| 2.07851 | 269.088 | 7.66822 | Inosine | C10H12N4O5 | down |
| 15.0942 | 302.305 | 7.59274 | Sphinganine | C18H39NO2 | down |
| 1.48196 | 153.04 | 7.19394 | Xanthine | C5H4N4O2 | down |
| 6.38205 | 130.159 | 6.90221 | Octylamine | C8H19N | down |
| 1.21181 | 150.058 | 6.25979 | L-Methionine | C5H11NO2S | down |
| 0.83538 | 146.165 | 6.24439 | Spermidine | C7H19N3 | down |
| 2.90983 | 285.083 | 5.64503 | Xanthosine | C10H12N4O6 | down |
| 1.64612 | 165.055 | 5.16323 | m-Coumaric acid | C9H8O3 | down |
| 11.3366 | 181.122 | 4.58665 | Dihydroactinidiolide | C11H16O2 | down |
| 1.14382 | 204.123 | 4.29542 | Succinylmonocholine | C9H17NO4 | down |
| 2.20661 | 218.139 | 4.21655 | Propionyl-L-carnitine | C10H19NO4 | down |
| 5.73361 | 114.092 | 3.42289 | ε-Caprolactam | C6H11NO | down |
| 17.9613 | 305.248 | 1.8771 | Arachidonic acid | C20H32O2 | up |
| 13.2435 | 299.201 | 1.60893 | Norethindrone | C20H26O2 | down |
| 11.7171 | 181.122 | 1.58994 | Dihydroactinidiolide | C11H16O2 | down |
VIP: Variable importance in the projection.
Metabolic pathway analysis
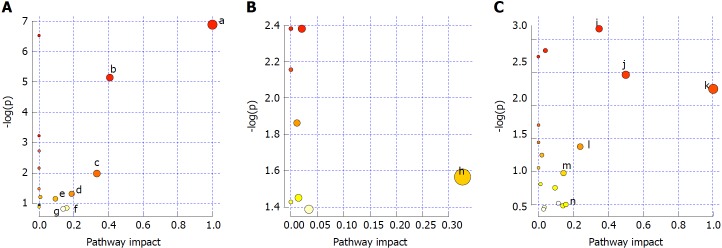
Pathways with influence values greater than 0.1 were selected as the metabolic pathways[16]. Pathway impact plots were built to visualize the impact of altered metabolic pathways (Figure 9A). According to these, the major intervening pathways in serum samples involved phenylalanine, tyrosine, tryptophan, valine, leucine and isoleucine biosynthesis, and phenylalanine, starch, sucrose, glycerophospholipid, tryptophan and tyrosine metabolism (Figure 9A, Table 7). In urine samples, the major intervening pathway involved arachidonic acid metabolism (Figure 9B, Table 8). In liver samples, the major intervening pathways involved phenylalanine, tyrosine and tryptophan biosynthesis, and arachidonic acid, linoleic acid, nicotinate, nicotinamide, sphingolipid, tryptophan and tyrosine metabolism (Figure 9C, Table 9).
Figure 9.
Analysis of metabolic pathways in serum (A), urine (B) and liver (C) samples. a: Phenylalanine, tyrosine and tryptophan biosynthesis; b: Phenylalanine metabolism; c: Valine, leucine and isoleucine biosynthesis; d: Starch and sucrose metabolism; e: Glycerophospholipid metabolism; f: Tryptophan metabolism; g: Tyrosine metabolism; h: Arachidonic acid metabolism; i: Arachidonic acid metabolism; j: Phenylalanine, tyrosine and tryptophan biosynthesis; k: Linoleic acid metabolism; l: Nicotinate and nicotinamide metabolism; m: Sphingolipid metabolism; n: Tryptophan metabolism; and o: Tyrosine metabolism.
Table 7.
Results of metabolic pathway analysis of serum samples
| No. | Pathway | Match status | P value | Impact | Details |
| 1 | Phenylalanine, tyrosine and tryptophan biosynthesis | 2/4 | 8.19E-04 | 1.0 | KEGG |
| 2 | Phenylalanine metabolism | 2/9 | 0.0047415 | 0.40741 | KEGG |
| 3 | Valine, leucine and isoleucine biosynthesis | 1/11 | 0.126 | 0.33333 | KEGG |
| 4 | Starch and sucrose metabolism | 1/23 | 0.24635 | 0.18783 | KEGG |
| 5 | Glycerophospholipid metabolism | 1/30 | 0.30916 | 0.19753 | KEGG |
| 6 | Tryptophan metabolism | 1/41 | 0.39801 | 0.15684 | KEGG |
| 7 | Tyrosine metabolism | 1/42 | 0.40552 | 0.14045 | KEGG |
KEGG: Kyoto Encyclopedia of Genes and Genomes.
Table 8.
Results of metabolic pathway analysis in urine samples
| No. | Pathway | Match status | P value | Impact | Details |
| 1 | Arachidonic acid metabolism | 1/36 | 0.20927 | 0.32601 | KEGG |
KEGG: Kyoto Encyclopedia of Genes and Genomes.
Table 9.
Results of metabolic pathway analysis in liver samples
| No. | Pathway | Match status | P value | Impact | Details |
| 1 | Arachidonic acid metabolism | 3/36 | 0.042685 | 0.34677 | KEGG |
| 2 | Phenylalanine, tyrosine and tryptophan biosynthesis | 1/4 | 0.085643 | 0.5 | KEGG |
| 3 | Linoleic acid metabolism | 1/5 | 0.10592 | 1.0 | KEGG |
| 4 | Nicotinate and nicotinamide metabolism | 1/13 | 0.25318 | 0.2381 | KEGG |
| 5 | Sphingolipid metabolism | 1/21 | 0.37685 | 0.14286 | KEGG |
| 6 | Tryptophan metabolism | 1/41 | 0.60553 | 0.15684 | KEGG |
| 7 | Tyrosine metabolism | 1/42 | 0.61452 | 0.14045 | KEGG |
KEGG: Kyoto Encyclopedia of Genes and Genomes.
DISCUSSION
Dyslipidemia is mainly characterized by an increase in TC and TG concentrations in the serum and/or liver. We found that HFD feeding resulted in a significant increase in TC concentration in serum, and in TC and TG concentrations in the liver. This indicated that an HFD could induce hyperlipidemia. P. kingianum extract significantly inverted these HFD-induced changes, demonstrating that P. kingianum effectively ameliorated dyslipidemia in HFD-fed rats. Additionally, due to fundamental differences in plasma lipoprotein metabolism between rats and humans, it is valuable to use an optimal pathological model to evaluate the lipid-regulating effects of P. kingianum.
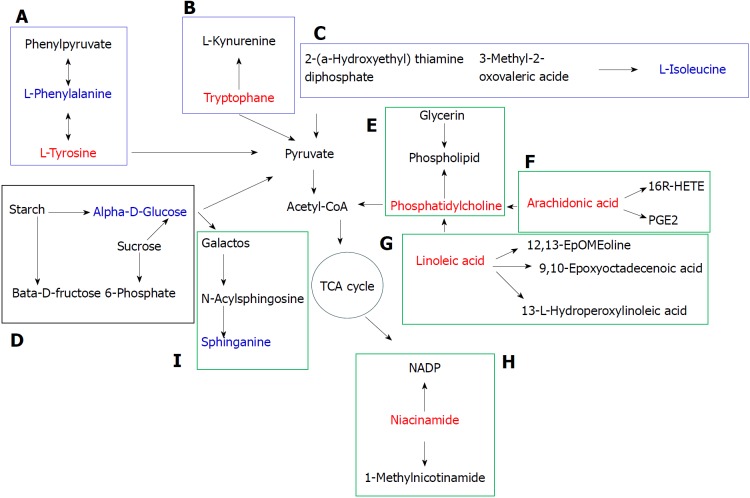
Metabolomics has been applied widely to the research of drug efficacy and the associated mechanism of action[17]. Currently, the most common samples analyzed in metabolomics are serum, urine, tissues/organs, feces, cells and sub-cells. We used serum, urine and liver samples for metabolomic analysis. The liver is the most important locus for substance metabolism, and also the main site for lipid and amino acid metabolism. External stimuli (e.g. a drug) may cause hepatic metabolites to change affecting the physiological function of the liver[18]. Serum reflects the overall status of an organism. When metabolic abnormalities occur in the liver, the metabolites in blood may change through the blood circulation. Urine is an important excretion pathway for metabolites and contains abundant metabolomic information about an organism. Eleven main metabolic pathways affected by P. kingianum administration were found in the three samples, including seven in serum and in the liver, and one in urine (Figure 10).
Figure 10.
Metabolic pathway map of potential biomarkers. The red and blue font represents potential biomarkers that were up- and down-regulated by Polygonatum kingianum treatment, respectively. The blue, black and green box represents amino acid, sugar and lipid metabolism, respectively. A: Phenylalanine, tyrosine and tryptophan biosynthesis, and phenylalanine and tyrosine metabolism; B: Tryptophan metabolism; C: Valine, leucine and isoleucine biosynthesis; D: Starch and sucrose metabolism; E: Glycerophospholipid metabolism; F: Arachidonic acid metabolism; G: Linoleic acid metabolism; H: Nicotinate and nicotinamide metabolism; and I: Sphingolipid metabolism. TCA: Tricarboxylic acid.
Phenylalanine, tyrosine and tryptophan biosynthesis and metabolism
Amino acids are the body’s raw material for protein synthesis and are catabolic products. They participate in a variety of physiological and pathological processes, and their concentration often reflects the metabolic status of the body. In this study, a number of amino acid metabolic pathways were present in the serum and liver samples, with a decrease in these metabolites, indicating disordered amino acid metabolism. Dyslipidemia causes dysfunctional phenylalanine metabolism by inhibiting conversion of phenylalanine to tyrosine, which increases phenylalanine concentration in the blood. After P. kingianum administration, we showed decreased phenylalanine and increased tyrosine content in serum. Tyrosine is synthesized from phenylalanine and is necessary for synthesizing catecholamine hormones such as adrenaline (epinephrine). It also plays an important role in promoting energy metabolism, scavenging free radicals and relieving fatigue[19]. Tyrosine undergoes a series of metabolic reactions to form acetyl-CoA, which participates in the tricarboxylic acid (TCA) cycle. After P. kingianum administration, the tyrosine content was increased, which elevated the acetyl-CoA content and further accelerated lipid decomposition through the TCA cycle. Therefore, P. kingianum treatment reduced phenylalanine production and further increased tyrosine production by regulating phenylalanine, tyrosine and tryptophan biosynthesis, and phenylalanine and tyrosine metabolism.
Tryptophan, an essential amino acid for humans, has important functions for regulating lipid metabolism[20]. In addition, tryptophan can be converted to acetyl-CoA to participate in the TCA cycle. After P. kingianum administration, the tryptophan content was increased, which potentiated acetyl-CoA content and accelerated lipid decomposition. Thus, P. kingianum treatment increased tryptophan content and further relieved the disordered lipids by regulating tryptophan metabolism.
Valine, leucine and isoleucine biosynthesis
Biosynthesis of valine, leucine and isoleucine was involved in the serum samples. These amino acids can be broken down into glucose. We found that isoleucine was decreased by P. kingianum treatment, indicating a reduction in blood glucose. This affected the oxidation and decarboxylation of pyruvate, and further reduced lipid synthesis with glycerol to alleviate the lipid metabolic disorders.
Starch and sucrose metabolism
Starch and sucrose metabolism was involved in the serum samples. Glucose is the major energy source and metabolic intermediate of living cells. Starch is a polysaccharide that is composed of several glucose units. Sucrose is a disaccharide comprised of glucose and fructose molecules. Both sucrose and starch can be broken down into glucose by digestive juice. Glucose can be degraded to dihydroxyacetone phosphate by glycolysis. Dihydroxyacetone phosphate can be reduced to glycerol and can also be converted to pyruvate through glycolysis. Pyruvate is converted by oxidation and decarboxylation to acetyl-CoA, which can be used to synthesize fatty acids and further synthesize fat with glycerol[21]. We found that glucose content was reduced after P. kingianum administration, which signified that P. kingianum reduced lipid synthesis by regulating starch and sucrose metabolism.
Glycerophospholipid metabolism
Glycerophospholipid metabolism was involved in the serum samples. Phosphatidylcholine is the molecule from this pathway that was significantly changed after P. kingianum treatment. It is an important component of lipoproteins, a precursor of synthetic cholesterol and it facilitates cholesterol dissolution in bile[22]. Phosphatidylcholine can also disintegrate TGs and cholesterol in blood and in vascular walls, reducing lipid deposition in the vessel walls. It has been reported that people who eat a high-cholesterol diet with added phosphatidylcholine had lower blood cholesterol concentrations, supporting a hypolipidemic effect of phosphatidylcholine[23]. Fat is mainly transported by lipoprotein, while phosphatidylcholine is a vital substance for lipoprotein synthesis. Increased phosphatidylcholine content leads to accelerated hepatic lipoprotein synthesis, which potentiates TG conversion. Thus, insufficient hepatic phosphatidylcholine synthesis is an important contributor to fatty liver. We found that the phosphatidylcholine content was significantly increased after P. kingianum treatment, demonstrating that P. kingianum regulated glycerophospholipid metabolism to relieve dyslipidemia.
Arachidonic acid metabolism
Arachidonic acid metabolism was involved in the urine and liver samples, and was significantly changed by P. kingianum treatment. Cell stimulation results in decomposition of arachidonic acid into a free form by phospholipase A2, with subsequent release into cytosol. The free form produces hundreds of bioactive metabolites by a series of metabolic enzymes. These metabolites have important regulatory effects on lipoprotein metabolism. Arachidonic acid closely relates to development of hyperlipidemia. In addition to effectively reducing blood lipids, it also decreases malondialdehyde. The latter reflects the degree of lipid peroxidation in tissue cells, indicating that arachidonic acid inhibits lipid peroxidation. Our results showed increased arachidonic acid in the urine and liver samples after P. kingianum treatment. Thus, P. kingianum regulated arachidonic acid metabolism to alleviate dyslipidemia.
Linoleic acid metabolism
Linoleic acid metabolism was involved in the liver samples, and linoleic acid was significantly altered with P. kingianum treatment. Previous studies found that linoleic acid accelerated fatty acid oxidation and glucose decomposition. Moreover, increased linoleic acid concentrations promoted proliferation and differentiation of fatty cells[24]. We found linoleic acid content to be significantly increased after P. kingianum administration, suggesting that P. kingianum regulated linoleic acid metabolism.
Niacin and nicotinamide metabolism
Niacin and nicotinamide metabolism was involved in the liver samples. Nicotinamide was the molecule from this pathway that was significantly altered by P. kingianum treatment. Nicotinamide is a metabolite produced by amidation of niacin. Niacin reduces synthesis of low density lipoprotein cholesterol, TC and TG, and increases synthesis of high density lipoprotein cholesterol. This indicates that niacin regulates lipid metabolism[25]. Our results showed that niacinamide content was increased by P. kingianum treatment. This suggests that P. kingianum increases niacin to alleviate dyslipidemia by regulating hepatic niacin and nicotinamide metabolism.
Sphingolipid metabolism
Sphingolipid metabolism was involved in the liver samples. Sphingolipids regulate important cellular functions, with metabolic abnormalities in these lipids closely related to various diseases. Previous studies found that obese individuals have disordered sphingolipid metabolism, which appears as accumulation of sphingolipids (e.g., ceramide) in tissues and blood[26,27]. Sphingolipids can be metabolized to sphingosine. In our study, sphingosine content was decreased after P. kingianum treatment, suggesting that P. kingianum might decrease sphingolipid content to alleviate dyslipidemia by regulating hepatic sphingolipid metabolism.
Conclusion
Taken together, our data indicated that P. kingianum extract alleviated HFD-induced dyslipidemia by regulating a large number of endogenous metabolites in serum, urine and liver. This involved phenylalanine, tyrosine, tryptophan, valine, leucine and isoleucine biosynthesis, and tryptophan, tyrosine, phenylalanine, starch, sucrose, glycerophospholipid, arachidonic acid, linoleic acid, nicotinate, nicotinamide and sphingolipid metabolism. Thus, P. kingianum may be a promising lipid regulator to remedy dyslipidemia and further alleviate its related diseases.
ARTICLE HIGHLIGHTS
Research background
Dyslipidemia is an important risk factor for many vicious diseases such as diabetes and cardiovascular disease. Developing dyslipidemia regulators from traditional Chinese medicines (TCMs) to remedy lipid disorders represents attractive strategies for disease therapy. In China, Polygonatum kingianum (P. kingianum) has been used as an herb and nutritional food for centuries. Known pharmacological activities of P. kingianum include immune system stimulation, anti-aging effects and blood glucose regulation.
Research motivation
To date, studies on the effects of P. kingianum on dyslipidemia and the mechanism for these effects have not been investigated.
Research objectives
We aimed to identify the effects and mechanism of action of P. kingianum on dyslipidemia using an integrated untargeted metabolomic method.
Research methods
A rat model of dyslipidemia was induced with a high-fat diet (HFD) and rats were given P. kingianum [4 g/(kg•day)] intragastrically for 14 wk. Changes in serum and hepatic lipid parameters were evaluated. Metabolites in serum, urine and liver samples were profiled using ultra-high performance liquid chromatography/mass spectrometry followed by multivariate statistical analysis to identify potential biomarkers and metabolic pathways.
Research results
P. kingianum significantly inhibited the HFD-induced increase in total cholesterol and low density lipoprotein cholesterol in serum, and total cholesterol and triglyceride in the liver. P. kingianum also reduced hepatic high density lipoprotein cholesterol. P. kingianum significantly regulated metabolites in the analyzed samples toward normal status. Nineteen, twenty-four and thirty-eight potential biomarkers were identified in serum, urine and liver samples, respectively. These biomarkers involved 11 main metabolic pathways, including seven in serum and in the liver, and one in urine.
Research conclusions
P. kingianum alleviated HFD-induced dyslipidemia by regulating many endogenous metabolites in serum, urine and liver samples. This involved phenylalanine, tyrosine, tryptophan, valine, leucine and isoleucine biosynthesis, and tryptophan, tyrosine, phenylalanine, starch, sucrose, glycerophospholipid, arachidonic acid, linoleic acid, nicotinate, nicotinamide and sphingolipid metabolism.
Research perspectives
P. kingianum may be a promising lipid regulator to treat dyslipidemia and associated diseases.
Footnotes
Manuscript source: Unsolicited manuscript
Specialty type: Gastroenterology and hepatology
Country of origin: China
Peer-review report classification
Grade A (Excellent): 0
Grade B (Very good): 0
Grade C (Good): C
Grade D (Fair): 0
Grade E (Poor): 0
Institutional animal care and use committee statement: Approval from the Institutional Ethical Committee on Animal Care and Experimentations of Yunnan University of Traditional Chinese Medicine was obtained for this study.
Conflict-of-interest statement: The authors declare that there is no duality of interest associated with this manuscript.
Data sharing statement: No additional data are available.
ARRIVE guidelines statement: The authors had read the ARRIVE guidelines, and the manuscript was prepared and revised according to the ARRIVE guidelines.
Peer-review started: September 25, 2018
First decision: October 24, 2018
Article in press: November 16, 2018
P- Reviewer: Beltowski J S- Editor: Ma RY L- Editor: Wang TQ E- Editor: Yin SY
Contributor Information
Xing-Xin Yang, College of Pharmaceutical Science, Yunnan University of Traditional Chinese Medicine, Kunming 650500, Yunnan Province, China.
Jia-Di Wei, College of Pharmaceutical Science, Yunnan University of Traditional Chinese Medicine, Kunming 650500, Yunnan Province, China.
Jian-Kang Mu, College of Pharmaceutical Science, Yunnan University of Traditional Chinese Medicine, Kunming 650500, Yunnan Province, China.
Xin Liu, Beijing Entry-Exit Inspection and Quarantine Bureau, Beijing 100026, China.
Jin-Cai Dong, College of Pharmaceutical Science, Yunnan University of Traditional Chinese Medicine, Kunming 650500, Yunnan Province, China.
Lin-Xi Zeng, College of Pharmaceutical Science, Yunnan University of Traditional Chinese Medicine, Kunming 650500, Yunnan Province, China.
Wen Gu, College of Pharmaceutical Science, Yunnan University of Traditional Chinese Medicine, Kunming 650500, Yunnan Province, China.
Jing-Ping Li, College of Pharmaceutical Science, Yunnan University of Traditional Chinese Medicine, Kunming 650500, Yunnan Province, China.
Jie Yu, College of Pharmaceutical Science, Yunnan University of Traditional Chinese Medicine, Kunming 650500, Yunnan Province, China. cz.yujie@gmail.com.
References
- 1.Backstone RP. Obesity-related diseases and syndromes: Insulin resistance, type 2 diabetes mellitus, non-alcoholic fatty liver disease, cardiovascular disease, and metabolic syndrome. In: Backstone RP, editor. Obesity: The Medical Practitioner’s Essential Guide. Cham: Springer; 2016. pp. 83–108. [Google Scholar]
- 2.Naheed DT, Naheed T, Khan A. Dyslipidemias in type II diabetes mellitus patients in a teaching hospital of Lahore, Pakistan. Pak J Med Sci. 2003;19:283–286. [Google Scholar]
- 3.Athyros VG, Doumas M, Imprialos KP, Stavropoulos K, Georgianou E, Katsimardou A, Karagiannis A. Diabetes and lipid metabolism. Hormones (Athens) 2018;17:61–67. doi: 10.1007/s42000-018-0014-8. [DOI] [PubMed] [Google Scholar]
- 4.Sirtori CR. The pharmacology of statins. Pharmacol Res. 2014;88:3–11. doi: 10.1016/j.phrs.2014.03.002. [DOI] [PubMed] [Google Scholar]
- 5.Caamaño BH, Díaz JM, Bracho DG, Herrera H, Samur MC. Psychotic Acute Episode and Rhabdomyolysis after Lovastatin Ingestion. Rev Colomb Psiquiatr. 2012;41:672–679. doi: 10.1016/S0034-7450(14)60037-8. [DOI] [PubMed] [Google Scholar]
- 6.Chan K. Progress in traditional Chinese medicine. Trends Pharmacol Sci. 1995;16:182–187. doi: 10.1016/s0165-6147(00)89019-7. [DOI] [PubMed] [Google Scholar]
- 7.Yang XX, Gu W, Liang L, Yan HL, Wang YF, Bi Q, Zhang T, Yu J, Rao GX. Screening for the bioactive constituents of traditional Chinese medicines-progress and challenges. RSC Adv. 2017;7:3089–3100. [Google Scholar]
- 8.Kwon HJ, Hyun SH, Choung SY. Traditional Chinese Medicine improves dysfunction of peroxisome proliferator-activated receptor alpha and microsomal triglyceride transfer protein on abnormalities in lipid metabolism in ethanol-fed rats. Biofactors. 2005;23:163–176. doi: 10.1002/biof.5520230305. [DOI] [PubMed] [Google Scholar]
- 9.Chen H, Feng SS, Sun YJ, Yao ZY, Feng WS, Zheng XK. Advances in studies on chemical constituents of three medicinal plants from Polygonatum Mill. and their pharmacological activities. Zhongcaoyao. 2015;46:2329–2338. [Google Scholar]
- 10.Liu XQ, Yi H, Yao L, Ma HW, Zhang JY, Wang ZM. Advances in plants of Polygonatum and discussion of its development prospects. Zhongguo Yaoxue Zazhi. 2017;52:530–534. [Google Scholar]
- 11.Lu JM, Wang YF, Yan HL, Lin P, Gu W, Yu J. Antidiabetic effect of total saponins from Polygonatum kingianum in streptozotocin-induced daibetic rats. J Ethnopharmacol. 2016;179:291–300. doi: 10.1016/j.jep.2015.12.057. [DOI] [PubMed] [Google Scholar]
- 12.Yan H, Lu J, Wang Y, Gu W, Yang X, Yu J. Intake of total saponins and polysaccharides from Polygonatum kingianum affects the gut microbiota in diabetic rats. Phytomedicine. 2017;26:45–54. doi: 10.1016/j.phymed.2017.01.007. [DOI] [PubMed] [Google Scholar]
- 13.Wang Z, Zhang J, Ren T, Dong Z. Targeted metabolomic profiling of cardioprotective effect of Ginkgo biloba L. extract on myocardial ischemia in rats. Phytomedicine. 2016;23:621–631. doi: 10.1016/j.phymed.2016.03.005. [DOI] [PubMed] [Google Scholar]
- 14.Tao Y, Chen X, Li W, Cai B, Di L, Shi L, Hu L. Global and untargeted metabolomics evidence of the protective effect of different extracts of Dipsacus asper Wall. ex C.B. Clarke on estrogen deficiency after ovariectomia in rats. J Ethnopharmacol. 2017;199:20–29. doi: 10.1016/j.jep.2017.01.050. [DOI] [PubMed] [Google Scholar]
- 15.Han W, Li J, Tang H, Sun L. Treatment of obese asthma in a mouse model by simvastatin is associated with improving dyslipidemia and decreasing leptin level. Biochem Biophys Res Commun. 2017;484:396–402. doi: 10.1016/j.bbrc.2017.01.135. [DOI] [PubMed] [Google Scholar]
- 16.Xie HH, Xie T, Xu JY, Shen CS, Lai ZJ, Xu NS, Wang SC, Shan JJ. Metabolomics study of aconitine and benzoylaconine induced reproductive toxicity in BeWo cell. Fenxi Huaxue. 2015;43:1808–1813. [Google Scholar]
- 17.Chen H, Yuan B, Miao H, Tan Y, Bai X, Zhao YY, Wang Y. Urine metabolomics reveals new insights into hyperlipidemia and therapeutic effect of rhubarb. Anal Methods. 2015;7:2113–3123. [Google Scholar]
- 18.Kaplowitz N. Mechanisms of liver cell injury. J Hepatol. 2000;32:39–47. doi: 10.1016/s0168-8278(00)80414-6. [DOI] [PubMed] [Google Scholar]
- 19.Holme E, Mitchell GA. Tyrosine metabolism. In: Blau N, Duran M, Gibson K, Dionisi Vici C, editors. ed. Physician’s Guide to the Diagnosis, Treatment, and Follow-Up of Inherited Metabolic Diseases. Berlin, Heidelberg: Springer; 2014. pp. 23–31. [Google Scholar]
- 20.Owasoyo JO, Neri DF, Lamberth JG. Tyrosine and its potential use as a countermeasure to performance decrement in military sustained operations. Aviat Space Environ Med. 1992;63:364–369. [PubMed] [Google Scholar]
- 21.Catalano KJ, Maddux BA, Szary J, Youngren JF, Goldfine ID, Schaufele F. Insulin resistance induced by hyperinsulinemia coincides with a persistent alteration at the insulin receptor tyrosine kinase domain. PLoS One. 2014;9:e108693. doi: 10.1371/journal.pone.0108693. [DOI] [PMC free article] [PubMed] [Google Scholar]
- 22.Lagace TA. Phosphatidylcholine: Greasing the Cholesterol Transport Machinery. Lipid Insights. 2016;8:65–73. doi: 10.4137/LPI.S31746. [DOI] [PMC free article] [PubMed] [Google Scholar]
- 23.Wang TJ, Larson MG, Vasan RS, Cheng S, Rhee EP, McCabe E, Lewis GD, Fox CS, Jacques PF, Fernandez C, et al. Metabolite profiles and the risk of developing diabetes. Nat Med. 2011;17:448–453. doi: 10.1038/nm.2307. [DOI] [PMC free article] [PubMed] [Google Scholar]
- 24.West DB, Delany JP, Camet PM, Blohm F, Truett AA, Scimeca J. Effects of conjugated linoleic acid on body fat and energy metabolism in the mouse. Am J Physiol. 1998;275:R667–R672. doi: 10.1152/ajpregu.1998.275.3.R667. [DOI] [PubMed] [Google Scholar]
- 25.Iwaki M, Murakami E, Kakehi K. Chromatographic and capillary electrophoretic methods for the analysis of nicotinic acid and its metabolites. J Chromatogr B Biomed Sci Appl. 2000;747:229–240. doi: 10.1016/s0378-4347(99)00486-7. [DOI] [PubMed] [Google Scholar]
- 26.Turinsky J, O’Sullivan DM, Bayly BP. 1,2-Diacylglycerol and ceramide levels in insulin-resistant tissues of the rat in vivo. J Biol Chem. 1990;265:16880–16885. [PubMed] [Google Scholar]
- 27.Samad F, Hester KD, Yang G, Hannun YA, Bielawski J. Altered adipose and plasma sphingolipid metabolism in obesity: a potential mechanism for cardiovascular and metabolic risk. Diabetes. 2006;55:2579–2587. doi: 10.2337/db06-0330. [DOI] [PubMed] [Google Scholar]


