Abstract
Background
Piwi-interacting RNA (piRNA) is the largest class of small non-coding RNA, which has also been identified in somatic tissues, and aberrant expression of piRNAs in tumor tissues may be implicated in carcinogenesis. piR-823 is increased in liver cirrhosis and hepatocellular carcinoma (HCC). However, there is no report on the function of piR-823 in hepatic stellate cells (HSCs) activation during hepatic fibrosis. The present study investigated the role of piR-823 in HSC activation.
Matreial/Methods
Liver fibrosis was induced in mice by carbon tetrachloride (CCL4) injection and bile duct ligation (BDL). The primary HSCs were isolated from mice and cultured. The expression of piR-823 was measured by real-time PCR. The effect of piR-823 on HSCs was evaluated by either sense sequence or antisense sequence of piR-823 carried by liposome. Proteins binding to piR-823 were assayed by RNA pull-down technique and liquid chromatography-mass spectrometry (LC-MS).
Results
Our data for the first time show that piR-823 is significantly upregulated in activated HSCs. Overexpression of piR-823 promoted HSC proliferation, α-SMA and COL1a1 production, whereas inhibition of piR-823 suppressed the activity of HSCs. Interestingly, the combination of piR-823 and EIF3B promoted TGF-β1 expression.
Conclusions
Our data illustrate a novel mechanism of piR-823 in HSC activities. The combination of piR-823 and EIF3B increased TGF-β1 expression, which activates HSCs in liver fibrosis. piR-823 may be a new target in the treatment of liver fibrosis.
MeSH Keywords: Eukaryotic Initiation Factor-3; Hepatic Stellate Cells; Liver Cirrhosis; RNA, Small Interfering; Transforming Growth Factor beta
Background
Hepatic fibrogenesis is a process of hepatic reaction to chronic damage. Hepatic stellate cells (HSCs) play an essential role in liver fibrogenesis. In normal livers, HSCs are in a quiescent state. When hepatic tissues encounter insults, such as viral infections, alcohol, cholestasis, and chronic metabolic disorders, the HSCs are activated. The activated HSCs demonstrate characters of cytomegaly and proliferation, and they are the main source of myofibroblasts that synthesize the components of extracellular matrix (ECM) [1]. The accumulation of ECM results in liver fibrosis and cirrhosis. The mechanistic study of hepatic stellate cell (HSC) activation gives insights into liver fibrogenesis and provides new targets of treatment.
Piwi-interacting RNAs (piRNAs), characterized by a 3-terminal 2′-O-methylation, are a novel class of small non-coding RNAs which were originally found to maintain the integrity of the genome of germ cells [2–4]. Recent studies demonstrated that piRNAs promote cancer proliferation [5–7]. piR-823 is a member of the piRNA family, with 32 nucleotides, which is reported to promote tumor cell proliferation in multiple myeloma and colorectal cancer [6,7]. Rizzo et al. found that piR-823 is gradually increased from cirrhosis to low- and high-grade dysplastic nodules and to hepatocellular carcinoma (HCC) [8]. This indicates that piR-823 may play an important role in HCC. Interestingly, HSCs also play an important role in HCC [9,10]. However, the correlation between piR-823 and HSC activation is not clear.
We hypothesized that piR-823 may affect the activation of HSCs. However, as far as we know, there is no study of piR-823 in liver fibrosis. The present study investigated the role of piR-823 in HSCs activation and liver fibrogenesis.
Material and Methods
Animal models
All C57BL/6 mice provided by Vital River (Beijing, China) were kept in the animal house of the Second Hospital of Hebei Medical University, in a pathogen-free environment. The study was approved by our institution’s Institutional Laboratory Animal Care and Use Committee, and the entire animal study was conducted with sex- and age-matched groups.
CCL4 intoxication
Mice were randomly divided into 4 groups (n=10/group): Oil (control) group, 2w (CCL4) group, 4w (CCL4) group, and 6w (CCL4) group. Mice were intraperitoneally (i.p.) injected with 5 μl/g CCL4 (Aladdin Reagents Co., Shanghai, China) diluted 1: 9 with corn oil (Aladdin Reagents Co.) twice a week for 0, 2, 4, and 6 weeks. Tissues were collected 2 days after the final CCL4 injection.
Bile duct ligation
Mice were allocated into 2 groups (n=10/group): a bile duct ligation (BDL) group and a sham surgery (SH) group. In the BDL group, mice were anesthetized with 10% chloralhydrate (Sinopharm Chemical Reagent Co., Shanghai, China). After opening the abdomen, the common bile duct was ligated twice with 6-0 silk sutures and then the abdomen was closed [11]. The operation was the same as with BDL in SH mice, but without bile duct ligation. Mice were sacrificed and samples were collected 14 days after surgery.
Histology and immunohistochemistry
Histology of the liver was evaluated by hematoxylin and eosin (HE) staining and Sirius Red stain was used to evaluate liver fibrosis. Immunohistochemistry was used to detect alpha smooth muscle actin (α-SMA) and collagen type I-a1 (COL1a1), and 3% hydrogen peroxide (Solarbio, Beijing, China) was applied to inhibit endogenous peroxidase. We used 10 mM sodium citrate buffer (pH 6.0; Solarbio, Beijing, China) to retrieve antigen. The blocking reagent was Protein Block (Dako, Denmark) solution. Primary antibodies of α-SMA (diluted 1: 100; ab32575, Abcam, Cambridge, UK) and Collagen I (diluted 1: 100; AF7001, Affinity Biosciences, Cincinnati, OH, USA) diluted in Protein Diluent were incubated with slices at 4°C overnight. Polymer-horseradish peroxidase anti-rabbit (Dako) antibody was used as secondary antibody.
Isolation of primary hepatic stellate cells
HSCs were isolated from male C57BL/6 mice (26–30 g). After anaesthesia (10% chloralhydrate 5 mg/g body weight), the liver was perfused via the portal vein with EGTA, collagenase (Roche, Indianapolis, IN, USA) and proteinase (Roche) for cell dispersion. The cells were resuspended in 8 ml 30% Percoll (GE Healthcare Life Sciences, Freiburg, Germany), placed in a 15-ml centrifuge tube (BD Biosciences), and overlaid with 3 ml 70% Percoll solution. After being centrifuged at 2500 rpm for 20 min at room temperature, the various cell types were arranged according to their density. HSCs were enriched in an upper cell layer [12]. Then, we cultured HSCs in Dulbecco’s modified Eagle’s medium/F12 (DMEM/F12, GIBCO, Grand Island, NY, USA) with 20% fetal bovine serum (FBS, BioInd, Israel), 100 U/L penicillin, and 100 μg/mL streptomycin in a humidified 5% CO2 incubator. The microscope evaluation demonstrated that 98% of cells were HSCs.
Cell culture and transfection
We incubated 5×10⁶ LX-2, human HSC line (provided by Mount Sinai School of Medicine), and 1×10⁵ mouse primary HSCs as monolayers in 25-cm2 plastic tissue culture flasks with the supplementary media: Dulbecco’s modified Eagle’s medium (DMEM) (Gibco BRL, Rockville, MD, USA), and DMEM/F12 Medium (Gibco BRL) in a 37°C incubator with 5% CO2. Both media included 10% FBS (Gibco BRL), 100 U/mL penicillin, and 100 g/mL streptomycin. 2′-O-metholited 3′ and piR-823 mimics (mimics-823) was applied to upregulate piR-823. The modified antisense RNA sequence of piR-823 (antagomir-823) was applied to downregulate piR-823 expression. The modified EIF3B siRNA (siEIF3B) was used to inhibit EIF3B. The negative control (NC) was the non-specific scrambled RNA sequence. All sequences were synthesized by GenePharma Tech (Shanghai, China, Table 1). The cell transfection was performed by Lipofectamine RNAmax (Invitrogen, Carlsbad, CA, USA) with mimics-823, antagomir-823, or siEIF3B when HSCs reached 70% confluence.
Table 1.
Synthesized piRNA-823 mimics, antagomir, and other sequences.
| Sense (5′-3′) | Antisense (5′-3′) | |
|---|---|---|
| mimics-823 (human) | AGCGUUGGUGGUAUAGUGGUGAGCAUAGCUGC | AGCUAUGCUCACCACUAUACCACCAACGCUUU |
| mimics-NC (human) | UUCUCCGAACGUGUCACGUTT | ACGUGACACGUUCGGAGAATT |
| mimics-823 (mus) | GAUUAACAAACAUUGUGCUCCUCAACAUG | UGUUGAGGAGCACAAUGUUUGUUAAUCUU |
| mimics-NC (mus) | UUCUCCGAACGUGUCACGUTT | ACGUGACACGUUCGGAGAATT |
| antagomir-823 (human) | CAGUACUUUUGUGUAGUACAA | – |
| antagomir-NC (human) | CAGUACUUUUGUGUAGUACAA | – |
| antagomir-823 (mus) | CAUGUUGAGGAGCACAAUGUUUGUUAAUC | – |
| antagomir-NC (mus) | CAGUACUUUUGUGUAGUACAA | – |
| siEIF3B (human) | GCAAAUUCUUUGCCAGAAUTT | AUUCUGGCAAAGAAUUUGCTT |
| siEIF3B-NC (human) | UUCUCCGAACGUGUCACGUTT | ACGUGACACGUUCGGAGAATT |
Isolation of RNA and real-time PCR
Total RNA was extracted using a Pure Cell/Bacteria kit (Tiangen, Beijing, China). The miScript Plant RT Kit (Qiagen, Hilden, Germany) designed for small RNAs 3′end with 2′-O-Me modification was used for small RNA reverse transcription. The miScript SYBR Green PCR Kit (Qiagen) was used for real-time PCR. The specific primer sequence for piR-823 amplification was 5′-AGCGTTGGTGGTATAGTGGT-3′. The piR-823 normalization was set up by Hs_SNORD61_11 miScript Primer Assay (Qiagen). The FastQuant RT Kit (Tiangen) was applied for total RNA reverse transcription into cDNA. The quantity of cDNA was analyzed by SuperReal PreMix Plus (Tiangen). GAPDH was used as an internal control. The specific primers of α-SMA, col1a1, EIF3B, TGF-β1, and GAPDH are shown in Table 2, and relative expression was calculated using the 2−ΔΔCt method.
Table 2.
Primer for gene detection.
| Forward primer (5′-3′) | Reverse primer (5′-3′) | |
|---|---|---|
| α-SMA (human) | CCCCTGAAGAGCATCCCACCCTG | GGCCAGCCAGATCCAGACGCAT |
| α-SMA (mus) | CAATGGCTCTGGGCTCTGTA | CCCCCTGACAGGACGTTGTTA |
| COLIa1 (human) | CCCTCCTGACGCACGGCCAAG | CGCCGGGGCAGTTCTTGGTCTC |
| COLIa1 (mus) | ACGTGGAAACCCGAGGTATG | GGGTCCCTCGACTCCTACAT |
| GAPDH (human) | CCATGTTCGTCATGGGTGTGAACCA | GCCAGTAGAGGCAGGGATGATGTTC |
| GAPDH (mus) | AGGTCGGTGTGAACGGATTTG | GGGGTCGTTGATGGCAACA |
| EIF3B (human) | GCCGCCGCCAGCCGAGGG | CCGCGATCCCCACCTCCTCACTG |
| TGF-β1 (human) | CGCAAGGACCTCGGCTGGAAGTG | GCGCCCGGGTTATGCTGGTTGTA |
| U6 (universal) | CTCGCTTCGGCAGCACA | AACGCTTCACGAATTTGCGT |
CCK-8 assay and BrdU assay
Cells were cultured in microtiter plates for cell proliferation and viability assay. CCK-8 kit (Dojindo Laboratories, Kumamoto, Japan) was used for cell activity analysis. CCK-8 (10 IL/well) was added into plates and incubated with cells for 2 h. The absorbance was measured with a microplate reader (BioTek, Winooski, VT, USA) at 450 nm wavelength. Cell proliferation was measured using a BrdU cell proliferation enzyme-linked immunosorbent assay (ELISA) kit (Abcam, Cambridge, UK). Cells were incubated with 20 ul BrdU- labeling solution per well for 4 h at 37°C. After fixing, cells were incubated with 100 ul of the anti-BrdU-peroxidase antibody solution for 90 min at room temperature. After washing, 100 ul substrate solution was added per well for 10 min and the reaction was stopped with 25 ul 1M H2SO4. The absorbance was measured with a microplate reader (BioTek, Winooski, VT, USA) at 450 nm wavelength.
Western blot analysis
Cytolysis buffer (RIPA buffer, Sigma-Aldrich, St. Louis, MO, USA) was used to extract proteins from HSCs. Proteins were quantified by Pierce BCA Protein Assay Kit (Thermo Scientific, Waltham, Massachusetts, USA), denatured in SDS loading buffer (Solarbio, Beijing, China) at 95°C, separated by SDS-PAGE, and then transferred to polyvinylidene difluoride (PVDF) membranes (Thermo Fisher Scientific, Waltham, MA, USA). The membranes were blocked with 5% skim milk, incubated with primary antibodies against α-SMA (diluted 1: 1000, ab32575, Abcam, Cambridge, UK), Collagen 1a1 (diluted 1: 500, AF7001, Affinity Biosciences, Cincinnati, OH, USA), EIF3B (diluted 1: 1000, ab133601, Abcam, Cambridge, UK), and GAPDH (diluted 1: 10000, AB0037, Shanghai Abways Biotechnology Co., Shanghai, China) overnight at 4°C. The secondary antibody incubations (diluted 1: 20 000, IRDye, 800CW 926-32211, LI-COR Biosciences, Lincoln, NE, USA) were for 1 h at room temperature. The final results were observed by Odyssey infrared imaging system (LI-COR Biosciences, Lincoln, NE, USA), and the protein densities were analyzed with ImageJ software (National Institutes of Health, Bethesda, MD, USA). The primary antibody of anti-α-SMA and anti-EIF3B were from Abcam, Cambridge, UK, anti-Collagen 1a1 was from Affinity Biosciences, Shanghai, China, and anti-GAPDH was from Cell Signaling Technology, Danvers, MA, USA.
Biochemistries and TGF-β1 measurement
Serum samples from mice were collected to measure alanine aminotransferase (ALT), aspartate aminotransferase (AST), and total bilirubin (TBIL) using kits purchased from NanJing JianCheng Bioengineering Institute (Nanjing, China). The concentration of TGF-β1 in LX-2 cells lysates was evaluated using ELISA kits (Multi Sciences Biotech Co., Hangzhou, China).
Biotinylated RNA pull-down assay
piR-823 mimic, which served as piR-823 probe, and mimic control (negative control) were labeled with biotin [13]. Both of them were incubated with LX-2 cell lysate (≥2 mg/ml) for 30 min at 25°C. The biotin-labeled RNAs and associated proteins were trapped by streptavidin beads (Thermo Fisher Scientific, Waltham, MA, USA) [14]. The complexes of RNA-protein were separated by SDS-PAGE and stained by Coomassie brilliant blue. In addition, the evaluation of recruited differential proteins was set by liquid chromatography-mass spectrometry (LC-MS) or Western blot. Primers used for synthesizing piR-823 mimic and negative control RNA are listed in Table 3.
Table 3.
piRNA-823 and NC sequence from RNA pull-down experiments.
| Forward primer (5′-3′) | Reverse primer (5′-3′) | |
|---|---|---|
| piRNA-823 (human) | AGCGUUGGUGGUAUAGUGGU | – |
| NC | CAGUACUUUUGUGUAGUACAA | – |
Liquid chromatography-mass spectrometry (LC-MS)
Proteins were first separated and purified via SDS-page gel. The peptide extracts were used for LC-MS analysis [15,16]. The online Nano-RPLC was used on the Eksigent NanoLC-Ultra™ 2D System (AB SCIEX, Zef Scientific, Inc. Medford, MA, USA). The samples were loaded on a C18 NanoLC trap column (100 μm×3 cm, C18, 3 μm, 150 Å) and washed with Nano-RPLC Buffer A (0.1%FA, 2%ACN) at 2 μL/min for 10 min. An elution gradient of 5–35% acetonitrile (0.1% formic acid) in 90-min gradient was used on an analytical ChromXP C18 column (75 μm×15 cm, C18, 3 μm 120 Å) with a spray tip.
Data acquisition was performed with the Triple TOF 5600 System (AB SCIEX, USA) fitted with a Nanospray III source (AB SCIEX, USA). Based on combined MS and MS/MS spectra, proteins were successfully identified based on 95% or higher confidence interval of their scores in the MASCOT V2.3 search engine (Matrix Science, London, U.K.).
RNA-immunoprecipitation (RIP) assay
RIP assay was conducted using the Magna RIP Kit (Millipore, Billerica, MA, USA) [17,18]. Cytolysis (2×10⁷/sample) was carried out with RIP Lysis Buffer; followed by incubation with protein A/G magnetic beads coated with rabbit anti-EIF3B (Abcam, Cambridge, UK) or rabbit IgG antibody (Millipore) as a negative control. RIP Wash Buffer was used to wash magnetic beads 6 times. The proteins were digested with the proteinase K at 55°C for 30 min. The RNAs bound with EIF3B were extracted using phenol: chloroform: Isoamyl alcohol (125: 24: 1; Coolaber, Beijing, China) and precipitated with ethanol. Purified RNAs were analyzed by real-time PCR using the piR-823-specific primer.
Statistical analysis
Data are expressed as mean ±SEM. The difference between 2 groups was analyzed by t test. For difference among multiple groups, one-way ANOVA was performed. Statistical analysis was performed using SPSS software version 17.0 (Chicago, IL, USA). P values of <0.05 were considered statistically significant.
Results
piR-823 was upregulated in activated HSCs
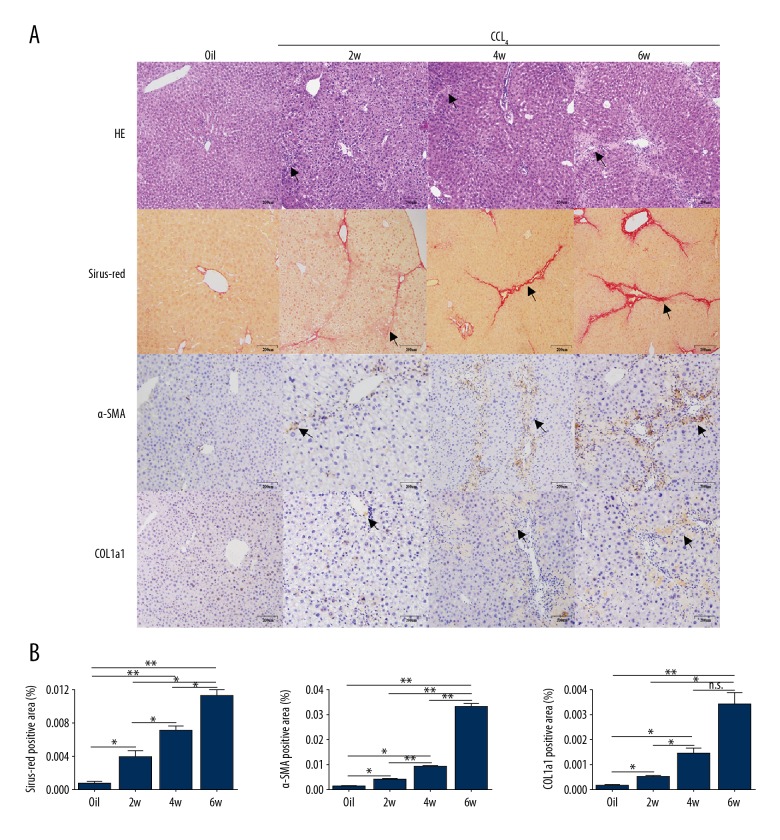
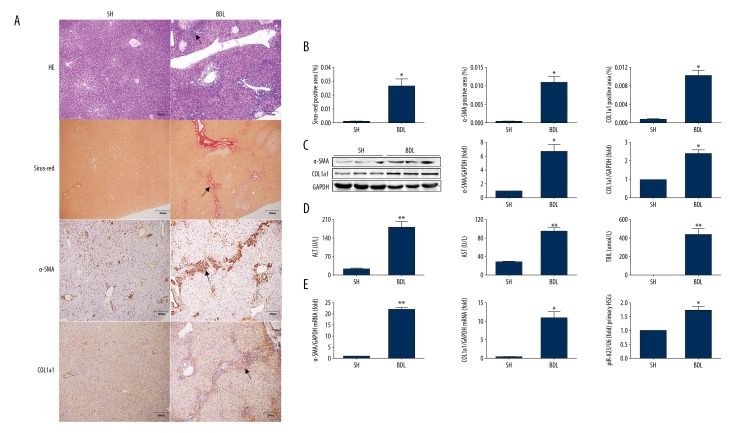
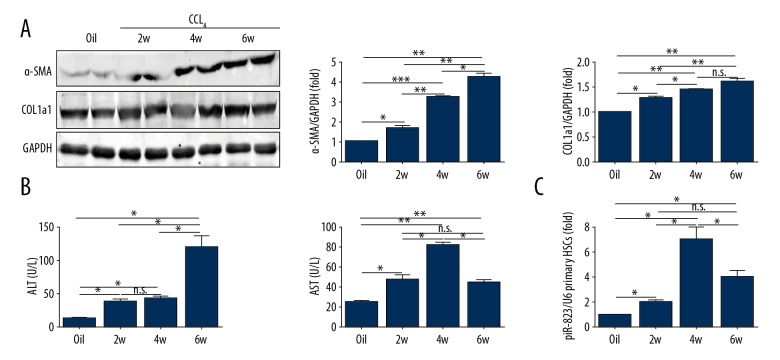
HE staining of CCL4-treated mice demonstrated severe hepatocytic necrosis in the hepatic lobule. In addition, the immune cells were infiltrated into the hepatic parenchyma (Figure 1A). Apart from the above inflammatory feature, the cholangiolars were dilated in BDL mice (Figure 2A). Sirius red staining showed excessive collagen fiber precipitations in both the CCL4 model and cholestatic livers (Figures 1A, 1B, 2A, 2B). Immunohistological staining showed more collagen I expression in fibrotic livers compared with the control group (Figures 1A, 1B, 2A, 2B). α-SMA, an activated HSC marker, was also significantly increased in CCL4 and BDL mice (Figures 1A, 1B, 2A, 2B). The biochemical and molecular biological analysis demonstrated that α-SMA and collagen type I-a1 (COL1a1) were increased at the protein level in CCL4-treated and BDL groups compared with controls (Figures 2C, 2E, 3A). ALT and AST levels were higher in CCL4-treated and BDL groups compared with controls (Tables 4, 5 and Figures 2D, 3B). In addition, TBIL level was higher in BDL mice than in SH controls (Table 5, Figure 2D).
Figure 1.
The pathological pictures of CCL4-treated mice. (A) HE-staining, Sirius Red-staining and IHC of α-SMA and COL1a1 (bar scale, 200 μm). (B) The area of fibrotic tissue, α-SMA, and COL1a1. Bars=means ±SEM, n=10. * P<0.05, ** P<0.01, and n.s. no significant difference. CCL4 – carbon tetrachloride; HE – hematoxylin and eosin; IHC – immunohistochemistry; α-SMA – alpha smooth muscle actin; COL1a1 – collagen type I alpha 1.
Figure 2.
piR-823 is upregulated in activated primary HSCs from BDL mice. (A) HE-staining, Masson-staining, Sirius Red-staining, and IHC of α-SMA and COL1a1 (bar scale, 200μm). (B) Fibrotic area in Masson and Sirius Red-staining and positive cells in IHC of α-SMA and COL1a1 from liver tissues. (C) Protein expressions of α-SMA and COL1a1 from liver tissues. (D) Liver chemistries. (E) Quantitative PCR analysis of α-SMA and COL1a1 from liver tissues. (F) Real-time PCR analysis of piR-823 in primary HSCs from mice. Bars=means ±SEM, n=10. * P<0.05 and ** P<0.01. ECM – extracellular matrix; SH – sham surgery; BDL – bile duct ligation; HE – hematoxylin and eosin; IHC – immunohistochemistry; α-SMA – alpha smooth muscle actin; COL1a1 – collagen type I alpha 1; ALT – alanine aminotransferase; AST – aspartate aminotransferase; TBIL – total bilirubin; HSCs – hepatic stellate cells.
Figure 3.
piR-823 is upregulated in activated primary HSCs from CCL4-treated mice. (A) Protein expression of α-SMA and COL1a1 from mouse liver. (B) Liver chemistries. (C) Real-time PCR analysis of piR-823 in primary HSCs from mice. Bars=means ±SEM, n=10. * P<0.05, ** P<0.01, and n.s. no significant difference. CCL4 – carbon tetrachloride; α-SMA – alpha smooth muscle actin; COL1a1 – collagen type I alpha 1; HSCs – hepatic stellate cells.
Table 4.
Changes in serum ALT and AST in different groups of CCL4-induced liver fibrotic mice.
| Group | ALT (U/L) | AST (U/L) |
|---|---|---|
| Oil (control) | 12.43±2.16 | 24.89±1.99 |
| 2w (CCL4) | 37.67±2.34* | 46.14±5.01# |
| 4w (CCL4) | 43.62±3.26* | 82.27±3.99# |
| 6w (CCL4) | 137.43±7.01* | 42.88±3.00# |
Change in serum ALT compared with Oil group,
P<0.05; change in serum AST compared with Oil group,
P<0.05.
Table 5.
Changes of serum ALT, AST, and TBIL in BDL-induced liver fibrotic mice compared with sham controls.
| Group | ALT (U/L) | AST (U/L) |
|---|---|---|
| ALT | 22.52±4.25 | 187.71±18.45* |
| AST | 27.29±1.63 | 93.50±12.50* |
| TBIL | 0±0 | 434.50±87.90* |
Compared with SH group,
P<0.05
As a type of ECM-producing cell that can affect the progression of liver fibrosis, the primary HSCs were isolated from the fibrosis and control groups to assess the piR-823 expression. Clearly, piR-823 expression in primary HSCs from the fibrosis group was significantly higher than that in primary HSCs from the control group (Figures 2F, 3C).
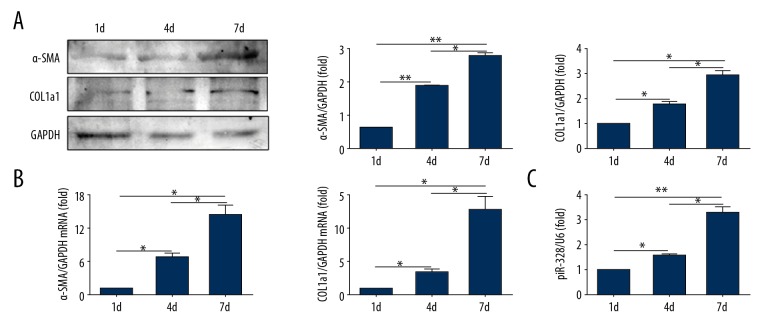
The expressions of α-SMA and COL1a1 were longitudinally increased with the time of primary cell culture both at mRNA and protein levels; (Figure 4A, 4B). Also, piR-823 was upregulated in parallel with α-SMA and COL1a1 (Figure 4C).
Figure 4.
piR-823 is upregulated in self-activated primary HSCs from normal mice cultured in vitro. (A) Protein expressions of α-SMA and COL1a1 were longitudinally increased following primary cell culture. (B) mRNA expressions of α-SMA and COL1a1 were longitudinally increased following the time of primary cell culture. (C) Real-time PCR showed that the expression of piR-823 was upregulated in parallel to α-SMA and COL1a1. Bars=means ±SEM, n=3. * P<0.05, ** P<0.01. α-SMA – alpha smooth muscle actin; COL1a1 – collagen type I alpha 1; HSCs – hepatic stellate cells.
Overexpression of piR-823 activated HSCs
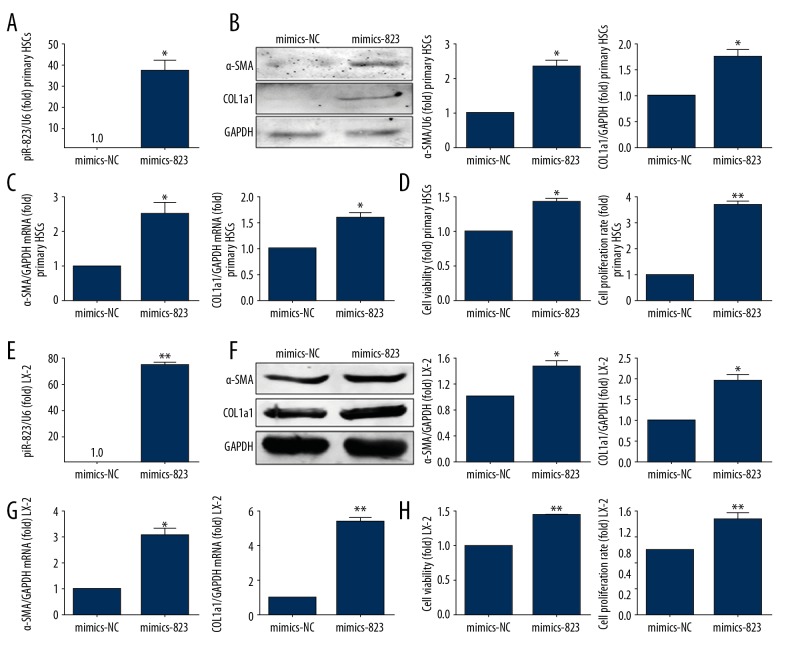
The expression of piR-823 was significantly increased in primary HSCs and LX-2 cells transfected by piR-823 mimics (Figure 5A, 5E, P<0.05). The transfection of primary HSCs from wild-type mice with piR-823 mimics significantly increased α-SMA and COL1a1 expressions compared with those transfected with scrambled-piR (Figure 5B, 5C, P<0.05). Furthermore, piR-823 transfection significantly increased the viability and proliferation of HSCs (P<0.05) (Figure 5D). LX-2 cells transfected with piR-823 mimics also showed increased viability and proliferation and elevated secretion of α-SMA and COL1a1 (Figure 5E–5H).
Figure 5.
piR-823 overexpression activated HSCs. Experiments were performed in primary HSCs (A–D) and cell line (E–H). (A) Expression of piR-823 was significantly increased in primary HSCs infected with piR-823 mimics compared with that in the control group. (B, C) The expressions of α-SMA and COL1a1 were significantly increased at both protein and mRNA levels in primary HSCs infected with piR-823 mimics compared with that in the control group. (D) The cell viability and proliferation were enhanced in primary HSCs infected with piR-823 mimics. (E) Expression of piR-823 was significantly increased in LX-2 cells infected with piR-823 mimics compared with the negative control. (F, G) The expressions of α-SMA and COL1a1 were significantly increased at both protein and mRNA levels in LX-2 cells infected with piR-823 mimics compared with those in the control group. (H) The cell viability and proliferation were enhanced in LX-2 cells infected with piR-823 mimics. Bars=means ±SEM, n=3. * P<0.05, ** P<0.01. HSCs – hepatic stellate cells; α-SMA – alpha smooth muscle actin; COL1a1 – collagen type I alpha 1; NC – negative control.
Inhibition of piR-823 suppressed HSCs activity
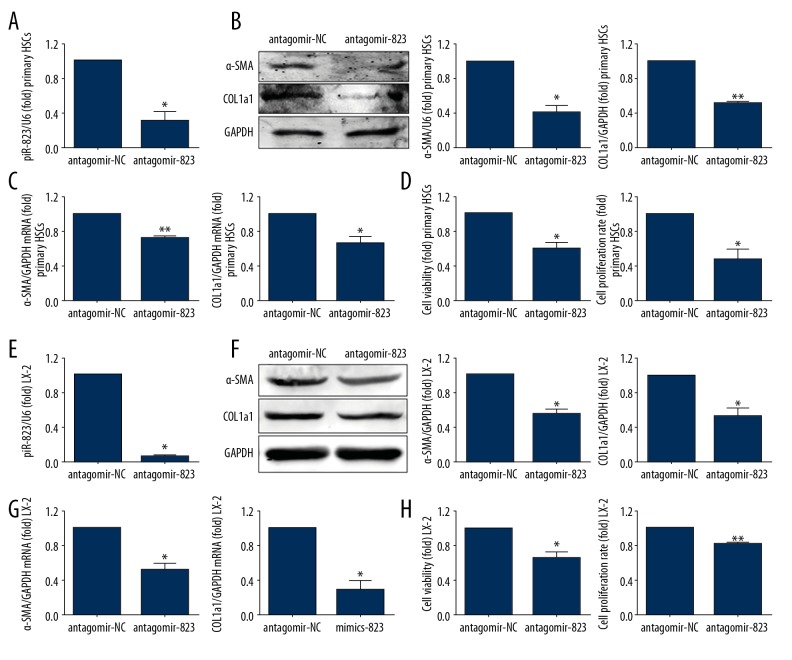
Primary HSCs and LX-2 cells transfected by piR-823 antagomir had significantly decreased piR-823 expression (Figure 6A) and cellular viability and proliferation compared with antagomir control (P<0.05), and the α-SMA and COL1a1 were also significantly decreased (P<0.05) (Figure 6).
Figure 6.
Knockdown of piR-823 suppressed the activity of HSCs. Experiments were performed in primary HSCs (A–D) and cell line (E–H). (A) Expression of piR-823 was decreased in primary HSCs infected with piR-823 antagomir compared with that in the control group. (B, C) The expressions of α-SMA and COL1a1 were significantly decreased in both protein and mRNA levels in primary HSCs infected with piR-823 mimics compared with that in the control group. (D) The cell viability and proliferation were reduced in primary HSCs infected with piR-823 mimics. (E) Expression of piR-823 was significantly decreased in LX-2 cells infected with piR-823 antagomir compared with that in the control group. (F, G) The expressions of α-SMA and COL1a1 were significantly decreased at both protein and mRNA levels in LX-2 cells infected with piR-823 mimics compared with those in the control group. (H) The cell viability and proliferation were reduced in LX-2 cells infected with piR-823 mimics. Bars=means ±SEM. * P<0.05, ** P<0.01. HSCs – hepatic stellate cells; α-SMA – alpha smooth muscle actin; COL1a1 – collagen type I alpha 1.
RNA-binding protein EIF3B functioned as a piR-823-binding partner
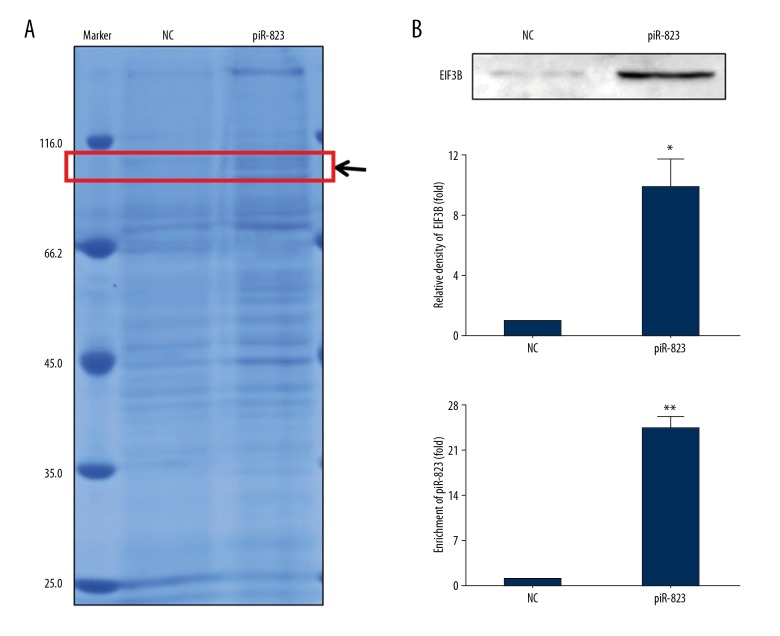
From RNA pull-down assay we collected the proteins solution captured by piR-823 RNA. The result of Coomassie brilliant blue staining showed that the piR-823 channel has an additional protein band compared to the control channel (red box in Figure 7A, indicated by black arrow) (Figure 7A). LC-MS differentiated proteins (Table 6 shows the proteins binding with piR-823; all the proteins analyzed by LC-MS are showed in electronic supplementary material) and EIF3B were further analyzed. Western blot analysis revealed that EIF3B was within the piR-823 RNA probe pulled-down samples (Figure 7B). RIP assay also showed the endogenous association between EIF3B and piR-823 (Figure 7C).
Figure 7.
The interaction between EIF3B and piR-823 in LX-2 cells. (A) We collected the RNA-protein solution from RNA pull-down experiment and Coomassie brilliant blue staining showed that the piR-823 channel had 1 additional protein band as compared to the control channel (red box, indicated by black arrow). (B) Western blot analysis to test the EIF3B combined with piR-823. (C) Real-time PCR to test the piR-823 RNA combined with EIF3B. Bars=means ±SEM. n=3, * P<0.05, ** P< 0.01. EIF3B – eukaryotic initiation factor 3 B.
Table 6.
Proteins binding with piR-823 analyzed by LC-MS.
| Protein | Coverage (%) | Peptides | Unique |
|---|---|---|---|
| HNRPU | 5 | 4 | 4 |
| SFPQ | 7 | 4 | 4 |
| PSA | 6 | 4 | 4 |
| RIR1 | 5 | 4 | 4 |
| MCM6 | 3 | 2 | 2 |
| PLOD1 | 4 | 3 | 3 |
| FUBP2 | 7 | 4 | 4 |
| AP2A2 | 3 | 2 | 2 |
| AT2A2 | 2 | 2 | 2 |
| EIF3B | 2 | 2 | 2 |
| DHX15 | 3 | 2 | 2 |
| MCM3 | 2 | 2 | 2 |
Interaction between piR-823 and EIF3B affects the translation of TGF-β1
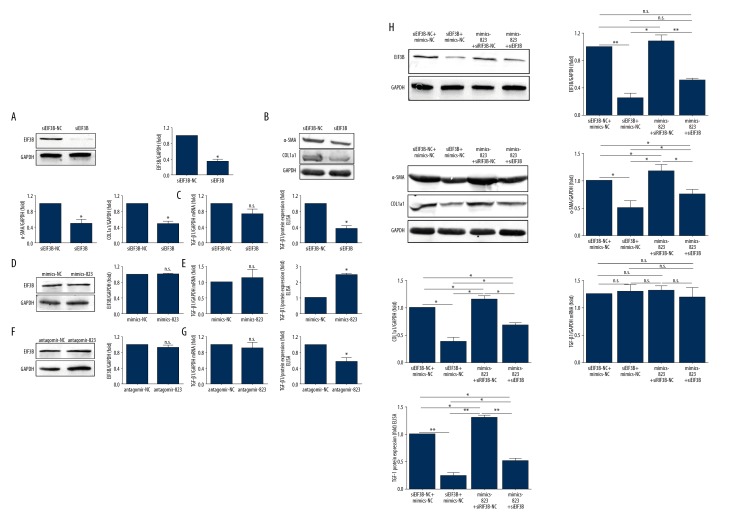
Results from PCR and Western blot illustrated that siEIF3B effectively knocked down the expression of EIF3B, and the expressions of α-SMA and COL1a1 were also decreased (Figure 8A, 8B). The decreased protein expression of EIF3B suppressed the expression of TGF-β1 (Figure 8C). However, the RNA level had no significant change (Figure 8C), which indicates that the reduction of EIF3B only affects TGF-β1 translation, not DNA-RNA transcription. After we transfected piR-823 mimics or piR-823 antagomir into LX-2 cells, we did not find any significant changes in EIF3B expression at protein and RNA levels (Figure 8D, 8F). Upregulation of piR-823 significantly increased the production of TGF-β1 in LX-2 cells (Figure 8E), whereas inhibition of piR-823 significantly decreased the expression of TGF-β1 in LX-2 cells (Figure 8G) compared with the control group. However, the mRNA level of TGF-β1 had no significant change (Figure 8E, 8G).
Figure 8.
The combination of piR-823 and EIF3B induces TGF-β1 protein expression in LX2 cells. (A, B) EIF3B knockdown decreased the expression of α-SMA and COL1a1. (C) EIF3B knockdown did not affect TGF-β1 mRNA expression but significantly decreased TGF-β1 protein expression. (D, E) piR-823 mimics did not affect EIF3B protein and TGF-β1 mRNA expression, but significantly increased TGF-β1 protein expression. (F, G) piR-823 knockdown did not change the EIF3B content and TGF-β1 mRNA expression, but significantly decreased TGF-β1 protein expression. (H) EIF3B knockdown decreased TGF-β1 protein expression and piR-823 mimics increased TGF-β1 protein expression. EIF3B knockdown abolished the effect of piR-823 mimics on TGF-β1, α-SMA, and COL1a1 protein expressions. These manipulations did not affect TGF-β1 mRNA level in LX2 cells. Data were analyzed using unpaired t test. Bars=means ±SEM. * P<0.05, ** P<0.01, and n.s. not significant. EIF3B – eukaryotic initiation factor 3 B; TGF-β1 – transforming growth factor β1.
The transfection of siEIF3B downregulated TGF-β1, α-SMA, and COL1a1. Transfection of piR-823 mimics upregulated TGF-β1, and the transfection of siEIF3B attenuated the promoting effect of piR-823 on TGF-β1, α-SMA, and COL1a1 expression (Figure 8H). However, these manipulations did not affect TGF-β1-mRNA transcription (Figure 8H).
Discussion
Our results are the first to show that upregulation of piR-823 is associated with HSCs activation. The binding of piR-823 to EIF3B upregulated TGF-β1 expression, which subsequently activates HSCs. piR-823 might be a new target for the treatment of hepatic fibrosis.
Liver fibrosis is initiated by the activation of quiescent HSCs. It is well known that activated HSC is the most important cellular player in liver fibrogenesis. There are several pathways to activate HSCs, such as TGFb-SMAD3 pathway, PDGFRβ pathway, and hedgehog (Hh) pathway [19]. However, other pathways might be even more important and need to be explored, and piR-823 is one of them. Our study demonstrates that piR-823 was upregulated in primary HSCs isolated from a liver fibrotic model in mice.
The activated HSCs produce ECM. The imbalance between the secretion and degradation of ECM results in the accumulation of ECM, which eventually progresses to cirrhosis and liver failure and, even worse, HCC [20]. Despite recent progress in understanding liver fibrogenesis, the mechanisms are not yet fully understood. Our lab previously demonstrated that piR-823 promotes cell proliferation and plays an important role in colorectal carcinogenesis [6]. Yan et al. also showed the stimulation effect of piR-823 on proliferation in multiple myeloma [5]. However, there is no study on the role of piR-823 in HSC proliferation. In this study, we first investigated the changes of piR-823 in different phenotypes of HSCs. piR-823 was significantly increased in primary HSCs isolated from fibrotic mice, both in CCL4-treated and BDL mice, compared with control animals. However, piR-823 level was much higher in primary HSCs from CCL4 mice than in BDL mice, which might be caused by CCL4 toxin. More interestingly, CCL4 treatment longitudinally increased piR-823 expression in primary HSCs isolated from CCL4-treated mice; piR-823 reached a peak 4 weeks after CCL4 treatment. This illustrates that piR-823 was increased before liver fibrosis. We also found that piR-823 was increased in culture-activated HSCs; this increase was also longitudinal. These data confirm that activated HSCs produce piR-823. There were 2 aspects to this: one was that the activated HSCs increased the synthesis of piR-823, and the other is that piR-823 activated HSCs. All of these data demonstrate that piR-823 and HSCs formed a vicious cycle in liver fibrogenesis and fibrotic progression. Since this is the first study of piR-823 in liver fibrogenesis, we needed to find out whether the increase of piR-823 is a confounding phenomenon. To clarify this, we did 2 experiments: we infected either piR-823 mimics to quiescent HSCs or piR-823 antagomir to activated HSCs and cell line (LX-2). Interestingly, piR-823 mimics activated quiescent HSCs and the elimination of piR-823 significantly decreased the viability and proliferation in primary HSCs and cell line. We also found that in terms of fibrotic grade, the expressions of COL1a1 and α-SMA are parallel to the piR-823 levels.
Our data clearly demonstrate that piR-823 indeed plays a critical role in HSC activation and piR-823 has a direct effect on the viability and proliferation of HSCs.
What is the mechanism of piR-823 in the activation of HSCs? RNA’s function is associated with protein, and piR-823 is a small RNA which does not code protein. Our RNA pull-down experiment and LC-MS demonstrated that piR-823 combines with a variety of proteins, such as SFPQ, PLOD1, and EIF3B. Among these proteins, EIF3B is the promoter of the translation promoter of TGF-β1 [21], which is a well-recognized factor in the pathogenesis of liver fibrosis. We hypothesized that the combination of piR-823 and EIF3B upregulates the expression of TGF-β1 and activates HSCs. We therefore investigated whether there was a correlation between piR-823 and TGF-β1.
Our study found that TGF-β1 was significantly increased in HSCs infected with piR-823 mimic and decreased in piR-823 antagomir. These experiments indicated that piR-823 directly stimulates HSCs to produce TGF-β1.
The protein translation relies on interaction between protein and protein as well as between protein and RNA in eukaryotes. As a member of the eukaryotic initiation factor (EIF) family, EIF3B plays an important role in protein translation [22]. Yue et al. demonstrated that EIF3B binds p311 protein to trigger p311 to recruit mRNA of TGF-β1, and this complex further produces TGF-β1 [21]. Our RNA pull-down experiment identified that EIF3B was a piR-823-interacting protein. piR-823 mimics significantly increased the TGF-β1 protein expression but knockdown of EIF3B with siEIF3B significantly abolished the effect of piR-823 mimics on TGF-β1. All of these data show that piR-823 cooperates with EIF3B within cytoplasm and this complex further recruits mRNA of TGF-β1 and produces TGF-β1. Since piR-823 did not change TGF-β1 mRNA transcription, the combination of piR-823 and EIF3B affected the mRNA translation. Our results are in agreement with Yue et al., who demonstrated that P311-eIF3b complex binds directly to TGF-β 5′UTRs mRNAs and stimulates TGF-β translation [21].
Conclusions
The increase of piR-823 occurs prior to liver fibrosis. The increased piR-823 combines with EIF3B and this complex further recruits mRNA of TGF-β1 and produces TGF-β1. TGF-β1 activates quiescent HSCs and the activated HSCs further produces piR-823 and α-SMA and collagen, the major components of ECM. The accumulation of ECM is the basis of fibrogenesis. Blockade of piR-823 and HSCs forms a vicious cycle and may be a new strategy to treat liver fibrosis.
Acknowledgements
We appreciate grammatical correction and guidance from Mr Weirong Zhan, Department of Pathology, Royal Melbourne Hospital.
Abbreviations
- ECM
extracellular matrix
- HSCs
hepatic stellate cells
- TGF-β1
transforming growth factor β1
- piRNA
piwi-interacting RNA
- HCC
hepatocellular carcinoma
- BDL
bile duct ligation
- SH
sham surgery
- HE
hematoxylin and eosin
- a-SMA
alpha smooth muscle actin
- COL1a1
alpha-1 type I collagen
- NC
negative control
- ALT
alanine aminotransferase
- AST
aspartate aminotransferase
- TBIL
total bilirubin
- LC-MS
liquid chromatography-mass spectrometry
- EIF3B
eukaryotic initiation factor 3 B
Footnotes
Source of support: This work was supported by grants from the National Natural Science Foundation of China (grant numbers 81700547, 81702324, 81570546, 81770601)
Conflict of interest
None.
References
- 1.Lee YA, Wallace MC, Friedman SL. Pathobiology of liver fibrosis: A translational success story. Gut. 2015;64:830–41. doi: 10.1136/gutjnl-2014-306842. [DOI] [PMC free article] [PubMed] [Google Scholar]
- 2.Aravin AA, Sachidanandam R, Girard A, et al. Developmentally regulated piRNA clusters implicate MILI in transposon control. Science. 2007;316:744–47. doi: 10.1126/science.1142612. [DOI] [PubMed] [Google Scholar]
- 3.Aravin AA, Bourc’his D. Small RNA guides for de novo DNA methylation in mammalian germ cells. Genes Dev. 2008;22:970–75. doi: 10.1101/gad.1669408. [DOI] [PMC free article] [PubMed] [Google Scholar]
- 4.Kuramochi-Miyagawa S, Watanabe T, Gotoh K, et al. DNA methylation of retrotransposon genes is regulated by Piwi family members MILI and MIWI2 in murine fetal testes. Genes Dev. 2008;22:908–17. doi: 10.1101/gad.1640708. [DOI] [PMC free article] [PubMed] [Google Scholar]
- 5.Ozata DM, Gainetdinov I, Zoch A, et al. PIWI-interacting RNAs: small RNAs with big functions. Nat Rev Genet. :2018. doi: 10.1038/s41576-018-0073-3. [Epub ahead of print] [DOI] [PubMed] [Google Scholar]
- 6.Yan H, Wu QL, Sun CY, et al. piRNA-823 contributes to tumorigenesis by regulating de novo DNA methylation and angiogenesis in multiple myeloma. Leukemia. 2015;29:196–206. doi: 10.1038/leu.2014.135. [DOI] [PubMed] [Google Scholar]
- 7.Yin J, Jiang XY, Qi W, et al. piR-823 contributes to colorectal tumorigenesis by enhancing the transcriptional activity of HSF1. Cancer Sci. 2017;108:1746–56. doi: 10.1111/cas.13300. [DOI] [PMC free article] [PubMed] [Google Scholar]
- 8.Rizzo F, Rinaldi A, Marchese G, et al. Specific patterns of PIWI-interacting small noncoding RNA expression in dysplastic liver nodules and hepatocellular carcinoma. Oncotarget. 2016;7:54650–61. doi: 10.18632/oncotarget.10567. [DOI] [PMC free article] [PubMed] [Google Scholar]
- 9.Carloni V, Luong TV, Rombouts K. Hepatic stellate cells and extracellular matrix in hepatocellular carcinoma: More complicated than ever. Liver Int. 2014;34(6):834–43. doi: 10.1111/liv.12465. [DOI] [PubMed] [Google Scholar]
- 10.Mogler C, König C, Wieland M, et al. Hepatic stellate cells limit hepatocellular carcinoma progression through the orphan receptor endosialin. EMBO Mol Med. 2017;9(6):741–49. doi: 10.15252/emmm.201607222. [DOI] [PMC free article] [PubMed] [Google Scholar]
- 11.Tag CG, Sauer-Lehnen S, Weiskirchen S, et al. Bile duct ligation in mice: Induction of inflammatory liver injury and fibrosis by obstructive cholestasis. J Vis Exp. 2015;(96) doi: 10.3791/52438. [DOI] [PMC free article] [PubMed] [Google Scholar]
- 12.Dong W, Lu A, Zhao J, et al. An efficient and simple co-culture method for isolating primary human hepatic cells: Potential application for tumor microenvironment research. Oncol Rep. 2016;36(4):2126–34. doi: 10.3892/or.2016.4979. [DOI] [PubMed] [Google Scholar]
- 13.Orom UA, Lund AH. Isolation of microRNA targets using biotinylated synthetic microRNAs. Methods. 2007;43(2):162–65. doi: 10.1016/j.ymeth.2007.04.007. [DOI] [PubMed] [Google Scholar]
- 14.Awan HM, Shah A, Rashid F, et al. Comparing two approaches of miR-34a target identification, biotinylated-miRNA pulldown vs. miRNA overexpression. RNA Biol. 2018;15(1):55–61. doi: 10.1080/15476286.2017.1391441. [DOI] [PMC free article] [PubMed] [Google Scholar]
- 15.Katayama H, Nagasu T, Oda Y, et al. Improvement of in-gel digestion protocol for peptide mass fingerprinting by matrix-assisted laser desorption/ionization time-of-flight mass spectrometry. Rapid Commun Mass Spectrom. 2001;15:1416–21. doi: 10.1002/rcm.379. [DOI] [PubMed] [Google Scholar]
- 16.Jenkins R, Duggan JX, Aubry AF, et al. Recommendations for validation of LC-MS/MS bioanalytical methods for protein biotherapeutics. AAPS J. 2015;17(1):1–16. doi: 10.1208/s12248-014-9685-5. [DOI] [PMC free article] [PubMed] [Google Scholar]
- 17.Baroni TE, Chittur SV, George AD. Advances in RIP-chip analysis: RNA-binding protein immunoprecipitation-microarray profiling. Methods Mol Biol. 2008;419:93–108. doi: 10.1007/978-1-59745-033-1_6. [DOI] [PubMed] [Google Scholar]
- 18.Keene JD, Komisarow JM, Friedersdorf MB. RIP-Chip: The isolation and identification of mRNAs, microRNAs and protein components of ribonucleoprotein complexes from cell extracts. Nat Protoc. 2006;1(1):302–7. doi: 10.1038/nprot.2006.47. [DOI] [PubMed] [Google Scholar]
- 19.Tsuchida T, Friedman SL. Mechanisms of hepatic stellate cell activation. Nat Rev Gastroenterol Hepatol. 2017;14:397–411. doi: 10.1038/nrgastro.2017.38. [DOI] [PubMed] [Google Scholar]
- 20.Lee YA, Wallace MC, Friedman SL. Pathobiology of liver fibrosis: A translational success story. Gut. 2015;64:830–41. doi: 10.1136/gutjnl-2014-306842. [DOI] [PMC free article] [PubMed] [Google Scholar]
- 21.Yue MM, Lv K, Meredith SC, et al. Novel RNA-binding protein P311 binds eukaryotic translation initiation factor 3 subunit b (eIF3b) to promote translation of transforming growth factor beta1–3 (TGF-beta1–3) J Biol Chem. 2014;289:33971–83. doi: 10.1074/jbc.M114.609495. [DOI] [PMC free article] [PubMed] [Google Scholar]
- 22.Lee AS, Kranzusch PJ, Cate JH. eIF3 targets cell-proliferation messenger RNAs for translational activation or repression. Nature. 2015;522:111–14. doi: 10.1038/nature14267. [DOI] [PMC free article] [PubMed] [Google Scholar]


