

Abstract
Background:
Health insurance can be a very useful strategy to mitigate the disabling effects of catastrophic health expenditure in India.
Objectives:
The aim of the study is to estimate catastrophic health expenditure incurred and the willingness to pay and ability to pay for health insurance among the unsubscribed.
Materials and Methods:
A total of 201 principal earning members of households belonging to the 25–45 years age group were interviewed in a community-based household survey in a conveniently selected ward in Mumbai with the help of a pretested, semi-structured interview schedule.
Results:
The proportion of households with catastrophic health expenditure was 22.4% (total expenditure estimate) and 17.4% (nonfood expenditure estimate). There was a statistically significant association between socioeconomic class and occurrence of catastrophic health expenditure. The average amount the respondents were willing to pay as premium for health insurance per month was ₹272 and the average amount they were able to pay was ₹259.
Conclusion:
Catastrophic health expenditure continues to be a disastrous problem in around 20% of Indian households. Targeted health insurance schemes with different premiums and coverages for different income and employment groups should be considered.
Keywords: Ability-to-pay, catastrophic, health insurance, willingness-to-pay
INTRODUCTION
Catastrophic health-care expenditure (CHE) occurs when out-of-pocket payments for health-care services take up such a large part of the household's total available income that the household may potentially face poverty. It can be defined as either (a) more than 10% of total monthly consumption expenditure or (b) more than 40% of the nonfood consumption expenditure.[1] Berman et al. estimated that more than 70 million Indians are impoverished every year because of medical expenses.[2] The situation analyses – backdrop to the NHP 2017 notes that over 63 million people are faced with poverty every year due to health-care costs alone. The proportion of households facing catastrophic expenses due to health costs has increased from 15% in 2004–2005 to 18% in 2011–2012.[1]
Health insurance is an umbrella term for a wide variety of risk-pooling mechanism ranging from social insurance to community-based insurance to private insurance. It has gained prominence in India as a major mechanism of health-care financing in the last two decades or so. The proportion of the population covered by some form of health insurance cover jumped by four times from 75 million in 2007 (mainly covered under the CGHS and the ESIS) to 302 million in 2010. The Rashtriya Swasthya Bima Yojana and the state-sponsored schemes in erstwhile Andhra Pradesh (Rajiv Aarogyasri which has covered more than 85% of the total population), Karnataka, and Tamil Nadu in a span of 3 years covered 247 million people. Similar schemes were subsequently launched in Maharashtra, Gujarat, Kerala, etc.[3]
The specific objectives of the study were to: (a) estimate the catastrophic health expenditure incurred by the households and (b) assess the willingness to pay (WTP) and ability to pay for health insurance among those who have not subscribed to health insurance. Very few similar studies have been conducted in Mumbai to assess these parameters.[4]
MATERIALS AND METHODS
A community-based, cross-sectional study was conducted in Mumbai over a period of 18 months, from February 2015 to August 2016. The sampling frame comprised all the principal earning adult members of households between the ages of 25 and 45 years in the F-South Ward of Mumbai. This age group was chosen because by the age of 25 years, people usually start earning and begin their families and they become conscious that people are financially dependent on them.
The sample size was calculated to be 201, using the formula N = 4PQ/d2 and assuming the awareness about health insurance to be 56% (based on the IRDA 2011 survey)[5] and a relative precision of 12.5%. Awareness about health insurance was considered for sample size calculation because the present study was part of a larger study whose primary objective was the assessment of awareness about health insurance. This sample size was distributed among different income strata using data from the World Bank Policy Research Working Paper 3693, September 2005 titled “Urban Poverty and Transport: The Case of Mumbai.”[6] This study defined population of Mumbai into monthly household income ranges. These ranges were used to stratify the required sample size into different groups. The income groups were adjusted for inflation and the estimated income levels for the groups for the year 2013–2014 were estimated. It was finally estimated that 26.5% of the participants may have income <₹9338; 27.7% between ₹9338 and 14,000; 21.9% between ₹14,000 and 18,677; 17.8% between 18,677 and 37,353; and 6.2% more than ₹37,353. For each stratum, purposive sampling was done, assuming that people from specific occupational groups usually have specific ranges of income and stay in specific types of settlements (such as chawls, government quarters, and co-operative housing societies). Details about the distribution of types of settlements were obtained from the medical officers of the health posts.
The setting of the interview was either the workplace or the house of the participant, during evenings, depending on the point of contact and the convenience of the participant. In the event of the nonavailability of the principal earning members, the investigator moved onto the next household. The socioeconomic class was determined using the Modified Kuppuswamy Socioeconomic Scale.
A pretested semi-structured interview schedule was used after obtaining informed consent. It was composed of three major sections – (a) general socioeconomic data, (b) history of illnesses and its financial impact on the household, and (c) information on the attitude toward and utilization of health insurance. Ethical clearance was obtained from the Institutional Ethics Committee of KEM Hospital, Mumbai.
Data were entered in Microsoft Excel 2013 and statistical analysis was done in (IBM Corp. Released 2013. IBM SPSS Statistics for Windows, Version 22.0. Armonk, NY: IBM Corp.). Chi-square test was used to measure association between socioeconomic status and catastrophic health expenditure. The Mood's median test was used to measure association between socioeconomic characteristics of the study participants and the median amount the households were willing to pay as a premium for health insurance per month.
RESULTS
A total of 201 households were interviewed. The study sample was composed of 177 males (88%) and 24 females (12%). Most of the participants were in the 35–45 years age group (71.1%) while the remaining were between 25 and 35 years of age. The sample was mostly composed of Hindus (53.2%) and Buddhists (42.8%) with the remaining being Christians. This was an unique feature of the study population, with a relatively large proportion of Buddhists and very small proportion of Muslims. Most were married (74.6%) while 14.4% were unmarried and 11% were widowed. Although the study participants were the principal earning members in their respective households, only 178 (88.6%) were the heads of their households. With respect to the education of the head of the household, 13.4% were illiterate or primary school-educated, 26.9% had attended middle school, 20.9% had studied up to high school, and 24.4% had finished intermediate/posthigh school diploma. Only 14.4% were graduates or postgraduates. Among the heads of the households, 30 (14.9%) were unemployed, 34 (16.9%) were engaged in unskilled work, 34 (16.9%) were semi-skilled workers, 55 (27.4%) were skilled workers, 40 (19.9%) were clerks or shop owners, and 8 (4%) were engaged in semi-professional work. The majority of the households (79.6%) were earning between ₹6177 and ₹20,589. Only 13 households (6.5%) were earning more than ₹41,179 and 5 (2.5%) were earning between ₹20,590 and ₹41,178. 23 households (11.4%) were earning between ₹2080 and ₹6176. Based on the above data, it was found that 80 households (39.8%) belonged to upper lower socioeconomic class, 89 (44.3%) belonged to the lower middle class and 32 (15.9%) belonged to the upper middle class.
When asked whether they would be able to raise ₹500,000 at short notice for health care, 74% of the households replied that they would not at all be able to, 24.5% replied with great difficulty, and 1.5% would be able to with some financial assistance. None of the households would be able to do so easily and instantly. This was in keeping with reports that 99% of the working population in India do not have instant cash and would face severe financial crunch during critical illnesses.[7]
Based on the two definitions of catastrophic health expenditure, 22.4% had spent >10% of total expenditure on health and 17.4% of the study participants had spent >40% of nonfood expenses on health and thus incurred catastrophic expenditure.
Chi-square test was performed to measure the association between socioeconomic class and catastrophic expenditure. There was a significant association in the proportion of people who had incurred catastrophic expenditure with lower socioeconomic strata.
About 71.4% of upper lower class had catastrophic expenditure compared to 37.8% in lower-middle class and 1% in upper-middle class. The Chi-square statistic was 11.73 and the difference in proportions was statistically significant.
Participants were willing to pay premiums ranging from 100 to 1000 Rupees per month for health insurance as per Figure 1, the average amount being ₹272 with standard deviation (SD) of 161.0366. The average amount able to pay was ₹259 with SD of 161.4358. The median amount was ₹250 in both instances.
Figure 1.
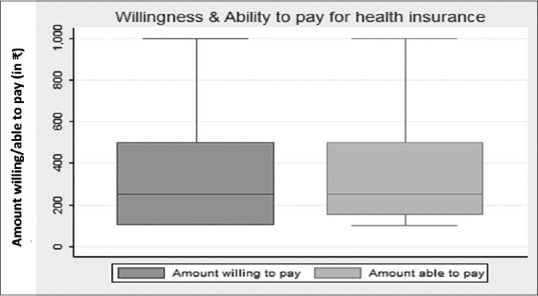
Box plot showing the amount that the respondents were willing and able to pay
Figure 2 shows the distribution of median amounts the participants were willing to pay as health insurance premium and the proportion of these median amounts in the monthly income, over the income ranges used for sampling. It is seen that the median WTP amounts is maximum in the income ranges of >₹37,573 (₹350) and ₹9338–₹14,000 (₹300). It is much less in the lowest income group at ₹150. It is ₹175 in the ₹18,679–₹37,573 group and ₹250 in the ₹14,000–₹18,677 group.
Figure 2.
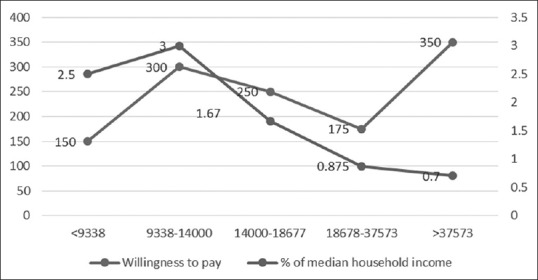
Dual axes line diagram showing median willingness to pay amount and proportion of median willingness to pay to household income according to income bands
The proportion of median WTP amounts to total monthly income decreases steadily as income increases after an initial increase in the income range between ₹9338 and ₹14,000 (at 3%). In the lowest group, the proportion is 2.5%. This, after a minor rise, then declines consistently to 0.7% in the highest income group [Tables 1 and 2].
Table 1.
Association of median willingness to pay amount with sociodemographic variables (age, gender, religion, and education)
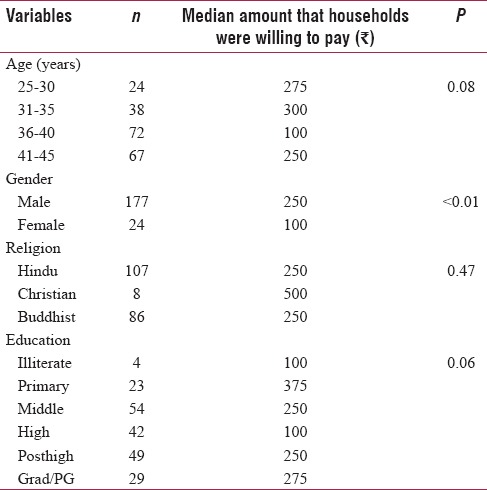
Table 2.
Association of median willingness to pay amount with sociodemographic variables (occupation, socioeconomic status, ration card, income category, and marital status)
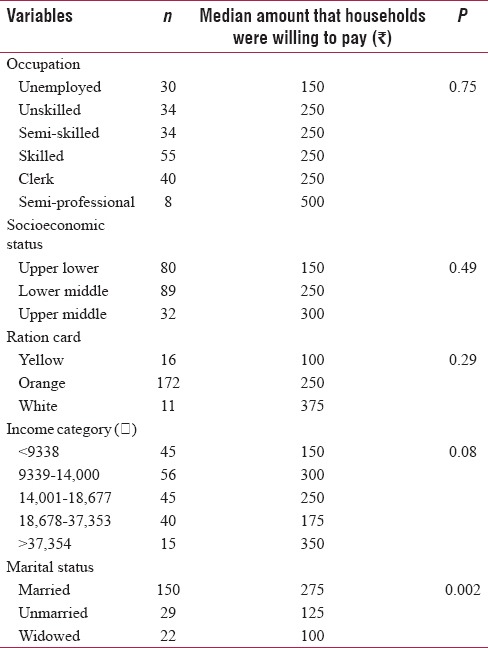
As the sample is heterogeneous and not representative, the presence of a statistical significance may not necessarily mean that a real-life significance exists. Only male gender and married status are found to have a statistically significant association with higher WTP amounts.
DISCUSSION
In the present study, the catastrophic health expenditure calculated as more than 10% of total expenses was 22.4% of the households. This was greater than the estimate calculated as more than 40% of nonfood expenses which was 17.4%. This finding was consistent with previous studies like Raban et al.[8] The percentage of households incurring CHE was higher among the upper-lower socioeconomic group (71.4%). This decreased to 37.8% among the lower middle and 12.5% among the upper middle socioeconomic groups. This difference between proportions was found to be statistically significant. Such a difference between proportions was in keeping with findings in the previous studies. Similar findings of inverse relationship between income and CHE were found by Bonu et al.,[9] Patil et al.,[10] and Li et al.[11]
In the present study, the mean amount the households were willing to pay was ₹272 monthly which works out to ₹3264 annually. The range was from ₹100 to ₹1000 per month and median was ₹250. This is significantly higher than previous studies like Dror[12] and Madhukumar et al.[13] This might be explained by the fact that the present study population had a mean income of ₹17,203 compared to most families having a monthly income of ₹4000–₹6000 in the study population of Madhukumar et al.[13] Dror[12] was conducted nearly 10 years ago and found a median household annual income of ₹41,400. Furthermore, the present study was conducted in a metropolitan setting in contrast to rural setting of Madhukumar et al.[13]
It is also seen [Figure 1] that the amount willing to pay (mean of ₹272 and median of ₹250) and the amount able to pay (mean of ₹259 and median of ₹250) were nearly the same, with few outliers. This suggests that there is a strong correlation between ability and willingness, which bodes well for financial health of households. The median WTP amounts is maximum in the income ranges of >₹37,573 and ₹9338–₹14,000. It can be seen that the lower income groups (<₹9338–₹14,000) are willing to spend 2.5%–3% of their income as health insurance premium. This proportion declines in the ₹14,000–₹18,677, ₹18,678–₹37,573, and >₹37,573 income groups to 1.67%, 0.875%, and 0.7%, respectively. This suggests that different income groups have different perceptions and understanding of the risks posed by health-care costs on their overall finances. Tailored plans for separate income groups may be useful. While community-based health insurance schemes can be useful for the income group between ₹9338 and ₹14,000, the group with income more than ₹37,573 may find strategically-priced commercial health insurance attractive. In contrast, Dror[12] found that the median WTP amounts increased consistently as the total monthly income increases. Dror[12] also found that the proportions decrease steadily with an increase in monthly income. These discrepancies between the two studies may be because the income group ₹9338–₹14,000 may be anxious to plan ahead financially, considering the relative low income and the propensity to ill health.
The present study found that male gender and married status have a statistically significant association with the amounts the respondents were willing to pay as premium for health insurance. Age, religion, occupation, education, income category, color of ration card, and socioeconomic status were found not to have an association. Bawa and Ruchita[14] found that occupation was strongly associated with WTP. Onwujekwe et al.[15] found that the amount the respondents were willing to pay was directly proportional to socioeconomic status, male sex, and education. The association of male gender and marriage with amounts willing to pay may be due to the idea of marriage in the Indian context, which causes the married male to shoulder more financial responsibility for himself and his family. So insurance policies can be specifically addressed toward the occasion of marriage. This finding also reflects clearly that gender roles are demarcated in the Indian society, and they become obvious when taking financial decisions.
One of the limitations of the study is the generalizability of the findings to a larger population.
CONCLUSION
Catastrophic health expenditure continues to affect around one-fifth of households, potentially setting them on the path toward impoverishment. The need for some alternative health-care financing, preferably involving risk-pooling, is manifest. The market for health insurance in India is heterogeneous and dynamic, with different income and social groups having different expectations and aspirations regarding health insurance. A basket of choices should ideally be available to the potential well-informed subscribers. The insurance market is growing at a steady Compound Annual Growth Rate of around 15% in India. The time is ripe for the Health Insurance Industry and the Government to institute active measures to increase penetration and density of health insurance.
Financial support and sponsorship
Nil.
Conflicts of interest
There are no conflicts of interest.
REFERENCES
- 1.Situation Analyses: Backdrop to the National Health Policy- 2017. New Delhi, India: 2017. [Last accessed on 2018 Mar 15]. Ministry of Health and Family Welfare, Government of India. Available from: https://mohfw.gov.in/sites/default/ files/71275472221489753307.pdf . [Google Scholar]
- 2.Berman P. Health care expenditure in India. In: Das Gupta M, Chen LC, Krishnan TN, editors. Health, Poverty and Development in India. Delhi: Oxford University Press; 1996. pp. 331–58. [Google Scholar]
- 3.Reddy KS, Selvaraj S, Rao KD, Chokshi M, Kumar P, Arora V, et al. A Critical Assessment of the Existing Health Insurance Models in India. New Delhi, India: Public Health Foundation of India; 31 January, 2011; [Last accessed on 2018 Mar 15]. p. 115. Available from: http://www.planningcommission.nic.in/reports/ sereport/ser/ser_heal1305.pdf . [Google Scholar]
- 4.Skordis-Worrall J, Pace N, Bapat U, Das S, More NS, Joshi W, et al. Maternal and neonatal health expenditure in Mumbai slums (India): A cross sectional study. BMC Public Health. 2011;11:150. doi: 10.1186/1471-2458-11-150. [DOI] [PMC free article] [PubMed] [Google Scholar]
- 5.Insurance Regulatory and Development Authority of India. Pre-Launch Survey Report of Insurance Awareness Campaign. New Delhi, India: IRDAI and National Council of Applied Economic Research; 2011. [Last accessed on 2018 Mar 15]. p. 148. Available from: https://www.irda.gov.in/ADMINCMS/cms/ Uploadedfiles/INSURANCE_AWARENESS_insdie_report_final_for_mail.pdf . [Google Scholar]
- 6.Baker J, Basu R, Cropper M, Lall S, Takeuchi A. Urban Poverty and Transport: The Case of Mumbai; World Bank Policy Research Working Paper 3693. The World Bank; September, 2005. [Last accessed on 2017 Jan 03]. Available from: https://www.openknowledge.worldbank.org/handle/10986/8602 .
- 7.World Health Organisation. The World Health Report – Health Systems Financing: The Path to Universal Coverage. Geneva: World Health Organisation; 2010. [Last accessed on 2018 Mar 15]. 128 pp. Available from: http://www.apps.who.int/ iris/bitstream/10665/44371/1/9789241564021_eng.pdf . [DOI] [PMC free article] [PubMed] [Google Scholar]
- 8.Raban MZ, Dandona R, Dandona L. Variations in catastrophic health expenditure estimates from household surveys in India. Bull World Health Organ. 2013;91:726–35. doi: 10.2471/BLT.12.113100. [DOI] [PMC free article] [PubMed] [Google Scholar]
- 9.Bonu S, Bhushan I, Rani M, Anderson I. Incidence and correlates of ‘catastrophic’ maternal health care expenditure in India. Health Policy Plan. 2009;24:445–56. doi: 10.1093/heapol/czp032. [DOI] [PubMed] [Google Scholar]
- 10.Patil SS, Berad AS, Angadi MM. A study to assess catastrophic household expenditure on childhood illness in an urban slum in Bijapur. Indian J Community Med. 2009;34:335–7. doi: 10.4103/0970-0218.58394. [DOI] [PMC free article] [PubMed] [Google Scholar]
- 11.Li Y, Wu Q, Xu L, Legge D, Hao Y, Gao L, et al. Factors affecting catastrophic health expenditure and impoverishment from medical expenses in China: Policy implications of universal health insurance. Bull World Health Organ. 2012;90:664–71. doi: 10.2471/BLT.12.102178. [DOI] [PMC free article] [PubMed] [Google Scholar]
- 12.Dror MD. Health insurance for the poor: Myths and realities. [Last accessed on 2018 Mar 15];Econ Polit Wkly. 2006 41:4541–4. Available from: http://www.epw.in/journal/2006/43-44/ commentary/health-insurance-poor-myths-and-realities.html . [Google Scholar]
- 13.Madhukumar S, Sudeepa D, Galkwad V. Awareness and perception regarding health insurance in Bangalore rural population. [Last accessed on 2018 Mar 15];Int J Med Public Health. 2012 2(2):18–22. Available from: http://www.ijmedph.org/ sites/default/files/IntJMedPublicHealth_2012_2_2_18_108390. pdf . [Google Scholar]
- 14.Bawa SK, Ruchita M. Awareness and Willingess to pay for health insurance: An empirical study with reference to Punjab India. [Last accessed on 2018 Mar 15];Int J Humanit Soc Sci. 2011 1:100–8. Available from: http://www.ijhssnet. com/journals/Vol._1_No._7_[Special_Issue_June_2011]/14.pdf . [Google Scholar]
- 15.Onwujekwe O, Okereke E, Onoka C, Uzochukwu B, Kirigia J, Petu A, et al. Willingness to pay for community-based health insurance in Nigeria: Do economic status and place of residence matter? Health Policy Plan. 2010;25:155–61. doi: 10.1093/heapol/czp046. [DOI] [PubMed] [Google Scholar]