

Summary
Single-cell analysis is a rapidly evolving to characterize molecular information at the individual cell level. Here, we present a new approach with the potential to overcome several key challenges facing the currently available techniques. The approach is based on the identification of volatile organic compounds (VOCs), viz. organic compounds having relatively high vapor pressure, emitted to the cell's headspace. This concept is demonstrated using lung cancer cells with various p53 genetic status and normal lung cells. The VOCs were analyzed by gas chromatography combined with mass spectrometry. Among hundreds of detected compounds, 18 VOCs showed significant changes in their concentration levels in tumor cells versus control. The composition of these VOCs was found to depend, also, on the sub-molecular structure of the p53 genetic status. Analyzing the VOCs offers a complementary way of querying the molecular mechanisms of cancer as well as of developing new generation(s) of biomedical approaches for personalized screening and diagnosis.
Subject Areas: Analytical Chemistry, Sensor, Biological Sciences, Cancer Systems Biology
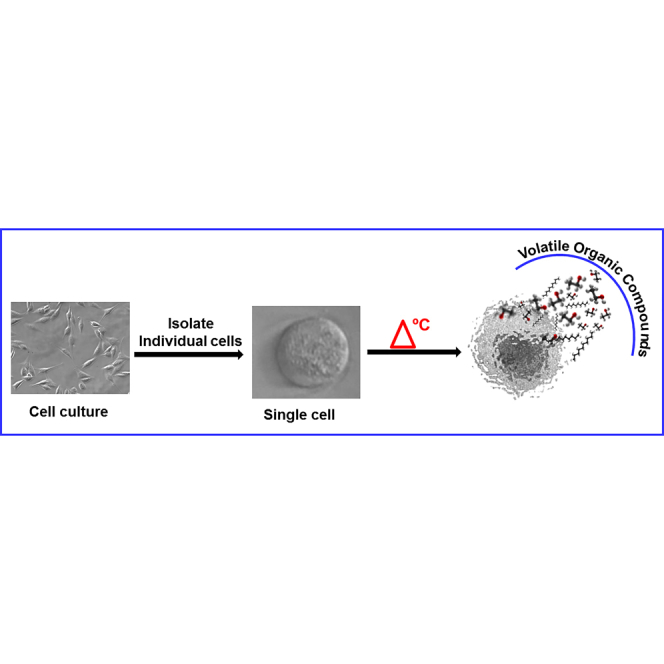
Graphical Abstract
Highlights
-
•
Measurement of VOCs was achieved at the single-cell level
-
•
Genetic changes influence the emitted volatiles of single and bulk cancer cells
-
•
Single-cell VOC analysis measures population heterogeneity in initial stage of tumors
-
•
Volatolomics research can promote non-invasive, simple, and cost-effective diagnostics
Analytical Chemistry; Sensor; Biological Sciences; Cancer Systems Biology
Introduction
A vital challenge of biology is to understand how individual cells process information and response to perturbations. Cells may appear morphologically identical but are heterogeneous and made up of individual cells that can differ significantly (Hou et al., 2016, Templer and Ces, 2008). These differences can have important consequences for the health and function of the entire population. Therefore, single-cell analysis that allows the definition of the cell (bio)chemical profile is of critical importance for in-depth study of diseases and drug development (Schmidt and Efferth, 2016; Heath et al., 2016, Broza et al., 2015).
Currently, there are several “omics” approaches employing single-cell analysis: genomics, proteomics, and transcriptomics (Wang and Bodovitz, 2010, Zenobi, 2013). For example, tumors' heterogeneous nature is well established and is of great importance due to the option of deducing disease development data from genomic heterogeneity and revealing original insights about the impact and function of cancer stem cells (Di Carlo et al., 2012). Another example, single-cell resolution techniques has been used to track population subgroups for identifying the therapeutic potential of various drugs (Di Carlo et al., 2012). Although significant advances have been achieved with these approaches, several limitations restrict the fulfillment of the diagnostic and therapeutic applications. These limitations include, but are not confined to (Zenobi, 2013, Amantonico et al., 2010), the following: (1) proteomics and genomics require prior and accurate knowledge of specific genes or proteins and are exclusive to in vitro and in vivo trials, something that does not necessarily reflect real-life situations and (2) genomics and proteomics still suffer from high cost, low specificity, and complex analysis algorithms, which result in prolonged and cumbersome analysis (Rockwell, 1980, Wilkins et al., 1996, Chung et al., 2007, Khoo et al., 2016). Besides these limitations, there is also a need for a biomarker that provides systematic knowledge of the disease without the need to isolate and explore specific genes or proteins.
In this article, we present a new frontier for single-cell analysis. The approach is based on the isolation of individual cells by serial dilution approach and the analysis of their volatolomics profile, viz., the volatile organic compound (VOC) profiles emitted into their headspace (i.e., the gas environment trapped closely above the cell). VOCs are chemical compounds that have a low molecular weight and relatively high vapor pressure under room temperature conditions (Broza and Haick, 2013, Hakim et al., 2012, Nakhleh et al., 2017, Broza et al., 2018). An intriguing feature of the VOCs is their widespread partition coefficient in fat and air or blood (i.e., a coefficient designed to estimate the equilibrium concentration of VOCs in fat tissue and [lipophilic] cell membranes with respect to fat/blood), indicating their (hypothetical) participation in the signaling pathways of the cell (Barash et al., 2009, Haick et al., 2014).
Several studies have been conducted to investigate the VOCs emitted from bulk (in vitro) cancer cells, which include millions of cells (Filipiak et al., 2008, Sponring et al., 2009, Amal et al., 2012, Chen et al., 2007, Davies et al., 2014, Peled et al., 2013). Nevertheless, bulk-based approaches may not provide insight into whether differences in VOC expression between samples (Jia et al., 2018, Silva et al., 2017) are driven by changes in cellular composition, changes in the underlying phenotype, or changes in the signaling pathways (Sellick et al., 2011, Yamamura et al., 2005). One of the issues in the field is the fact that tumors (or bulk analysis) are heterogenic and thus could result in VOC profiles that present wider variations. Yet, each tumor starts with just one cell, and this is exactly the rational of examining just a few cells. One main reason for studying at the single-cell level is that it allows us to avoid population heterogeneity in late stages and precisely measure early initiation of tumors as well as the potential reasons, signal promoting tumorigenesis and even heterogeneity. In addition, ensemble measures do not provide insights into the stochastic nature of the VOC expression. Indeed, VOC single-cell analysis can provide solution in some parts compared with other single-cell methods (as described above), yet it also necessitates cell harvesting and analysis in a controlled in vitro setting and would benefit from future technological solutions to ease analysis. Intrigued by these challenges, we report on a VOC-based approach for single-cell analysis that has the potential to overcome several key challenges that face the currently available techniques in this field. This concept is demonstrated by lung cancer cells with various p53 genetic statuses that were isolated from A459: p53W; H1299: p53-; and H1975: P53M cell lines. Normal lung cells (BEAS-2B: p53W) that were isolated manually are used as a reference. Knowing a VOC profile at the single-cell level can also be useful in developing novel cancer diagnostic approaches. As the VOC profile reflects various events in the cells, the information contained in the cellular VOC profile may be useful for identifying the heterogeneity in cell population. It is also believed that volatile profiles deliver a more immediate and dynamic picture of the functionality of a cell. Hence, knowing VOC profile at the single-cell level can be very useful for developing novel cancer diagnostic approaches and can offer more understanding on the VOCs' behavior (concentrations) linked with cancer states.
Results and Discussion
VOCs from Single Cells Measured by GC-MS
In this study, we have identified VOC profiles from single cells that were isolated from lung cancer cell lines. As a reference, we have identified the single cancer cell profiles with normal lung cells (BEAS-2B) at the single-cell level. To examine the influence of the molecular profile of (isolated) single cell on the VOCs' profile, we have compared between lung cancer cells that express different p53 statuses (A549, H1299, and H1975). As the (bio)chemical behavior of the cells change with time, we have also examined the VOCs' profile at different time points: T0, T24, and T48 hr. With regard to the time course, the single cell may or may not survive for long time; hence it is important to check cell viability at T24 and T48 hr, at which times cells were stained with trypan blue for 1 min and washed with PBS. Cell viability was checked by microscopy, and all cell lines had a viability of >95% (Figure 1).
Figure 1.

Trypan Blue Staining
Microscopic images of BEAS-2B, A549, H1299, and H1975 cells. The cells were stained with trypan blue dye to examine cell viability after T0-, T24-, and T48-hr incubation. All single cells adhered to the glass vial bottom (×10 magnified). Scale bar, 50 μm.
The volatile profile of each cell line was determined by gas chromatography-mass spectroscopy connected with the ITEX device (ITEX-GC-MS; see Transparent Methods section for more details). The ITEX is a fully automated sample preparation technique that facilitates an autonomous desorption step. It has several advantages over other methods (e.g., Solid Phase Micro Extraction) for VOC detection, such as, a needle resistant to mechanical damage, protection of the extraction phase, long lifetime of the extraction phase, thermal desorption process independent of the GC injector temperature profile, reduced susceptibility to contamination, and reusability. The procedure of ITEX sampling evaluated for GC-MS analysis is presented in Figure 2. The VOCs arising from single cells were studied using ITEX-GC-MS at times, T0, T24, and T48 hr. Normal lung cells and cell-free media were used as intra-experimental controls. By using the NIST14 mass spectral library, a total of 250 VOCs were identified in all samples with a library matching >90%. After deducting the VOCs found in the background samples, 36–42 different VOCs in each sample remained (Figures S1A–S1D and S2). Here we used glass vials for the main cell culture step as they present very limited release of volatile chemicals (plastic flasks release plasticizers that give extra peaks) that might interfere with analysis (Koyuturk et al., 2007, Zimmermann et al., 2007). It has to be noted that the length of the incubation time and supplementation of cell culture medium have an effect on the composition of the VOCs in the samples (Bajtarevic et al., 2009, Doran et al., 2017).
Figure 2.

Scheme of the Proposed Methodology
Figure shows the volatolomic work flow used in this study. Both normal and cancer cells are grown isolated followed by volatile extraction and analysis using ITEX-GC-MS system (PAL RTC autosampler). Step 1: sample conditioning through heating and stirring (20 min, 80°c); Step 2: adsorption of the analytes by dynamic extraction; Step 3: desorption from the heated trap; Step 4, conditioning of ITEX device; SMM: single-magnet mixer.
VOC Profile Varies Temporally among Genetically Different Cells
We noticed only 18 VOCs that were statistically correlated with the different cell lines showing for each of them specific each pattern was time-dependent (Figure 3). The detected compounds belong to classes of alkanes, aldehydes, ketones, alcohols, hydrocarbons, and phenols derivatives (Table 1). From Figure 3, VOC 15 and VOC 17 were identified only in the H1975 cell line (p53-mutant) in all time points; VOC 11 was found in A549 (p53-wild) and H1299 cells (p53-null) at T0, T24, and T48 hr. These VOCs were unique for the examination of each cell line. VOCs 1, 2, 4, 5, 6–10, 12, 14, 16, and 17 were found to be common in both lung cancer and normal cells, but significantly differed in the levels of peak area (p < 0.01).
Figure 3.

Heatmap of the VOC
VOCs detected in ITEX-GC-MS of lung normal and cancer cell lines. Color coding shows the AUC of each compound measured in the sample normalized with STD AUC calculated in all samples. (Note: VOC1: butanal-3-methyl-; VOC2: butanal-2-methyl-; VOC3: nonanal; VOC4: benzaldehyde; VOC5: 1-hexanol-2-ethyl-; VOC6: benzophenone; VOC7: acetophenone; VOC8: dodecane; VOC9: 2-4-dimethyl-1-heptene; VOC10: tetradecane; VOC11: hexadecane; VOC12: pentadecane; VOC13: undecane-3,8-dimethyl-; VOC14: nonane-5-methyl-5-propyl-; VOC15: heptane-2,2,4,6,6-pentamethyl-; VOC16: dodecane-4,6-dimethyl-; VOC17: heptane-4-methyl-; VOC18: 2,4-di-tetra-butylphenol).
Table 1.
Identification of VOCs from Investigated Human Lung Normal and Cancer Cell Lines by ITEX-GC-MS at Single-Cell Level
| Chemical Group | Compound | CAS No. | m/z | Mean Retention Time ±0.01 (min) |
Coding |
|---|---|---|---|---|---|
| Aldehydes | Butanal-3-methyl- | 590-86-3 | 44 | 7.95 | VOC1 |
| Butanal-2-methyl- | 96-17-3 | 57.1 | 8.31 | VOC2 | |
| Nonanal | 124-19-6 | 57 | 19.29 | VOC3 | |
| Benzaldehyde | 100-52-7 | 105 | 17.59 | VOC4 | |
| Alcohols | 1-Hexanol, 2-ethyl | 104-76-7 | 57.1 | 18.35 | VOC5 |
| Ketones | Benzophenone | 119-61-9 | 105 | 23.95 | VOC6 |
| Acetophenone | 98-86-2 | 105 | 19.02 | VOC7 | |
| Hydrocarbons (straight chain) | Dodecane | 112-40-3 | 57.1 | 20.32 | VOC8 |
| 2,4-Dimethyl-1-heptane | 19549-87-2 | 70 | 15.36 | VOC9 | |
| Tetradecane | 629-59-4 | 57.1 | 22.17 | VOC10 | |
| Hexadecane | 544-76-3 | 57.1 | 23.45 | VOC11 | |
| Pentadecane | 629-62-9 | 71.1 | 20.76 | VOC12 | |
| Hydrocarbons (branched chain) | Undecane-3,8-dimethyl- | 17301-30-3 | 71.1 | 21.2 | VOC13 |
| Nonane-5-methyl-5-propyl- | 17312-75-3 | 71.1 | 19.11 | VOC14 | |
| Heptane-2,2,4,6,6-pentamethyl- | 13475-82-6 | 57.1 | 17.9 | VOC15 | |
| Dodecane-4,6-dimethyl- | 61141-72-8 | 71.1 | 21 | VOC16 | |
| Heptane-4-methyl- | 589-53-7 | 43 | 13.62 | VOC17 | |
| Phenols | 2,4-Di-tert-butylphenol | 96-76-4 | 191 | 23 | VOC18 |
Comparative analysis between the different cell lines with control medium at different incubation times used MassHunter qualitative software. The concentration of the 18 VOCs was determined using a standard curve that was prepared with analysis by GC-MS. Standard curves were induced using the peak area. Calibration measurements were used to determine the limit of detection (LOD) under experimental conditions of our instrument and average concentration levels of 15 VOCs; the remaining VOCs could not be acquired (undecane-3,8-dimethyl-; nonane-5-methyl-5-propyl-; heptane-2,2,4,6,6-pentamethyl-). Figure 4 and Table S1 summarize the average concentration levels as well as the calculated LOD of 15 VOCs in parts per billion units. Significant changes were detected from all compounds after incubation times of T24 and T48 hr, but no significant changes were observed at T0 hr (Table S2). The standard curve of each VOC indicated good linearity in the range 1–150 ppb (R2 = 0.98–0.99). The concentration of each VOC was then calculated using the respective standard curves (Table S1). In some cases, lower parts per thousand levels were calculated by extrapolating beyond the LOD. The range of concentrations found here fit previous bulk studies reporting on concentrations from a few parts per billion to thousands of parts per billion (Peled et al., 2013, Filipiak et al., 2008, Filipiak et al., 2010, Sponring et al., 2009).
Figure 4.

Concentration Levels of VOCs Detected in Lung Normal and Cancer Cell Lines
Color coding shows the parts per billion levels of each compound concentration calculated in all samples. (Ash color indicates no compound). (Note: VOC1: butanal-3-methyl-; VOC2: butanal-2-methyl-; VOC3: nonanal; VOC4: benzaldehyde; VOC5: 1-hexanol-2-ethyl-; VOC6: benzophenone; VOC7: acetophenone; VOC8: dodecane; VOC9: 2-4-dimethyl-1-heptene-; VOC10: tetradecane; VOC11: hexadecane; VOC12: pentadecane; VOC16: dodecane-4,6-dimethyl-; VOC17: heptane-4-methyl-; VOC18: 2,4-di-tetra-butylphenol).
At T0 hr of the incubation period, there were no significant differences between control media and cell lines. At T24 hr of incubation, there was a difference in the abundance of 14 VOCs in the A549 cells compared with the control media. Of the 14 VOCs, 10 compounds were significantly decreased (butanal-3-methyl-, butanal-2-methyl-, benzaldehyde, benzophenone, dodecane, tetradecane, pentadecane, nonane-5-methyl-5-propyl-, dodecane-4,6-dimethyl-, 2,4-di-tetra-butylphenol) and four VOCs (acetophenone, 1-hexanol-2-ethyl-, 2,4-dimethyl-1-heptene, and hexadecane) were marginally increased. At T48 hr of incubation, the concentrations of the above-mentioned 10 VOCs were strongly decreased in A549 compared with the medium control. On the other hand, the four compounds that moderately increased at T24-hr incubation increased significantly further at T48-hr incubation (p < 0.01; Table S3).
In the H1299 cell line, 16 VOCs were detected, although at T0 hr there were no significant changes. At T24 hr, a significant change was recognized in their concentration compared with control media. Nine of the VOCs (butanal-3-methyl-, butanal-2-methyl-, benzaldehyde, dodecane, 2,4-dimethyl-1-heptene, tetradecane, pentadecane, nonane-5-methyl-5-propyl-, dodecane-4,6-dimethyl-) were significantly decreased. Five VOCs (nonanal, 1-hexanol-2-ethyl-, hexadecane, undecane-3,8-dimethyl-, 2,4-di-tetra-butylphenol) were slightly increased. At T48 hr, the concentrations of the nine VOCs had strongly decreased (to near 0) and those of the 5 VOCs were significantly increased (p<0.01) compared with the control medium (Table S4).
In H1975 cells, 14 VOCs were identified. At T0 hr, no significant changes in VOC levels were found in comparison with normal cells and the control media. At T24 hr, six VOCs (butanal-3-methyl-, butanal-2-methyl-, benzaldehyde, benzophenone, acetophenone, 2,4-di-tetra-butylphenol) had significantly decreased. Eight VOCs (dodecane, 2,4-dimethyl-1-heptene, tetradecane, pentadecane, nonane-5-methyl-5-propyl-, heptane-2,2,4,6,6-pentamethyl-, dodecane-4,6-dimethyl-, heptane-4-methyl-) had become significantly increased. At T48 hr, the six VOCs had decreased markedly and the eight VOCs had significantly increased compared with the medium (p < 0.0001) (Table S5).
In normal lung cells, 13 VOCs were recognized, and at T0 hr no significant changes in them were found compared with the medium. At T24 hr, 13 VOCs had significant differences in their concentrations compared with the medium. Eleven VOCs (butanal-3-methyl-, butanal-2-methyl-, benzaldehyde, benzophenone, acetophenone, dodecane, tetradecane, pentadecane, nonane-5-methyl-5-propyl-, dodecane-4,6-dimethyl-, 2,4-di-tetra-butylphenol) were significantly decreased, and two VOCs (1-hexanol-2-ethyl-, 2,4-dimethyl-1-heptene) were significantly increased (p<0.01). At T48 hr, the concentrations of 11 VOCs had decreased radically and those of two VOCs had greatly increased compared with the medium (Table S6).
Butanal-3-methyl-, benzaldehyde, and butanal-2-methyl- were lower in cancerous and normal cell lines at T24 and T48 hr (Figures 5A–5C), which is consistent (in the increasing and decreasing) with previous studies with HepG2 cells (liver carcinoma cells) showing uptake of the aldehydes in cell cultures (Mochalski et al., 2013, Feinberg et al., 2017). Numerous reports have described lower concentrations of butanal-3-methyl- and butanal-2-methyl- compared with the medium and were thought to be consumed by cancer cells (Filipiak et al., 2008, Mochalski et al., 2013). Among other explanations, butanal-3-methyl- concentration decrease in cells could be due to impairment of oxidative phosphorylation in cancer cells or an increase in ALDH activity (ALDH1A1 and ALDH3A1) in lung cancer cells (Patel et al., 2008).
Figure 5.

Comparison of VOCs in the Headspace of Culture Medium from Lung Cancer Cell Lines Compared with Normal Cell Line after 0-, 24-, and 48-hr Incubation
Average normalized area (n = 7) with SD. (A) Butanal-3-methyl-; (B) benzaldehyde; (C) butanal-2-methyl-; (D) benzophenone; (E) acetophenone; (F) 2,4-dimethyl-1-heptene; (G) hexadecane; (H) pentadecane; (I) nonanal; (J) undecane-3,8-dimethyl-; (K) 1-hexanol-2-ethyl-; (L) dodecane; (M) tetradecane; (N) nonane-5-methyl-5-propyl-; (O) dodecane-4,6-dimethyl-; (P) heptane-2,2,4,6,6-pentamethyl-; (Q) heptane-4-methyl-; (R) 2,4-di-tert-butylphenol.
Comparison of VOC Profiles between Single and Bulk Cells
For comparison reasons, we performed a general bulk cell analysis of the same lung cancer cell lines. The VOCs arising from bulk cells at T24 and T48 hr were studied using the same ITEX-GC-MS methodology (see Figure 2 and Transparent Methods section for more details). The summary of the different VOCs identified by MassHunter qualitative analysis are listed in Table S7. The table also provides the direction change (increase or decrease) of the abundances among the A549, H1299, H1975, BEAS-2B, and control medium. Under our experimental conditions an average of 750 peaks per sample were detected by deconvolution analysis. The significantly increased or decreased peaks were selected and were tentatively identified by spectral library match using the NIST 14. Only VOCs with a library match score higher than 90% were considered. Validation or absolute concentrations were not determined for the bulk analysis, as it was not part of the main goal presented here. Results show that after 24-hr incubation period, there was a difference in the peak area of 23 compounds in all cells compared with the control, whereby 20 VOCs were found to be significantly increased and three compounds were found to be significantly decreased (p <0.05) (Table S7). After 48-hr incubation period, differences in the peak area of 39 VOCs between all cell lines and control medium were detected, whereby 31 VOCs were significantly increased and eight VOCs were significantly decreased (p < 0.05) (Table S7). Under our experimental conditions, the composition of the detected VOCs was different for each cell line and further varied according to the incubation period. These VOCs mostly consisted of ketones, hydrocarbons, and alcohols. Ten of the VOCs in the 24- and 48-hr incubation period were found to be common to both groups. Comparison between the bulk and single-cell levels showed 12 common VOCs (butanal-3-methyl-, nonanal, benzaldehyde, 1-hexanol, 2-ethyl-, benzophenone, acetophenone, tetradecane, undecane-3,8-dimethyl-, nonane-5-methyl-5-propyl-, heptane-2,2,4,6,6-pentamethyl-, dodecane, 4,6-dimethyl-, 2,4-di-tert-butylphenol) found in examined cell lines from different time points. Although sample types produce different biomarker profiles, the fact that some compounds are actually similar is an encouraging outcome, strengthening our single-cell results.
Comparison of our results with previous bulk cell line studies provide some interesting data; whereas most VOCs found in bulk are different from those found significant in single cells Peled et al. showed that benzaldehyde levels were substantially lower in the headspace of bulk lung cancer cell lines compared with RPMI medium after incubation for ∼68 hr (Peled et al., 2013). Our results here show that indeed RPMI medium levels were significantly higher after 48 hr than the lung cancer cells; moreover, the benzaldehyde concentration in our results were below the LOD (1 ppb), and this correlates as well with the estimation of Peled et al. (Peled et al., 2013). They showed that the average concentration of benzaldehyde for an estimated bulk 7 × 10⁶ cells of H1975 (and related cells) is approximately 145 ppb. Based on their result we estimate the concentration in each single cell as 0.2 × 10⁻⁴ ppb. This calculation is indeed lower than 1 ppb, although it still 2- to 3-fold lower than actually measured concentration. This comparison support previous data, but it also shows that bulk and single-cell studies bring different insights that might be influenced by the heterogeneity of bulk analysis. In the A549, benzaldehyde trends were similar between our single-cell results and those of Peled et al., whereas a recent study showed that benzaldehyde in A549 relatively increased compared with the medium (Jia et al., 2018). These differences stress the need to perform VOC evaluation on all levels, from the single-cell level, to a few cells, to bulk, and up to real-breadth studies.
Benzophenone significantly decreased in cells at all time points, except for H1299 cells, in which no significant change was seen (Figure 5D). However, bulk data presented slight increase between 24 and 48 hr. Previous studies showed that benzophenone levels have been found to be lower in A549 cells compared with cancer cell-free growth medium (Hanai et al., 2012). Takemoto et al. explained the take up of benzophenone by cancer cells via an increase in the metabolism rate as a results of high oxidation rate of fatty acids in cancer cells (Takemoto et al., 2002). Ketone bodies could be also associated with amino acid metabolism (Murray et al., 2006). Acetophenone has been identified in both cancerous and normal cell lines. The levels of this VOC were found to be significantly increased in A549 cells, but no significant changes were found in H1299, BEAS-2B, and H1975 cells compared with control medium (Figure 5E). This is consistent with previous reports showing an increase in the acetophenone level in A549 cells compared with the culture medium (O’Neill et al., 1988, Agmon et al., 2016).
2,4-Dimethyl-1-heptene significantly increased in all cell lines, although only slight changes were seen in H1299 cells at T24 and T48 (Figure 5F). 2,4-Dimethyl-1-heptane was previously detected in the headspace of lung cancer cells and normal cells (Filipiak et al., 2010). Hakim et al. found that 2,4-dimethyl-1-heptane could serve as a biomarker of lung cancer and suggested that it probably arises due to oxidative stress (Hakim et al., 2012). Hexadecane significantly increased in A549 (p53-wild) and H1299 (p53-null) cells compared with BEAS-2B (p53-wild) and H1975 (p53-mut) cells at all time points (Figure 5G). Interestingly, pentadecane significantly decreased in BEAS-2B, A459, and H1299, but in H1975 cells it increased markedly at all time points (Figure 5H). This compound might be a biomarker for breast cancer (Phillips et al., 2010), yet no documentation in relation to lung cancer has been found.
Nonanal and undecane-3,8-dimethyl were found only in H1299 cells (p53-null), and their level significantly increased in a time-dependent manner (Figures 5I and 5J). Haick and co-workers have reported a decrease in the concentration of nonanal in H774, H69, H187, and H526 cells (Barash et al., 2012), but in our present study, nonanal levels increased in H1299 cells because these cells are p53 null-type. Bulk results showed increase at 24 hr, but a decrease after 48 hr. These differences can emphasize the changes occurring during growth progression that may cause some compounds to change between early stage (few cells) and late stage (millions of cells). Although no clear answer can be given based on current study, it might be related to heterogeneity changes of the bulk growth. Additional explanation for this increase may be the absence of the gene hampering metabolic regulation in the cell. It remains unclear how different forms of null-type p53 affect tumor metabolism. p53 regulates the metabolic pathways through its downstream targets (Figure S3) (Clendening et al., 2010). 1-Hexonol-2-ethyl- greatly increased in A549 cells at T24 and T48 hr compared with other cells (Figure 5K), but was not found in H1975 cells (p53-mut). Therefore, it could be considered a biomarker for lung cancer. Our bulk study also showed an increase after 24 hr but did not show significant change after 48 hr. This VOC was shown to increase in the headspace of cancer cells NCI-H2087 (113.87 ppb) and A459 compared with the medium in previous studies as well (Sponring et al., 2009, Chen et al., 2007). Sanchez et al. reported that 1-hexanol-2-ethyl- might be a biomarker in saliva for patients with lung cancer. These results indicate that the origin of this alcohol is probably from the metabolism of body fluids and of alkanes, which may be altered in different histological types of lung cancers (Sanchez Mdel et al., 2012).
Of the remaining VOCs, those in Figures 5L–5R were significantly increased only in the H1975 cell line (p53-mut) at all time points compared with other cells. H1975 cells are mutant-type p53, so this gene could contribute to the metabolic regulation; currently, however, the role of mutant-type p53 in tumor metabolism remains mostly unknown (Peled et al., 2013, Barash et al., 2015, Koyuturk et al., 2007). Interestingly, mutant-type p53 and wild-type p53 proteins often regulate the same cellular biological processes, but with opposite effects. For example, in metabolic regulation, wild-type p53 inhibits glycolysis, whereas mutant-type p53 promotes glycolysis through distinct mechanisms (Davies et al., 2014). Little seems to be known as to how p53 regulates different aspects of metabolism in different cell types in response to different stress signals, such as glucose starvation, nutritional deprivation, DNA damage, and oncogene activation. Although wild-type p53 can regulate many other aspects of metabolism, it is unclear how different forms of mutant p53 have different actions on tumor metabolism (Clendening et al., 2010, Liu et al., 2015). With that, clearly other existing differences, mutations within the human cell lines can influence some of these VOC changes and should be carefully addressed in the future.
This report provides preliminary evidence that single cells of (lung) cancer have unique (volatile) molecular prints; each cell sub-type, even if with only minor difference(s) in its genetic structure, has a unique volatile molecular print. Thus the presence of one cell would not screen out the others. The study reveals that all cell lines were consuming several compounds such as aldehydes and hydrocarbons, but fewer compounds from other chemical families. Decreased levels of aldehydes can be reasonably explained by the higher activity of aldehyde dehydrogenase in cancer cells. Nevertheless, the overall reasons for differences in VOC release or consumption between the examined cell lines are currently unknown but may result from phenotypic or genotypic differences. The power of VOCs may allow a different niche in metabolome related to volatile markers and, thus, open a whole world of disease biomarkers, which may shed some light on the hidden pathways of molecular transduction. Significant single-cell volatolomic data will provide insights to permit the development and testing of hypotheses that might identify the fundamental biological mechanisms and address clinical issues in diagnostics and diseases. Nevertheless, current developments indicate a forthcoming model shift from analysis of volatolomics to the study of single-cell volatolomics, which will enhance other “omics” approaches on the path toward better combined systems biology of single cells. Finally, the reported approach may serve as enabler source for developing new generation(s) of biomedical approaches for personalized screening, diagnosis, and future screening of various diseases in a non-invasive, inexpensive, and portable manner.
Limitations of Study
There were some limitations in the present study. First, here we fixed the background baseline of experiment by using the same culture media for all cells as done in many previous studies, thus BEAS-2B cells were not cultured in recommended media. This approach can ensure that the media per se is not the source of different compounds, something that cannot be done when using different media as previously published. Nevertheless, future studies should be performed in the recommended. Second, bulk data were calculated via peak area rather than via absolute concentration, as it was not the main goal here. Third, we have used only the ATCC-validated lung cancer cell lines in “p53 Hotspot Mutation Panel” dedicated for studying p53 molecular mechanisms. We refer to changes as related to the p53 difference because this is a major difference; however, other differences might be responsible for some of the changes in results and as such should be interpreted cautiously. Fourth, to isolate and grow single cells we have used serum-free media for slow proliferation. This might have also affected the VOC profiles; however, this step was performed on all cell lines, thus ensuring the same baseline to all. Finally, VOC detection at the single-cell level remains technically challenging due to many fundamental limitations, including the rapid change of the VOCs, small sampling volumes, low amount of VOCs, and diverse range of volatiles present in the cell, along with the present inadequacies in the sensitivity of analytical instruments. Still, the technology used to analyze the volatiles from single cells can provide valuable insights into the biological interactions - something that genomics and transcriptomics might be unable to deliver. This will allow understanding the unique properties of cells, cell-to-cell communication, and cell-environment interactions.
Methods
All methods can be found in the accompanying Transparent Methods supplemental file.
Acknowledgments
This work received funding from the Horizon 2020 ICT Program under the SNIFFPHONE (grant agreement no. 644031). We thank Morad K. Nakhleh reading the manuscript and for fruitful discussion.
Author Contributions
M.S., Y.Y.B., and H.H. conceived and designed the experiments. M.S. and Y.Y.B. interpreted the data, prepared the figures and tables, and wrote the manuscript. M.S. performed the experiments and analyzed the data. H.H. and A.M. directed the research. All authors discussed the results and commented on the manuscript.
Declaration of Interests
The authors declare no competing interests.
Published: January 25, 2019
Footnotes
Supplemental Information includes Transparent Methods, five figures, and seven tables and can be found with this article online at https://doi.org/10.1016/j.isci.2018.12.008.
Supplemental Information
Note: The ratio of the average concentrations of the target analyte compared with medium control and the p values of Kruskal-Wallis tests have been calculated for each cell density. VOC1: butanal-3-methyl; VOC2: butanal-2-methyl-; VOC3: nonanal; VOC4: benzaldehyde; VOC5: 1-hexanol-2-ethyl-; VOC6: benzophenone; VOC7: acetophenone; VOC8: dodecane; VOC9: 2-4-dimethyl-1-heptene; VOC10: tetradecane; VOC11: hexadecane; VOC12: pentadecane; VOC16: dodecane-4,6-dimethyl-; VOC17: heptane-4-methyl-; VOC18: 2,4-di-tetra-butylphenol. (1#, LOD of our system under experimental conditions showed 1 ppb for all compounds; *, below LOD [0.1–0.9]; -, not found). R2, correlation coefficients; RSD, relative standard deviation.
#, Constant; -, not found; ↑**/↓**, < 0.0001; ↑*/↓*, < 0.02–0.07; ↑/↓, ≥ 0.07
Note: Significantly different VOCs (p < 0.05) based on averaged peak area (n = 3). The changes indicate the difference in the average peak area between the human lung cancer cell line and normal lung cells (↑, increased; ↓, decreased; ↑*, < 0.01; ↑**, < 0.001).
References
- Agmon I.N., Abud M., Liran O., Gai-Mor N., Ilouze M., Onn A., Bar J., Navon R., Shlomi D., Haick H., Peled N. Exhaled breath analysis for monitoring response to treatment in advanced lung cancer. J. Thorac. Oncol. 2016;11:827–837. doi: 10.1016/j.jtho.2016.02.017. [DOI] [PubMed] [Google Scholar]
- Amal H., Ding L., Liu B.B., Tisch U., Xu Z.Q., Shi D.Y., Zhao Y., Chen J., Sun R.X., Liu H. The scent profile of hepatocarcinoma: in-vitro metastasis prediction with volatile organic compounds (VOCs) Int. J. Nanomedicine. 2012;7:4135–4146. doi: 10.2147/IJN.S32680. [DOI] [PMC free article] [PubMed] [Google Scholar]
- Amantonico A., Urban P.L., Zenobi R. Analytical techniques for single-cell metabolomics: state of the art and trends. Anal. Bioanal. Chem. 2010;398:2493–2504. doi: 10.1007/s00216-010-3850-1. [DOI] [PubMed] [Google Scholar]
- Bajtarevic A., Ager C., Pienz M., Klieber M., Schwarz K., Ligor M., Ligor T., Filipiak W., Denz H., Fiegl M. Non-invasive detection of lung cancer by analysis of exhaled breath. BMC Cancer. 2009;9:348. doi: 10.1186/1471-2407-9-348. [DOI] [PMC free article] [PubMed] [Google Scholar]
- Barash O., Peled N., Hirsch F.R., Haick H. Sniffing the unique 'odor print' of non-small-cell lung cancer with gold nanoparticles. Small. 2009;5:2618–2624. doi: 10.1002/smll.200900937. [DOI] [PMC free article] [PubMed] [Google Scholar]
- Barash O., Peled N., Bunn P.A., Hirsch F.R., Haick H. Classification of lung cancer histology by gold nanoparticle sensors. Nanomedicine. 2012;8:580–589. doi: 10.1016/j.nano.2011.10.001. [DOI] [PMC free article] [PubMed] [Google Scholar]
- Barash O., Zhang W., Halpern J.M., Hua Q.L., Pan Y.P., Kayal H., Khoury K., Liu H., Davies M.P.A., Haick H. Differentiation between genetic mutations of breast cancer by breath volatolomics. Oncotarget. 2015;6:44864–44876. doi: 10.18632/oncotarget.6269. [DOI] [PMC free article] [PubMed] [Google Scholar]
- Broza Y.Y., Haick H. Nanomaterial-based sensors for detection of disease by volatile organic compounds. Nanomedicine (Lond.) 2013;8:785–806. doi: 10.2217/nnm.13.64. [DOI] [PubMed] [Google Scholar]
- Broza Y.Y., Mochalski P., Ruzsanyi V., Amann A., Haick H. Hybrid volatolomics and disease detection. Angew. Chem. Int. Ed. 2015;54:11036–11048. doi: 10.1002/anie.201500153. [DOI] [PubMed] [Google Scholar]
- Broza Y.Y., Vishinkin R., Barash O., Nakhleh M.K., Haick H. Synergy between nanomaterials and volatile organic compounds for non-invasive medical evaluation. Chem. Soc. Rev. 2018;47:4781–4859. doi: 10.1039/c8cs00317c. [DOI] [PubMed] [Google Scholar]
- Di Carlo D., Tse H.T., Gossett D.R. Introduction: why analyze single cells? Methods Mol. Biol. 2012;853:1–10. doi: 10.1007/978-1-61779-567-1_1. [DOI] [PubMed] [Google Scholar]
- Chen X., Xu F., Wang Y., Pan Y., Lu D., Wang P., Ying K., Chen E., Zhang W. A study of the volatile organic compounds exhaled by lung cancer cells in vitro for breath diagnosis. Cancer. 2007;110:835–844. doi: 10.1002/cncr.22844. [DOI] [PubMed] [Google Scholar]
- Chung C.H., Levy S., Chaurand P., Carbone D.P. Genomics and proteomics: emerging technologies in clinical cancer research. Crit. Rev. Oncol. Hematol. 2007;1:1–25. doi: 10.1016/j.critrevonc.2006.06.005. [DOI] [PubMed] [Google Scholar]
- Clendening J.W., Pandyra A., Boutros P.C., El Ghamrasni S., Khosravi F., Trentin G.A., Martirosyan A., Hakem A., Hakem R., Jurisica I. Dysregulation of the mevalonate pathway promotes transformation. Proc. Natl. Acad. Sci. U S A. 2010;107:15051–15056. doi: 10.1073/pnas.0910258107. [DOI] [PMC free article] [PubMed] [Google Scholar]
- Davies M.P., Barash O., Jeries R., Peled N., Ilouze M., Hyde R., Marcus M.W., Field J.K., Haick H. Unique volatolomic profiles of TP53 and KRAS in lung cells. Br. J. Cancer. 2014;111:1213–2121. doi: 10.1038/bjc.2014.411. [DOI] [PMC free article] [PubMed] [Google Scholar]
- Doran S.L.F., Romano A., Hanna G.B. Optimisation of sampling parameters for standardised exhaled breath sampling. J. Breath Res. 2017;12:016007. doi: 10.1088/1752-7163/aa8a46. [DOI] [PubMed] [Google Scholar]
- Feinberg T., Herbig J., Kohl I., Las G., Cancilla J., Torrecilla J., Ilouze M., Haick H., Peled N. Cancer metabolism - the volatile profile of glycolysis - in vitro model in lung cancer cells. J. Breath Res. 2017;11:016008. doi: 10.1088/1752-7163/aa51d6. [DOI] [PubMed] [Google Scholar]
- Filipiak W., Sponring A., Mikoviny T., Ager C., Schubert J., Miekisch W., Amann A., Troppmair J. Release of volatile organic compounds (VOCs) from the lung cancer cell line CALU-1 in-vitro. Cancer Cell Int. 2008;8:17. doi: 10.1186/1475-2867-8-17. [DOI] [PMC free article] [PubMed] [Google Scholar]
- Filipiak W., Sponring A., Filipiak A., Ager C., Schubert J., Miekisch W., Amann A., Troppmair J. TD-GC-MS analysis of volatile metabolites of human lung cancer and normal cells in vitro. Cancer Epidemiol. Biomarkers Prev. 2010;19:182–195. doi: 10.1158/1055-9965.EPI-09-0162. [DOI] [PubMed] [Google Scholar]
- Haick H., Broza Y.Y., Mochalski P., Ruzsanyi V., Amann A. Assessment origin and implementation of breath volatile cancer markers. Chem. Soc. Rev. 2014;43:1423–1449. doi: 10.1039/c3cs60329f. [DOI] [PMC free article] [PubMed] [Google Scholar]
- Hakim M., Broza Y.Y., Barash O., Peled N., Phillips M., Amann A., Haick H. Volatile organic compounds of lung cancer and possible biochemical pathways. Chem. Rev. 2012;112:5949–5966. doi: 10.1021/cr300174a. [DOI] [PubMed] [Google Scholar]
- Hanai Y., Shimono K., Oka H., Baba Y., Yamazaki K., Beauchamp G.K. Analysis of volatile organic compounds released from human lung cancer cells and from the urine of tumor bearing mice. Cancer Cell Int. 2012;12:7. doi: 10.1186/1475-2867-12-7. [DOI] [PMC free article] [PubMed] [Google Scholar]
- Heath J.R., Ribas A., Mischel P.S. Single cell analytic tools for drug discovery and development. Nat. Rev. Drug Discov. 2016;3:204–216. doi: 10.1038/nrd.2015.16. [DOI] [PMC free article] [PubMed] [Google Scholar]
- Hou Y., Guo H., Cao C., Li X., Hu B., Zhu P., Wu X., Wen L., Tang F., Huang Y., Peng J. Single-cell triple omics sequencing reveals genetic, epigenetic, and transcriptomic heterogeneity in hepatocellular carcinomas. Cell Res. 2016;3:304–319. doi: 10.1038/cr.2016.23. [DOI] [PMC free article] [PubMed] [Google Scholar]
- Jia Z., Zhang H., Nam Ong C., Patra A., Lu Y., Teck Lim C., Venkatesan T. Detection of lung cancer: concomitant volatile organic compounds and metabolomic pro filing of six cancer cell lines of different histological origins. ACS Omega. 2018;3:5131–5140. doi: 10.1021/acsomega.7b02035. [DOI] [PMC free article] [PubMed] [Google Scholar]
- Khoo B.L., Chaudhuri P.K., Ramalingam N., Tan D.S., Lim C.T., Warkiani M.E. Single-cell profiling approaches to probing tumor heterogeneity. Int. J. Cancer. 2016;139:243–255. doi: 10.1002/ijc.30006. [DOI] [PubMed] [Google Scholar]
- Koyuturk M., Ersoz M., Altiok N. Simvastatin induces apoptosis in human breast cancer cells: p53 and estrogen receptor independent pathway requiring signaling through JNK. Cancer Lett. 2007;250:220–228. doi: 10.1016/j.canlet.2006.10.009. [DOI] [PubMed] [Google Scholar]
- Liu J., Zhang C., Hu W., Feng Z. Tumor suppressor p53 and its mutants in cancer metabolism. Cancer Lett. 2015;356:197–203. doi: 10.1016/j.canlet.2013.12.025. [DOI] [PMC free article] [PubMed] [Google Scholar]
- Mochalski P., Sponring A., King J., Unterkofler K., Troppmair J., Amann A. Release and uptake of volatile organic compounds by human hepatocellular carcinoma cells (HepG2) in vitro. Cancer Cell Int. 2013;13:72. doi: 10.1186/1475-2867-13-72. [DOI] [PMC free article] [PubMed] [Google Scholar]
- Murray R., Granner D., Mayes P., Rodwell V. 27th Edition. McGraw-Hill Medical; 2006. Harper’s Illustrated Biochemistry. [Google Scholar]
- Nakhleh M.K., Amal H., Jeries R., Broza Y.Y., Aboud M., Gharra A., Ivgi H., Khatib S., Badarneh S., Har-Shai L. Diagnosis and classification of 17 diseases from 1404 subjects via pattern analysis of exhaled molecules. ACS. Nano. 2017;11:112–125. doi: 10.1021/acsnano.6b04930. [DOI] [PMC free article] [PubMed] [Google Scholar]
- O’Neill H.J., Gordon S.M., O'Neill M.H., Gibbons R.D., Szidon J.P. A computerized classification technique for screening for the presence of breath biomarkers in lung cancer. Clin. Chem. 1988;8:1613–1618. [PubMed] [Google Scholar]
- Patel M., Lu L., Zander D.S., Sreerama L., Coco D., Moreb J.S. ALDH1A1 and ALDH3A1 expression in lung cancers: correlation with histologic type and potential precursors. Lung Cancer. 2008;59:340–349. doi: 10.1016/j.lungcan.2007.08.033. [DOI] [PubMed] [Google Scholar]
- Peled N., Barash O., Tisch U., Ionescu R., Ilouze M., Mattei M., Bunn P.A.R., Hirsch F.R., Haick H. Volatile profiles of cancer specific genetic mutations. Nanomedicine. 2013;9:758–766. doi: 10.1016/j.nano.2013.01.008. [DOI] [PMC free article] [PubMed] [Google Scholar]
- Phillips M., Cataneo R.N., Saunders C., Hope P., Schmitt P., Wai J. Volatile biomarkers in the breath of women with breast cancer. J. Breath Res. 2010;4 doi: 10.1088/1752-7155/4/2/026003. [DOI] [PubMed] [Google Scholar]
- Rockwell S. In vivo-in vitro tumour cell lines: characteristics and limitations as models for human cancer. Br. J. Cancer Suppl. 1980;4:118–122. [PMC free article] [PubMed] [Google Scholar]
- Sanchez Mdel N., Garcia E.H., Pavon J.L., Cordero B.M. Fast analytical methodology based on mass spectrometry for the determination of volatile biomarkers in saliva. Anal. Chem. 2012;84:379–385. doi: 10.1021/ac2026892. [DOI] [PubMed] [Google Scholar]
- Schmidt F., Efferth T. Tumor heterogeneity, single-cell sequencing, and drug resistance. Pharmaceuticals. 2016:2–33. doi: 10.3390/ph9020033. [DOI] [PMC free article] [PubMed] [Google Scholar]
- Sellick C.A., Hansen R., Stephens G.M., Goodacre R., Dickson A.J. Metabolite extraction from suspension cultured mammalian cells for global metabolite profiling. Nat. Protoc. 2011;6:1241–1249. doi: 10.1038/nprot.2011.366. [DOI] [PubMed] [Google Scholar]
- Silva C.L., Perestrelo R., Silva P., Tomas H., Camara J.S. Volatile metabolomic signature of human breast cancer cell lines. Sci. Rep. 2017;7:43969. doi: 10.1038/srep43969. [DOI] [PMC free article] [PubMed] [Google Scholar]
- Sponring A., Filipiak W., Mikoviny T., Ager C., Schubert J., Miekisch W., Amann A., Troppmair J. Release of volatile organic compounds from the lung cancer cell line NCI-H2087 in-vitro. Anticancer Res. 2009;29:419–426. [PubMed] [Google Scholar]
- Takemoto K., Yamazaki H., Nakajima M., Yokoi T. Genotoxic activation of benzophenone and its two metabolites by human cytochrome P450s in SOS/umu assay. Mutat. Res. 2002;519:199–204. doi: 10.1016/s1383-5718(02)00141-9. [DOI] [PubMed] [Google Scholar]
- Templer R.H., Ces O. New frontiers in single-cell analysis. J. R. Soc. Interface. 2008;5:S111–S112. doi: 10.1098/rsif.2008.0279.focus. [DOI] [PMC free article] [PubMed] [Google Scholar]
- Wang D., Bodovitz S. Single cell analysis: the new frontier in "omics". Trends Biotechnol. 2010;28:281–290. doi: 10.1016/j.tibtech.2010.03.002. [DOI] [PMC free article] [PubMed] [Google Scholar]
- Wilkins M.R., Sanchez J.C., Gooley A.A., Appel R.D., Humphery Smith I., Hochstrasser D.F., Williams K.L. Progress with proteome projects: why all proteins expressed by a genome should be identified and how to do it. Biotechnol. Genet. Eng. Rev. 1996;13:19–50. doi: 10.1080/02648725.1996.10647923. [DOI] [PubMed] [Google Scholar]
- Yamamura S., Kishi H., Tokimitsu Y., Kondo S., Honda R., Rao S.R., Omori M., Tamiya E., Muraguchi A. Single-cell microarray for analyzing cellular response. Anal. Chem. 2005;77:8050–8056. doi: 10.1021/ac0515632. [DOI] [PubMed] [Google Scholar]
- Zenobi R. Single-cell metabolomics: analytical and biological perspectives. Science. 2013;342 doi: 10.1126/science.1243259. [DOI] [PubMed] [Google Scholar]
- Zimmermann D., Hartmann M., Moyer M.P., Nolte J., Baumbach J.I. Determination of volatile products of human colon cell line metabolism by GC/MS analysis. Metabolomics. 2007;3:13–17. [Google Scholar]
Associated Data
This section collects any data citations, data availability statements, or supplementary materials included in this article.
Supplementary Materials
Note: The ratio of the average concentrations of the target analyte compared with medium control and the p values of Kruskal-Wallis tests have been calculated for each cell density. VOC1: butanal-3-methyl; VOC2: butanal-2-methyl-; VOC3: nonanal; VOC4: benzaldehyde; VOC5: 1-hexanol-2-ethyl-; VOC6: benzophenone; VOC7: acetophenone; VOC8: dodecane; VOC9: 2-4-dimethyl-1-heptene; VOC10: tetradecane; VOC11: hexadecane; VOC12: pentadecane; VOC16: dodecane-4,6-dimethyl-; VOC17: heptane-4-methyl-; VOC18: 2,4-di-tetra-butylphenol. (1#, LOD of our system under experimental conditions showed 1 ppb for all compounds; *, below LOD [0.1–0.9]; -, not found). R2, correlation coefficients; RSD, relative standard deviation.
#, Constant; -, not found; ↑**/↓**, < 0.0001; ↑*/↓*, < 0.02–0.07; ↑/↓, ≥ 0.07
Note: Significantly different VOCs (p < 0.05) based on averaged peak area (n = 3). The changes indicate the difference in the average peak area between the human lung cancer cell line and normal lung cells (↑, increased; ↓, decreased; ↑*, < 0.01; ↑**, < 0.001).