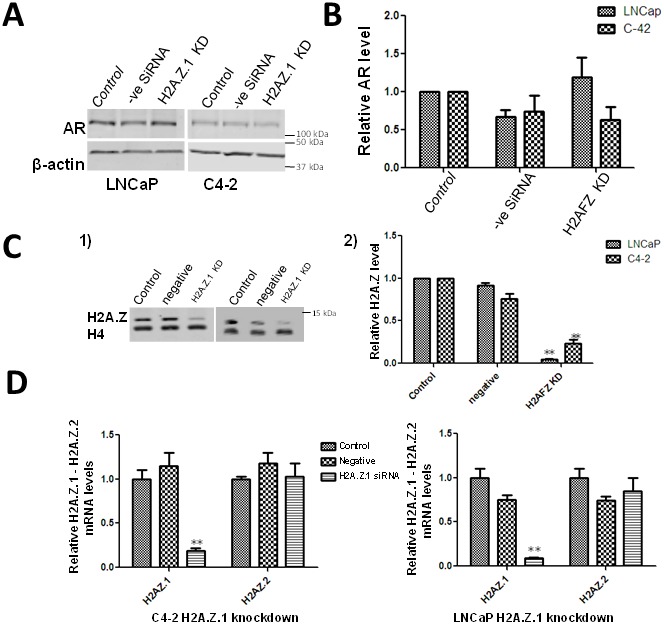
Figure 5. Effect of H2A. Z.1 (H2AFZ) knock down on the levels of AR.

(A) Western blot analyses of siRNA-mediated knockdown of H2A.Z.1 (H2AFZ) in LNCaP and C4-2 cells. The change in levels of AR and H2A.Z were normalized using β-actin. (B) The data from 3 independent experiments is graphically represented using GraphPad Prism version 5 software. Student’s t- tests were used to calculate significance; P value, * P < 0.05, **P < 0.01, ***P < 0.001. Starting cells: (control), cells transfected with a scrambled non-targeted siRNA: (negative siRNA) and H2A.Z.1 siRNA (H2A.Z.1 KD). (C) Western blot analysisof protein lysates obtained from starting LNCaP/C4-2 (control), cells transfected with a scrambled siRNA (negative) and cells transfected with H2A.Z.1 siRNA. (C-1) Image of a representative blot. (C-2) Quantitative analysis using histone H4 as a normalizer. The figure shows the average of three independent experiments. Student’s t- tests were used to calculate significance; P value, * P < 0.05, **P < 0.01, ***P < 0.001. (D) qRT-PCR analysis of H2A.Z.1 knock down efficiency and specificity in C4-2 and LNCaP cells.
