Abstract
The rice blast fungus, Magnaporthe oryzae, is an important pathogen of rice plants. It is well known that genes encoded in the genome have different evolutionary histories that are related to their functions. Phylostratigraphy is a method that correlates the evolutionary origin of genes with evolutionary transitions. Here we applied phylostratigraphy to partition total gene content of M. oryzae into distinct classes (phylostrata), which we designated PS1 to PS7, based on estimation of their emergence time. Genes in individual phylostrata did not show significant biases in their global distribution among seven chromosomes, but at the local level, clustering of genes belonging to the same phylostratum was observed. Our phylostrata-wide analysis of genes revealed that genes in the same phylostratum tend to be similar in many physical and functional characteristics such as gene length and structure, GC contents, codon adaptation index, and level of transcription, which correlates with biological functions in evolutionary context. We also found that a significant proportion of genes in the genome are orphans, for which no orthologs can be detected in the database. Among them, we narrowed down to seven orphan genes having transcriptional and translational evidences, and showed that one of them is implicated in asexual reproduction and virulence, suggesting ongoing evolution in this fungus through lineage-specific genes. Our results provide genomic basis for linking functions of pathogenicity factors and gene emergence time.
KEYWORDS: rice blast fungus, gene emergence time, phylostratigraphy, evolution, orphan genes
1. Introduction
Magnaporthe oryzae is one of the best studied fungal pathogens, largely because of agricultural and food security relevance of the rice blast disease it causes, in addition to the fundamental studies that have contributed broadly to our understanding of development and pathogenesis in the fungal pathogens of plants [1,2]. M. oryzae initiates its infection on plant by disseminating asexual spore, conidium. Conidium that lands on plant leaf surface germinates and starts to develop a specialized infection structure called appressorium at the germ tube apex upon recognition of surface hardness and hydrophobicity [1,3]. Using appressorium, the fungus mechanically penetrates into and grows inside the plant tissues [4]. Such invasive growth ultimately leads to formation of visible leaf lesions, which can result in significant yield losses or even death of entire plant [5]. The genome sequences of M. oryzae isolates and related species have already provided valuable knowledge about genetic mechanisms and evolution of fungal pathogenesis [6,7]. To date, more than hundred genes implicated in fungal development and pathogenesis were identified and characterized in the fungus [8,9].
Phylostratigraphy is a method that allows researchers to study the characteristics of genes over time in the context of grouping of genes by their phylogenetic origin [10]. Phylostratigraphy is devised based on the observations that comparison of genome sequences shows that a significant proportion of genes in the genome occur only in delimited evolutionary lineages. This points out that such genes have arisen during the evolution of the corresponding lineages, potentially contributing to lineage-specific adaptation. Phylostratigraphy approaches have been used to answer interesting questions such as tracking origin of cancer genes in metazoan lineages and delineating birth of new genes [11–13]. Recently, comparative genomics for four species of Armillaria (fungal forest pathogens) took advantage of phylostratigraphic approach to show that rhizomorphs express an evolutionarily young transcriptome [14].
Lineage-specific genes are often called orphan genes or taxonomically restricted genes, and considered to originate from two mechanisms: duplication-divergence model and de novo model. Duplication-divergence model posits that genes are duplicated and undergo fast divergence, providing raw materials for functional innovation [15]. Such duplication and rearrangement mechanisms have long been thought to be the primary driving force of gene evolution. In contrast, de novo model, which recently emerges as an additional important mechanism, predicts that genes can arise from non-coding genomic regions [16]. Lineage-specific genes are known to be involved in lineage-specific adaptations or evolutionary transitions [16,17].
Here in this study, we took advantage of phylostratigraphy approach for dissection of gene repertoire in the genome of M. oryzae. Instead of rigorous statistical analysis, however, we applied the concept of mapping gene emergence time across a defined phylogeny. Such breakdown of genes by their evolutionary age showed that physical and functional characteristics of genes correlate with their ages. Analysis on evolutionary ages of known pathogenicity genes suggested that our efforts to understand fungal pathogenesis at the molecular level are biased toward the genes that are highly conserved among diverse organisms. Orphan genes, for which no orthologs can be found in the database, accounted for a significant fraction of M. oryzae genome, and yet their functions, in most cases, were obscure. We provided an example of orphan gene that are implicated in fungal pathogenicity, suggesting that at least some of the orphan genes are recent addition to the genome for evolution of fungal pathogenesis.
2. Materials and methods
2.1. Estimation of gene emergence time in the phylogenetic context
Seven different phylogenetic levels were defined, based on phylogeny in MycoCosm (https://genome.jgi.doe.gov/programs/fungi/) [18]. We chose major evolutionary transitions leading to the M. oryzae lineages, resulting in seven phylogenetic strata (phylostrata). In order to estimate emergence time of protein-coding genes, the predicted protein sequences of M. oryzae 70–15 were obtained from MycoCosm. The protein sequences were subjected to BLASTP search against the NCBI nr database with the cutoff threshold of 1e-5 [19]. For each BLASTP hit, the taxon in which the target sequence belongs to was retrieved by using NCBI taxonomy database [20]. Subsequently, each protein sequence was assigned into one of the seven phylogenetic strata (phylostrata) to investigate major evolutionary transitions leading to the M. oryzae lineages. Each protein sequence was assigned into one of the seven taxonomic levels (phylostrata) if the number of total significant hits becomes equal to that of the corresponding phylostratum.
2.2. Analysis of gene structure and function
Genome annotation information was downloaded from Magnaporthe Comparative Genomics Project website (https://www.broadinstitute.org/scientific-community/ sci ence/projects/fungal-genome-initiative/magnaporthe-co mparative-genomics-proj/). Comparison and statistical analysis of gene structure and function were performed using packages available in R programming environment [21]. GC content and amino acid composition of proteins were analyzed using “seqinr” package. For calculation of codon adaptation index (CAI), codon table for Magnaporthe was downloaded from the codon usage database (http://www.kazusa.or.jp/codon/) and used for calculation of CAI in R. Hydropathy index was calculated using functions built in “Peptides” package. Transcript abundance of genes in mycelia tissue was obtained from a previous study [22] and used for comparing phylostrata-wise transcription levels of genes. Circular representation of genomes and genes were drawn using “circlize” package. Gene ontology analysis was carried out using topGO package. Analyses of putative secreted proteins were performed using the data obtained from Fungal Secretome Database (http://fsd.snu.ac.kr/) [23].
2.3. Targeted deletion of orphan genes
For targeted deletion of orphan genes, gene deletion construct was designed for targeted replacement of ORF with hygromycin B phosphotransferase gene (HPH) cassette by homologous recombination. At least over 1 kb regions flanking the 5′ and 3′ of the ORF were amplified and fused to the HPH sequence by fusion PCR (Table 1 in Supplementary Material for primer information on MoHKR1 knockout). The construct was introduced to the wild-type KJ201 protoplasts by PEG-mediated transformation. Transformants were selected on solid TB3 media (0.3% yeast extract, 0.3% casamino acid, 1% glucose, 20% sucrose and 0.8% agar powder; all w/v) containing 200 ppm hygromycin B and screened by PCR to identify successful deletion mutants with a single integration event. Genetic complementation was carried out by re-introducing ORF with the aforementioned flanking regions into the mutant protoplasts together with plasmid pII99 containing the geneticin resistance marker. Complementation strains were screened first on solid TB3 medium supplemented with 800 ppm geneticin and then by PCR.
3. Results and discussion
3.1. Phylostratigraphy of M. oryzae genome
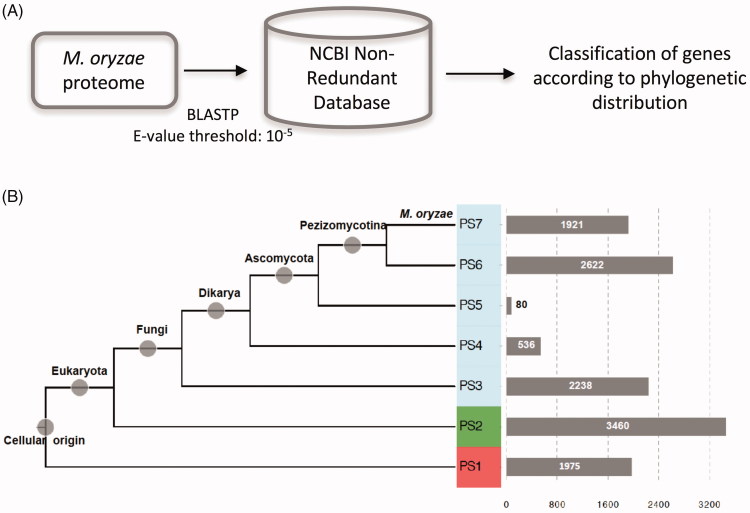
The phylostratigraphic approach was used to estimate emergence time of each of 12,832 annotated protein-coding loci in the genome of M. oryzae (Figure 1 and Table 2 in Supplementary Material). Alternative splicing was not considered here in our analysis. In phylostratigraphic approach using BLASTP, e-value cutoff was set to 1e-5. BLAST was shown to be sensitive enough to detect orthologs among distantly related species, and e-value threshold of <1e-3 is known to provide optimal compromise between sensitivity and accuracy [24]. Seven phylogenetic classes (phylostrata) were defined according to consensus phylogenetic relationship (https://genome.jgi.doe.gov/programs/fungi/). The first phylostratum (PS1) represents genes that underlie the basis of all cellular life, while the last phylostratum represents lineage-specific genes leading to M. oryzae. Intermediate phylostrata (PS2 to PS6) correspond to major evolutionary events such as split of Ascomycota fungi from Dikarya. We checked out our results by two methods. First, we examined placement of histone-modifying enzymes in phylostrata. Histone-modifying enzymes such as histone acetyltransferase (HAT), histone deacetylase (HDAC), histone methyltransferase (HMT), and histone demethylase (HME) should be related to evolution of eukaryotes. Our data are congruent with evolution of such eukaryotic histone-modifying system by placing these enzymes only in PS2 and PS3 (Figure 1 in Supplementary Material) [25,26]. Some of the histone-modifying enzymes in PS3 indicates that they are fungal-specific histone-modifying enzymes. Indeed, Rtt109 among them is a well-known fungal-specific histone acetyltransferase that has attracted attention as a potential anti-fungal drug target. We also examined placement of a well-characterized pathogenicity factor, DES1, which is known to be Pezizomycotina-specific [27]. We found that DES1 is located in PS6. Taken together, these results suggest that our data is reliable and accurate enough for further analyses.
Our analysis shows that approximately 42% of annotated protein-coding genes in M. oryzae originated from prokaryotic and eukaryotic ancestors (PS1-2) Figure 1(B). The remaining genes emerged later in evolution of M. oryzae. Notably, we observed high peaks during split of eukaryotes to fungal lineages (PS2-3) and split of Ascomycota to Pezizomycotina (PS5-6). A high peak is also evident in PS7, which represents all genes that evolved in lineages leading to M. oryzae from Pezizomycotina ancestors. In particular, genes in PS7 might represent de novo evolved genes, since these genes are not found even in genomes of closely related plant pathogenic fungi such as M. poae and Gaeumannomyces graminis [28].
Figure 1.
Estimation of gene emergence time through phylogenetic distribution of genes using BLASTP search. (A) Diagram summarizing the process of gene emergence time estimation. (B) Summary of phylogenetic distribution of genes according to BLASTP results. Nodes marked by gray circle represent evolutionary lineages leading to Magnaporthe oryzae. Phylostrata corresponding to fungal lineages were shaded with light blue. Horizontal bars represent number of genes that fall in the corresponding phylostrata.
The PS7 genes are M. oryzae-specific genes, of which orthologs cannot be found in database. Such genes are called orphans in many literatures. A previous study, where the same e-value threshold was applied for identification of orphan genes, reported that there are a total of 2,740 orphan genes in M. oryzae genome [29], in contrast to our estimation of 1,921 orphans. This discrepancy can be attributed to the size difference in the databases used for BLASTP search: NCBI nr vs. CFGP (Comparative Fungal Genomics Platform (http://cfgp.riceblast.snu.ac.kr/)) [30]. Since NCBI nr database covers much broader taxa and also contains meta-genomic sequences, it is likely that the estimation made in our study is much more accurate than the previous one.
3.2. Distribution of genes across and within chromosomes
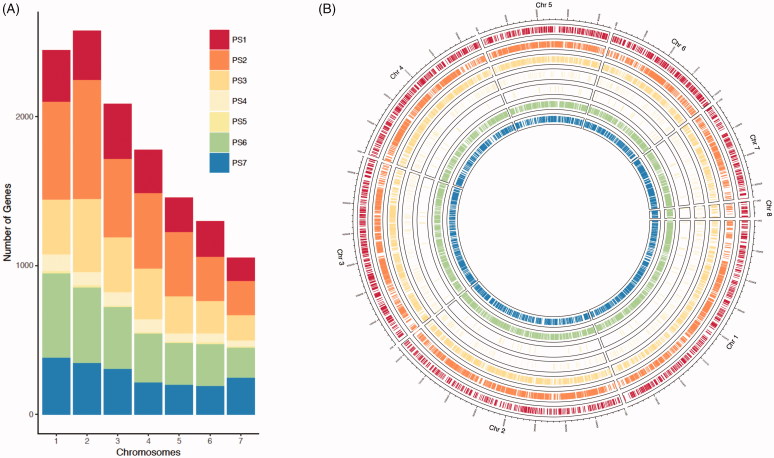
Following partitioning of protein-coding genes into the defined phylostrata, we asked if physical location of genes shows any correlation with phylostrata across and within chromosomes. Among seven chromosomes of M. oryzae, chromosome 2 is the longest (∼ 8.3 Mb) and chromosome 7 is the shortest (3.4 Mb). We found that genes in each phylostrata reside on seven chromosomes in proportion to the length of individual chromosomes Figure 2(A), even though minor biases were detected in chromosome 2 and 7. For example, PS1 and PS7 genes were under-represented in chromosome 2, while PS7 genes were over-represented in chromosome 7.
Figure 2.
Distribution of genes belonging to different phylostrata across and within seven chromosomes of Magnaporthe oryzae. (A) Distribution of genes across fungal chromosomes. Number of genes that correspond to individual phylostrata was marked by color codes. (B) Circular representation of gene distribution within chromosomes. Lines within each track represent genes in a particular phylostratum. The same color codes as in (A) were applied to the circular representation.
We also checked if there are any biases in distribution of genes within individual chromosomes Figure 2(B). However, we were not able to detect any large blocks enriched with genes from a particular phylostratum. This suggests that gene emergence appears to be randomly scattered across and within chromosomes regardless of their emergence time during evolution of M. oryzae.
3.3. Genomic features across ages
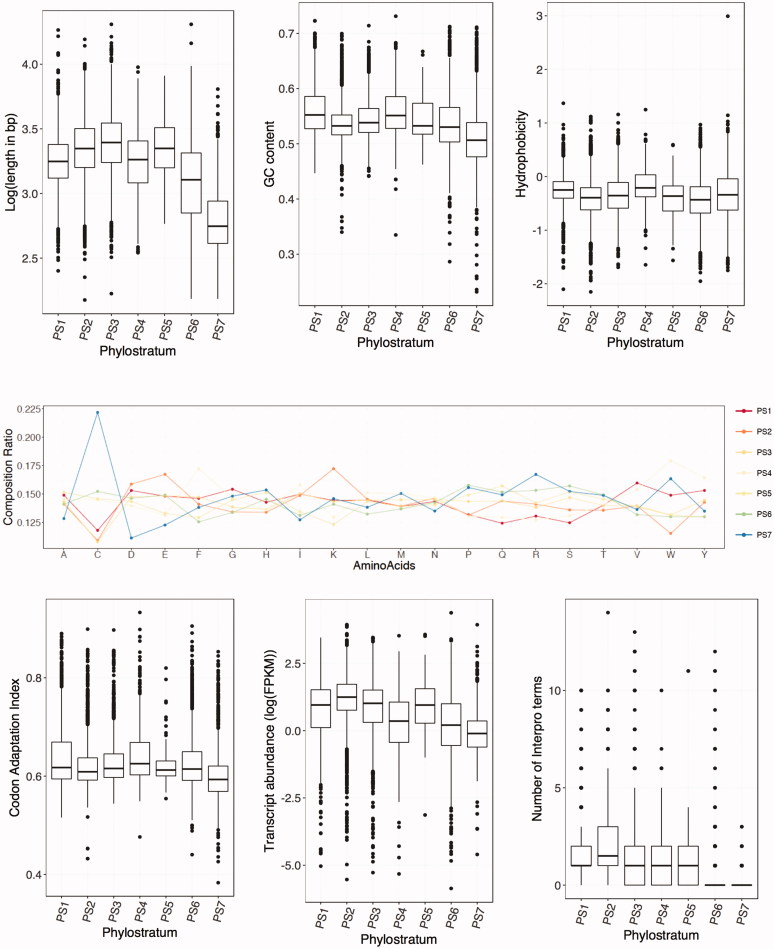
We used phylostratigraphic assignment to assess the trends over time for several physical, transcription- and/or translation-related features of genes and their protein products. With respect to physical features, gene length, GC content, hydrophobicity and amino acid composition were examined. Gene length and GC content showed tendency to decrease gradually from “old genes” (PS1-3) to “new genes” (PS7) with some exceptions (top panel in Figure 3). However, hydrophobicity of protein products did not seem to be different among phylostrata. Unlike duplication-divergence model of gene birth, the de novo model predicts that younger genes should be shorter than older genes, since it is highly unlikely that proteins from new genes achieve high degree of complexity de novo [16]. In combination with the fact that genes are often characterized by having a higher GC content than the GC content of entire genome, observed length dependence over time suggests significant contribution of de novo gene birth to evolution of M. oryzae genome. Interestingly, we found that proteins encoded by orphan genes (PS7) have considerably higher cysteine residues than ones from other phylostrata (middle panel in Figure 3). High cysteine content was reported in proteins that are secreted into extracellular milieu [31], suggesting that orphan genes may be enriched with such secreted proteins. However, our analysis did not detect any particular enrichment of putative secreted proteins in PS7 (Figure 2 in Supplementary Material). It is worth noting that at least experimentally characterized secreted proteins were enriched in PS6 and PS7 (among 20 proteins, 11 and 3 were found in PS6 and PS7, respectively).
Figure 3.
Physical and functional features of genes across phylostrata. Top panels represent distributions of gene length, GC content and hydropathy index in different phylostrata. Middle panel shows amino acid composition in proteins according to phylostrata. Bottom panels represent distribution of codon adaptation index, transcript abundance and number of Interpro domains in proteins across phylostrata.
CAI, which measures codon usage bias, exhibited no age dependence among phylostrata [32]. Only PS7 has significantly lower CAI value distribution (bottom left panel in Figure 3). Transcript abundance in hyphal tissue, however, again showed time-dependent trend: the older genes are, the more they tend to be expressed (bottom middle panel in Figure 3). These observations may reflect degree of functional contributions that genes make to the cells. In line with this, older genes tend to have higher number of functional domains, while younger genes tend to have no or less number of domains (bottom right panel in Figure 3).
3.4. Functional implications of gene age
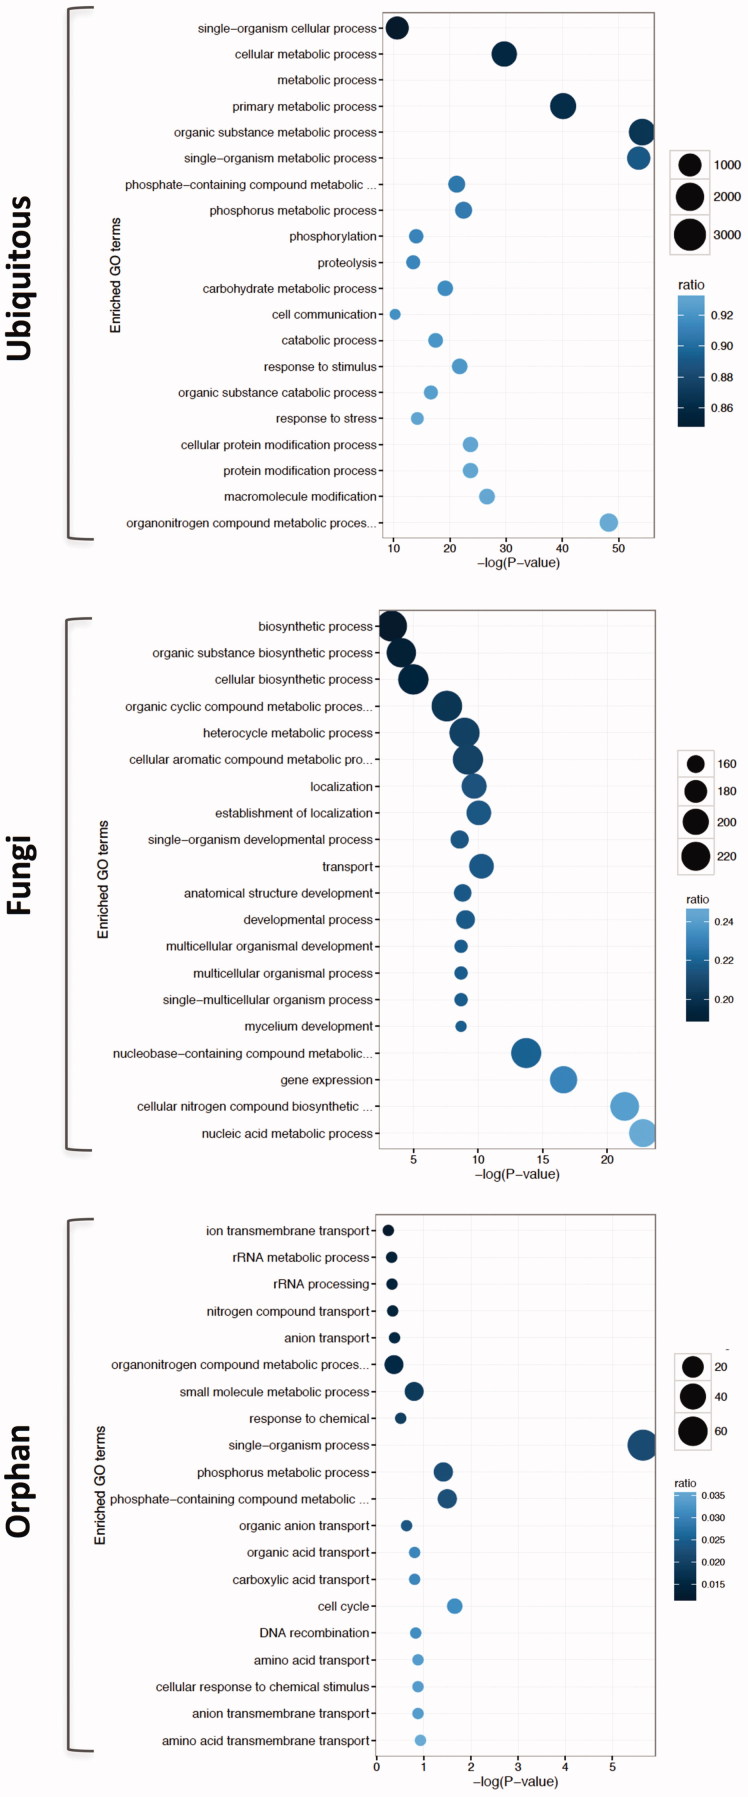
Given the observed trends across phylostrata, we then asked how emergence time of genes is related to their functionalities, using gene ontology (GO) analysis (Figure 4). During our analysis, we noticed that it is not practical to investigate and compare genes from all phylostrata, since there are too many combinations for comparisons, and PS5 contains too small number of genes to draw any statistically meaningful conclusion. Therefore, phylostrata were further grouped into three categories: ubiquitous, fungi, and orphan. We defined genes that are found in all cellular life forms and/or eukaryotes as ubiquitous (hereafter abbreviated as Ubi). Fungi group of genes is ones that are present only in fungal species. Orphans are M. oryzae-specific genes.
Figure 4.
Summary of GO enrichment analysis (biological process) for Ubi, Fungi, and Orphan groups. GO terms that are enriched with a particular group of genes are shown (Fisher’s exact test, P < 0.01). Area of circle represents the number of genes assigned to the particular GO term. Color of the circle indicates the proportion of genes assigned to the GO term in our data set among the total number of genes having that GO term in the genome.
GO analysis showed that Ubi gene group is enriched with functions that are generally required for cells to be cells, such as single-organism cellular process, primary metabolic process, protein modification process, and macromolecule modification, just to name a few (top panel in Figure 4). GO terms enriched in fungi gene group fall broadly under three categories: nucleotide acid metabolism process and gene expression, developmental processes such as mycelium development, and probably secondary metabolite-related processes (middle panel in Figure 4). This might suggest that evolution of fungal species should involve expansion in metabolic capacities and gene expression regulation that are likely to be linked to fungal-specific developmental program. However, in orphan gene group, there is no enrichment of particular GO terms except single-organism process (note that p-value is greater than 0.01 in all cases but one), since orphan genes are usually lacking functional domain structures and rarely characterized so far, making it difficult for us to judge significance of our observation (bottom panel in Figure 4).
3.5. Analysis of orphan genes in fungal pathogenesis
Most of published molecular genetics studies on pathogenicity genes in M. oryzae took reverse genetics approaches, where genes of well-characterized orthologs in other organisms are identified from M. oryzae genome and analyzed in the context of fungal development and pathogenesis (Figure 3 in Supplementary Material). As a result, orphan genes are rarely studied to date, although they accounts for considerable portion of current genome annotation. The fact that such biases are evident even in large-scale forward genetics studies (such as Agrobacterium tumefaciens-mediated transformation (ATMT) project) [33] suggests either that orphan genes are not actually genes encoding functional proteins or that lack of protein products encoded by orphan genes has negligible effects on overall fungal fitness. To eliminate the first possibility, we took advantage of some proteomic data that are publicly available [34–37]. For translational evidence, we combined and used these multiple published proteomics data. For transcriptional evidence, we used RNA-seq data generated for mycelia tissue [22]. When we screened for orphan genes having translational evidences, we found seven genes from our orphan gene list (Table 3 in Supplementary Material). Five among these seven genes showed no or little transcription in mycelia tissue (Table 4 in Supplementary Material), which is consistent with their translational evidences being found in germinating conidia.
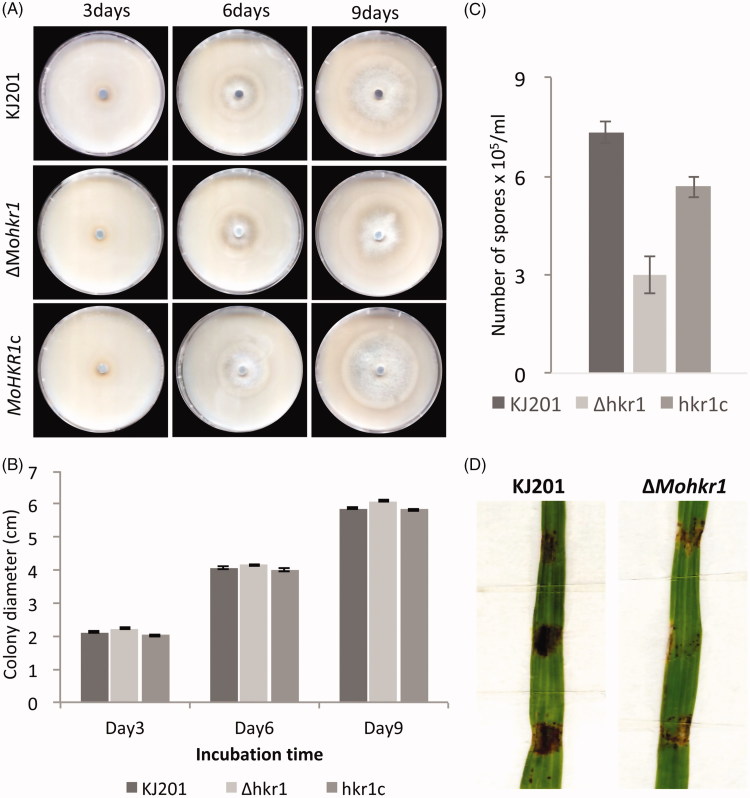
To delve into their roles during fungal development and pathogenesis, we attempted targeted gene knockout approach for all seven genes. For only four genes, however, we were able to successfully construct knockout vector and obtain candidate knockout mutants (data not shown). Subsequent phenotype screening revealed that deletion of one gene, which we designated MoHKR1, could cause detectable phenotypic changes. Although ΔMohkr1 was comparable to the wild-type in radial growth Figure 5(A) and 5(B), the mutant was not able to produce as many conidia as the wild-type counterpart Figure 5(C) and was much less virulent on its host plant, rice Figure 5(D). Such defects could be complemented by introduction of wild-type copy of gene back into the mutant. To the best of our knowledge, this is the first report showing involvement of orphan genes in fungal pathogenesis. These data suggest that at least some orphan genes are likely to be bona fide protein-coding genes playing important, lineage-specific roles in the rice blast fungus.
Figure 5.
Characterization of an orphan gene, MoHKR1 using gene knockout approach. (A) Comparison of vegetative growth among strains on oatmeal agar plates. (B) Bar graph showing colony diameter at 3-, 6-, and 9-day post inoculation. (C) Asexual reproduction of different strains measured by number of spores produced on oatmeal agar cultures. (D) Representative image of pathogenicity assay results. Pathogenicity assay was carried out by placing agar blocks containing fungal cultures on susceptible rice cultivar Nagdongbyeo.
3.6. Concluding remarks
In this study, we categorized entire genome into discrete classes, depending on their estimated emergence time. One major concern in our analysis is whether BLASTP is sensitive enough to detect most remote homologues. However, a previous study examining capacity of BLAST through simulation to detect proteins of diverse evolutionary rates showed that BLAST only misses homologues of extremely fast-evolving sequences [24]. Therefore, it is reasonable to assume that BLAST would not produce a particular bias toward certain phylostrata.
Our data suggested that emergence time of genes over evolutionary time scale is associated with physical and functional features of the genes. We argue that this type of analysis could be a potentially powerful tool to provide evolutionary insights into genetic basis of a particular trait such as fungal pathogenesis. Although studies of fungal pathogenesis so far are biased toward highly conserved genes, other data suggest ancient origin of gene functions involved in fungal development and pathogenesis. At the same time, our study illuminates the importance of monitoring new genes (orphan genes) in predicting evolutionary trajectory of fungal pathogenesis.
Supplementary Material
Funding Statement
This work was supported by 2016 Yeungnam University Research Grant.
Disclosure statement
No potential conflict of interest was reported by the authors.
References
- 1.Talbot NJ. On the trail of a cereal killer: exploring the biology of Magnaporthe grisea. Annu Rev Microbiol. 2003;57:177–202. [DOI] [PubMed] [Google Scholar]
- 2.Dean R, Van Kan JA, Pretorius ZA, et al. The top 10 fungal pathogens in molecular plant pathology. Mol Plant Pathol. 2012;13:414–430. [DOI] [PMC free article] [PubMed] [Google Scholar]
- 3.Wilson RA, Talbot NJ. Under pressure: investigating the biology of plant infection by Magnaporthe oryzae. Nat Rev Micro. 2009;7:185–195. [DOI] [PubMed] [Google Scholar]
- 4.Howard RJ, Valent B. Breaking and entering: host penetration by the fungal rice blast pathogen Magnaporthe grisea. Annu Rev Microbiol. 1996;50:491–512. [DOI] [PubMed] [Google Scholar]
- 5.Kankanala P, Czymmek K, Valent B. Roles for rice membrane dynamics and plasmodesmata during biotrophic invasion by the blast fungus. Plant Cell. 2007;19:706–724. [DOI] [PMC free article] [PubMed] [Google Scholar]
- 6.Gladieux P, Condon B, Ravel S, et al. Gene flow between divergent cereal- and grass-specific lineages of the rice blast fungus Magnaporthe oryzae. mBio. 2018;9:e01219–17. [DOI] [PMC free article] [PubMed] [Google Scholar]
- 7.Xue M, Yang J, Li Z, et al. Comparative analysis of the genomes of two field isolates of the rice blast fungus Magnaporthe oryzae. PLoS Genet. 2012;8:e1002869. [DOI] [PMC free article] [PubMed] [Google Scholar]
- 8.Urban M, Cuzick A, Rutherford K, et al. PHI-base: a new interface and further additions for the multi-species pathogen-host interactions database. Nucleic Acids Res. 2017;45:D604–DD10. [DOI] [PMC free article] [PubMed] [Google Scholar]
- 9.Urban M, Irvine AG, Cuzick A, et al. Using the pathogen-host interactions database (PHI-base) to investigate plant pathogen genomes and genes implicated in virulence. Front Plant Sci. 2015;6:605. [DOI] [PMC free article] [PubMed] [Google Scholar]
- 10.Domazet-Lošo T, Brajković J, Tautz D. A phylostratigraphy approach to uncover the genomic history of major adaptations in metazoan lineages. Trends Genet. 2007;23:533–539. [DOI] [PubMed] [Google Scholar]
- 11.Neme R, Tautz D. Phylogenetic patterns of emergence of new genes support a model of frequent de novo evolution. BMC Genomics. 2013;14:117. [DOI] [PMC free article] [PubMed] [Google Scholar]
- 12.Domazet-Loso T, Tautz D. Phylostratigraphic tracking of cancer genes suggests a link to the emergence of multicellularity in metazoa. BMC Biol. 2010;8:66. [DOI] [PMC free article] [PubMed] [Google Scholar]
- 13.Moyers BA, Zhang J. Evaluating phylostratigraphic evidence for widespread De Novo gene birth in genome evolution. Mol Biol Evol. 2016;33:1245–1256. [DOI] [PMC free article] [PubMed] [Google Scholar]
- 14.Sipos G, Prasanna AN, Walter MC, et al. Genome expansion and lineage-specific genetic innovations in the forest pathogenic fungi Armillaria. Nat Ecol Evol. 2017;1:1931–1941. [DOI] [PubMed] [Google Scholar]
- 15.Conant GC, Wolfe KH. Turning a hobby into a job: How duplicated genes find new functions. Nat Rev Genet. 2008;9:938–950. [DOI] [PubMed] [Google Scholar]
- 16.Tautz D, Domazet-Loso T. The evolutionary origin of orphan genes. Nat Rev Genet. 2011;12:692–702. [DOI] [PubMed] [Google Scholar]
- 17.Domazet-Loso T, Tautz D. An evolutionary analysis of orphan genes in Drosophila. Genome Res. 2003;13:2213–2219. [DOI] [PMC free article] [PubMed] [Google Scholar]
- 18.Grigoriev IV, Nikitin R, Haridas S, et al. MycoCosm portal: gearing up for 1000 fungal genomes. Nucl Acids Res. 2014;42:D699–D704. [DOI] [PMC free article] [PubMed] [Google Scholar]
- 19.Altschul SF, Gish W, Miller W, et al. Basic local alignment search tool. J Mol Biol. 1990;215:403–410. [DOI] [PubMed] [Google Scholar]
- 20.Coordinators NR. Database resources of the National Center for Biotechnology Information. Nucleic Acids Res. 2018;46:D8–D13. [DOI] [PMC free article] [PubMed] [Google Scholar]
- 21.Team RC. R: A language and environment for statistical computing. Vienna: R Foundation for Statistical Computing; 2015. [Google Scholar]
- 22.Jeon J, Choi J, Lee GW, et al. Genome-wide profiling of DNA methylation provides insights into epigenetic regulation of fungal development in a plant pathogenic fungus. Magnaporthe oryzae. Sci Rep. 2015;5:8567. [DOI] [PMC free article] [PubMed] [Google Scholar]
- 23.Choi J, Park J, Kim D, et al. Fungal secretome database: integrated platform for annotation of fungal secretomes. BMC Genomics. 2010;11:105. [DOI] [PMC free article] [PubMed] [Google Scholar]
- 24.Alba MM, Castresana J. On homology searches by protein blast and the characterization of the age of genes. BMC Evol Biol. 2007;7:53. [DOI] [PMC free article] [PubMed] [Google Scholar]
- 25.Postberg J, Forcob S, Chang WJ, et al. The evolutionary history of histone H3 suggests a deep eukaryotic root of chromatin modifying mechanisms. BMC Evol Biol. 2010;10:259. [DOI] [PMC free article] [PubMed] [Google Scholar]
- 26.Brosch G, Loidl P, Graessle S. Histone modifications and chromatin dynamics: a focus on filamentous fungi. FEMS Microbiol Rev. 2008;32:409–439. [DOI] [PMC free article] [PubMed] [Google Scholar]
- 27.Chi MH, Park SY, Kim S, et al. A novel pathogenicity gene is required in the rice blast fungus to suppress the basal defenses of the host. PLoS Pathog. 2009;5:e1000401. [DOI] [PMC free article] [PubMed] [Google Scholar]
- 28.Okagaki LH, Nunes CC, Sailsbery J, et al. Genome sequences of three phytopathogenic species of the Magnaporthaceae family of fungi. G3 (Bethesda). 2015;5:2539–2545. [DOI] [PMC free article] [PubMed] [Google Scholar]
- 29.Sadat A, Jeon J, Mir AA, et al. Analysis of in planta expressed orphan genes in the rice blast fungus Magnaporthe oryzae. Plant Pathol J. 2014;30:367–374. [DOI] [PMC free article] [PubMed] [Google Scholar]
- 30.Park J, Park B, Jung K, et al. CFGP: a web-based, comparative fungal genomics platform. Nucleic Acids Res. 2007;36:D562–D571. [DOI] [PMC free article] [PubMed] [Google Scholar]
- 31.Kim KT, Jeon J, Choi J, et al. Kingdom-wide analysis of fungal small secreted proteins (SSPs) reveals their potential role in host association. Front Plant Sci. 2016;7:186. [DOI] [PMC free article] [PubMed] [Google Scholar]
- 32.Fox JM, Erill I. Relative codon adaptation: a generic codon bias index for prediction of gene expression. DNA Res. 2010;17:185–196. [DOI] [PMC free article] [PubMed] [Google Scholar]
- 33.Jeon J, Park SY, Chi MH, et al. Genome-wide functional analysis of pathogenicity genes in the rice blast fungus. Nat Genet. 2007;39:561–565. [DOI] [PubMed] [Google Scholar]
- 34.Franck WL, Gokce E, Oh Y, et al. Temporal analysis of the Magnaporthe oryzae proteome during conidial germination and cyclic AMP (cAMP)-mediated appressorium formation. Mol Cell Proteomics. 2013;12:2249–2265. [DOI] [PMC free article] [PubMed] [Google Scholar]
- 35.Gokce E, Franck WL, Oh Y, et al. In-depth analysis of the Magnaporthe oryzae conidial proteome. J Proteome Res. 2012;11:5827–5835. [DOI] [PMC free article] [PubMed] [Google Scholar]
- 36.Kim ST, Yu S, Kim SG, et al. Proteome analysis of rice blast fungus (Magnaporthe grisea) proteome during appressorium formation. Proteomics. 2004;4:3579–3587. [DOI] [PubMed] [Google Scholar]
- 37.Bhadauria V, Wang LX, Peng YL. Proteomic changes associated with deletion of the Magnaporthe oryzae conidial morphology-regulating gene COM1. Biol Direct. 2010;5:61. [DOI] [PMC free article] [PubMed] [Google Scholar]
Associated Data
This section collects any data citations, data availability statements, or supplementary materials included in this article.


