

Abstract
Aims/Introduction
Older people with diabetes mellitus are at high risk for cognitive impairment or dementia. The clinical predictors for cognitive decline in older people with diabetes mellitus were elucidated.
Materials and Methods
This was a secondary analysis of a vitamin B12 intervention trial in older people with diabetes mellitus. A total of 271 non‐demented individuals were followed up at 9‐month intervals for 27 months. We explored the association between baseline clinical features with changes in cognitive measures (Clinical Dementia Rating scale, Neuropsychological Test Battery including executive function z‐scores, psychomotor speed z‐scores and memory z‐scores).
Results
A total of 152 participants had normal cognition (Clinical Dementia Rating 0) and 119 had cognitive impairment (Clinical Dementia Rating 0.5) at baseline. After 27 months, 41 participants had cognitive decline, 36 of whom were cognitively normal at baseline. Multiple logistic regression showed no significant clinical predictor of global cognitive decline. Higher high‐density lipoprotein cholesterol (HDL‐C) was associated with better executive performance at month 27 (β = 0.359, P < 0.001). Multilevel modeling showed that the highest tertile of HDL‐C was associated with better executive function z‐scores than the lowest tertile of HDL‐C at all time‐points.
Conclusions
Among older people with diabetes mellitus, higher serum HDL‐C was associated with better executive function.
Keywords: Cognitive function, Diabetes mellitus, High‐density lipoprotein cholesterol
Introduction
Older people with diabetes mellitus, have an approximately 1.5‐ to twofold‐increased risk of cognitive impairment and dementia1. Given the high prevalence of diabetes mellitus in older people, the identification of potentially modifiable risk factors of cognitive decline in this high‐risk group is important. The mechanisms underlying progressive cognitive deficits are likely to be multifactorial, as diabetes mellitus is associated with cardiovascular disease, white matter brain changes and Alzheimer's disease2.
Furthermore, hypoglycemia is associated with an increased risk of cognitive decline and dementia in patients with diabetes mellitus. In a cross‐sectional study of >1,000 patients, a self‐reported history of severe hypoglycemia was significantly associated with worse later‐life cognitive function independent of initial cognitive function3. Another prospective study of >16,000 older adults with diabetes mellitus also suggested that the accumulation of severe hypoglycemic events over the preceding 20 years was significantly associated with a greater risk of dementia4. The effect of repeated hypoglycemia episodes on the development of cognitive decline is due to neuronal loss as a result of an impaired fuel supply5.
Dyslipidemia has been shown to have a strong additive influence on the cognitive performance of patients with Alzheimer's disease6. Diabetes mellitus is related with microvascular complications, including nephropathy. Kidney dysfunction has been found to be associated with more rapid decline in performance in domains of attention and processing speed7. Diabetes mellitus is also associated with clinical stroke, white matter disease and asymptomatic cerebral infarctions, which could affect cognitive functions in older people with diabetes mellitus8.
Therefore, we explored clinical factors associated with global cognitive deficit and specific cognitive domains at the 27‐month follow up among older people with diabetes mellitus.
Methods
The sample was drawn from existing data of a randomized trial of vitamin B12 supplementation, who were administered the cognitive functional tests at baseline and at 9‐month intervals until month 279. This trial showed no significant effect of vitamin B12 supplementation on cognitive decline. Hence, we carried out the secondary analysis to identify risk factors associated with cognitive function in this intervention trial and adjusted for treatment assignment.
A total of 271 participants with type 2 diabetes mellitus aged >70 years were recruited in Hong Kong from August 2011 to September 2013. Details of sampling procedures and collection methods of the original sample have been described previously9. In brief, all the participants with borderline low vitamin B12 (150–300 pmol/L) were screened in the research clinic at the Prince of Wales Hospital and seven family medicine/general outpatient clinics in the New Territories East cluster in Hong Kong. Exclusion criteria included: (i) individuals with a clinical diagnosis of dementia, peripheral neuropathy, anemia, disabling stroke, renal failure or clinical depression; (ii) individuals taking vitamin B12 supplementation or centrally‐acting medications; and (iii) individuals without a family member who could reliably inform on cognitive functioning. At entry, all study participants attended the research clinic for extensive physical and cognitive function assessment, and every 9 months they came back to attend these examinations until 27 months. A total of 234 participants (86.4%) completed the follow up.
After having obtained written consent from participants, all of the participants had the following measurements:
Blood samples were taken after an overnight fast. The blood was analyzed for glycosylated hemoglobin, creatinine and low‐density lipoprotein cholesterol, total cholesterol, high‐density lipoprotein cholesterol (HDL‐C), non‐HDL‐C and triglycerides. Apolipoprotein E genotyping was also analyzed from ethylenediaminetetraacetic acid blood samples.
All basic information of participants was collected at baseline by questionnaires that included: demographic information, education years, smoking status, medical diagnoses and medication. Additionally, a history of hypoglycemia was assessed by self‐report (frequency in recent 1 month), and duration of diabetes mellitus was recorded.
Neuropsychological tests. (i) Chinese Mini‐Mental State Examination – the version has been validated suitably for individuals in Hong Kong and the total score is 30. (ii) Clinical Dementia Rating scale (CDR) – a numeric scale used to rate the severity of symptoms of dementia and reflecting a clinical impression of global cognitive and functional impairment. It is a well‐structured interview‐based test. Besides an interview with a patient, a caregiver who has regular personal contact with the patient also completes the CDR rating ranges from 0 (normal) to 3 (severe dementia). A CDR score of 0 indicates normal cognition, 0.5 indicates ‘questionable dementia’ or mild cognitive impairment and a score of ≥1 might indicate ‘clinical dementia.’ All the participants were divided into two groups based on their CDR global scores at baseline, and participants with CDR global scores of 0 were defined as the cognitively normal group, whereas the participants with CDR global scores of ≥0.5 were the mild cognitive impairment group. Cognitive decline was defined as any increase in CDR global score at 27‐month follow up. (iii) Neuropsychological Test Battery (NTB) – the cognitive test battery was chosen for specific assessments10. The tests included: Controlled Oral Word Association Test and the Category Fluency Test (to name animals, vegetables and fruits in 1 min each), International Shopping List Test, ‘Detection’ (a test of simple reaction time) and ‘Identification’ (a choice reaction time test) and Continuous Paired Associates Learning. The selected assessments were carried out face‐to‐face by well‐trained research assistant using a touch‐screen portable computer. From these tests, composite cognitive function scores were formed to represent three cognitive domains (executive function, psychomotor speed and memory), raw scores from the cognitive tests were converted to z‐scores; (value − mean at baseline)/standard deviation at baseline was used to compute the z‐scores, with higher z‐scores indicating better performance. (iv) Geriatric Depression Scale – it contains 15 items with a score of ≥8 indicating depression. The version has been validated in the Hong Kong population.
Statistical analysis
The primary outcome was change in CDR global score, and the secondary outcomes were NTB domain z‐scores. Continuous variables were presented as the mean (standard deviation) and prevalence (percentage), as appropriate, then compared by using independent samples t‐test or the χ2‐test. Binomial logistic regression was carried out to examine predictors for CDR changes. All clinically plausible variables with P < 0.20 in the respective bivariate analyses were considered for the models. As the current study was based on a previous vitamin B12 supplementation randomized placebo trial, the effect of treatment assignment would be taken into consideration in all models.
The partial correlation coefficient was used to identify the biomarkers related to z‐scores of domain performance in NTB at month 27 with correction for age and sex. Significant correlations (P < 0.05) were reported. Then, the linear regression model was carried out to investigate the association between significant factors and z‐score in the NTB domain after adjustment for age, sex, education level, treatment assignment and corresponding baseline z‐score. All the analysis were carried out with SPSS software (IBM SPSS Statistics version 24.0; IBM Corporation, Armonk, NY, USA).
Results
Table 1 summarizes the baseline characteristics of the participants. A total of 271 older people aged 69–85 years were included. Majority of participants (77.49%) had diabetes mellitus for >10 years. More than half of the participants (56%) had a CDR score of 0 at baseline. The cognitive impaired group had received less education and had a higher proportion of women, stroke patients and smokers than the normal cognition group.
Table 1.
Clinical characteristics of all trial participants at baseline
| Normal (n = 152) | MCI (n = 119) | P | |||
|---|---|---|---|---|---|
| Mean | SD | Mean | SD | ||
| Age (years) | 74.91 | 3.88 | 75.55 | 4.23 | 0.196 |
| Education (years) | 6.98 | 4.62 | 4.13 | 3.81 | <0.001 |
| HbA1c (%) | 7.1 | 0.9 | 7.2 | 0.9 | 0.485 |
| Creatinine (μmol/L) | 91.63 | 25.14 | 87.44 | 24.83 | 0.172 |
| HDL (mmol/L) | 1.30 | 0.33 | 1.28 | 0.31 | 0.507 |
| LDL (mmol/L) | 2.33 | 0.69 | 2.32 | 0.67 | 0.937 |
| Total‐C (mmol/L) | 4.24 | 0.86 | 4.25 | 0.74 | 0.961 |
| Non‐HDL (mmol/L) | 2.91 | 0.82 | 2.97 | 0.76 | 0.598 |
| Triglyceride (g/L) | 1.37 | 0.87 | 1.45 | 0.76 | 0.456 |
| Hemoglobin (g/dL) | 13.28 | 1.16 | 12.90 | 1.39 | 0.016 |
| Urine albu:creat | 14.92 | 34.92 | 15.23 | 26.88 | 0.949 |
| MCV (fL) | 90.33 | 7.16 | 89.41 | 7.55 | 0.316 |
| MMSE (max 30) | 27.14 | 2.28 | 22.89 | 3.51 | <0.001 |
| GDS (max 15) | 2.91 | 2.15 | 3.99 | 2.38 | <0.001 |
| NTB† | |||||
| Executive function | 0.28 | 0.83 | –0.39 | 0.73 | <0.001 |
| Psychomotor speed | 0.16 | 0.89 | –0.10 | 0.83 | 0.023 |
| Memory | 0.23 | 0.79 | –0.28 | 0.73 | <0.001 |
| n | % | n | % | ||
|---|---|---|---|---|---|
| Hypertension | 129 | 84.9 | 104 | 87.4 | 0.552 |
| Stroke | 6 | 3.9 | 12 | 10.1 | 0.044 |
| Smoker | 8 | 6 | 10 | 10.5 | 0.090 |
| APOE4‡ | 19 | 12.5 | 19 | 16.1 | 0.358 |
| APOE3/3 | 99 | 65.1 | 79 | 66.9 | 0.671 |
| Drug use | |||||
| Aspirin | 32 | 21.1 | 35 | 29.4 | 0.113 |
| Insulin | 24 | 15.8 | 15 | 12.6 | 0.459 |
| Metformin | 125 | 82.2 | 102 | 85.7 | 0.441 |
| Statin | 76 | 50 | 70 | 58.8 | 0.148 |
| ACEI/ARB | 116 | 76.8 | 92 | 77.3 | 0.920 |
| Female | 46 | 30.2 | 67 | 56.3 | <0.001 |
| Supplement group | 76 | 50 | 61 | 51.3 | 0.903 |
| DM duration ≥10 years | 114 | 75 | 96 | 80.7 | 0.151 |
| Hypoglycemia | 25 | 16.4 | 14 | 11.8 | 0.280 |
| Hospital admission for hypoglycemia | 3 | 2.0 | 6 | 5.0 | 0.159 |
†The z‐scores as compared with the mean of all participants; higher scores indicating better performance. ‡One copy. ACEI, angiotensin‐converting enzyme inhibitor; albu:creat, albumin (g) and creatinine (μmol/L) ratio; ApoE, apolipoprotein E; ARB, angiotensin receptor blocker; DM, diabetes mellitus; GDS, Geriatric Depression Scale; HbA1c, glycosylated hemoglobin; HDL, high‐density lipoprotein; LDL, low‐density lipoprotein; max, maximum; MCI, mild cognitive impaired (Clinical Dementia Rating scale score 0.5); MCV, mean corpuscular volume; MMSE, Mini‐Mental State Examination; Non‐HDL, non‐high‐density lipoprotein; NTB, Neuropsychological Test Battery; SD, standard deviation; Total‐C, total cholesterol.
A total of 41 (15%) participants had an increase in the CDR global score at month 27. Among these participants, five had cognitive impairment at baseline. In contrast, among non‐decliners, 16 participants' CDR global score decreased (improved) at month 27. Table 2 compares clinical characteristics among decliners and non‐decliners. Variables associated with an increase in CDR global score in the univariate analysis were being male, and having higher serum creatinine and a higher Mini‐Mental State Examination score. Use of statins, angiotensin‐converting enzyme inhibitor/angiotensin receptor blocker, insulin, metformin, duration of diabetes mellitus and hypoglycemia frequency were not significantly different between the two groups.
Table 2.
Comparisons of cognitive decliners and non‐decliners according to Clinical Dementia Rating scale global score
| Decliners (n = 41) | Non‐decliners (n = 202) | P | |||
|---|---|---|---|---|---|
| Mean | SD | Mean | SD | ||
| Age (years) | 76.41 | 4.20 | 74.93 | 3.98 | 0.032 |
| Education (years) | 6.75 | 4.97 | 5.89 | 4.41 | 0.264 |
| HbA1c, mmol/mol (%) | 78 (7.1) | 12 (1.1) | 77 (7.1) | 10 (0.9) | 0.593 |
| Creatinine (μmol/L) | 97.39 | 24.06 | 87.74 | 24.95 | 0.024 |
| Urine albu:creat | 16.09 | 36.76 | 13.88 | 26.64 | 0.712 |
| HDL (mmol/L) | 1.28 | 0.32 | 1.30 | 0.32 | 0.624 |
| LDL (mmol/L) | 2.29 | 0.89 | 2.33 | 0.64 | 0.686 |
| Total‐C (mmol/L) | 4.18 | 1.09 | 4.27 | 0.76 | 0.526 |
| Non‐HDL (mmol/L) | 2.89 | 1.14 | 2.94 | 0.71 | 0.740 |
| Triglyceride (g/L) | 1.37 | 0.83 | 1.41 | 0.83 | 0.737 |
| Hemoglobin (g/dL) | 12.97 | 1.34 | 13.17 | 1.25 | 0.342 |
| MCV (fL) | 90.66 | 6.11 | 90.06 | 7.67 | 0.641 |
| MMSE (max 30) | 26.56 | 2.69 | 25.25 | 3.65 | 0.030 |
| GDS (max 15) | 3.00 | 1.73 | 3.41 | 2.41 | 0.301 |
| NTB† | |||||
| Executive function | −0.001 | 0.88 | 0.004§ | 0.85 | 0.768 |
| Psychomotor speed | −0.007¶ | 0.89 | 0.041†† | 0.88 | 0.311 |
| Memory | 0.029‡‡ | 0.82 | 0.002§§ | 0.79 | 0.809 |
| Total | 0.119 | 0.56 | 0.06 | 0.64 | 0.935 |
| n | % | n | % | ||
|---|---|---|---|---|---|
| Hypertension | 37 | 90.2 | 170 | 84.2 | 0.317 |
| Stroke | 3 | 7.31 | 13 | 6.44 | 0.836 |
| Smoker | 2 | 5.0 | 16 | 8.56 | 0.058 |
| APOE4‡ | 6 | 14.63 | 28 | 13.93 | 0.906 |
| APOE3/3 | 28 | 68.3 | 129 | 64.2 | 0.615 |
| Drug use | |||||
| Aspirin | 8 | 19.5 | 54 | 26.7 | 0.334 |
| Insulin | 1 | 2.43 | 25 | 12.4 | 0.177 |
| Metformin | 37 | 90.2 | 66 | 32.7 | 0.204 |
| Statin | 20 | 48.8 | 111 | 54.9 | 0.407 |
| ACEI/ARB | 23 | 56.1 | 122 | 60.39 | 0.609 |
| Female | 11 | 26.8 | 87 | 43.1 | 0.053 |
| Supplement group | 23 | 56.1 | 99 | 49 | 0.408 |
| DM duration ≥10 years | 33 | 80.5 | 156 | 77.2 | 0.560 |
| Hypoglycemia | 8 | 19.5 | 30 | 14.85 | 0.445 |
| Hospital admission for hypoglycemia | 1 | 2.4 | 8 | 4.0 | 0.641 |
†The z‐scores as compared with the mean of all participants; higher scores indicating better performance. ‡One copy. § n = 195 participants; ¶ n = 36 participants; †† n = 181 participants; ‡‡ n = 39 participants; §§ n = 192 participants. ACEI, angiotensin‐converting enzyme inhibitor; albu:creat, albumin (g) and creatinine (μmol/L) ratio; ApoE, apolipoprotein E; ARB, angiotensin receptor blocker; DM, diabetes mellitus; GDS, Geriatric Depression Scale; HbA1c, glycosylated hemoglobin; HDL, high‐density lipoprotein; LDL, low‐density lipoprotein; max, maximum; MCI, mild cognitive impaired (Clinical Dementia Rating scale score 0.5); MCV, mean corpuscular volume; MMSE, Mini‐Mental State Examination; Non‐HDL, non‐high‐density lipoprotein; NTB, Neuropsychological Test Battery; Total‐C, total cholesterol.
Multiple logistic regression models were used to detect predictors of cognitive decline, and all clinically plausible variables with P < 0.2 in the univariate analyses were included in the model; that is, age, creatinine, smoking status, insulin treatment and sex (shown in Table 2). Mini‐Mental State Examination was not included in the model, as its strong correlation with cognitive decline without dementia and randomization was included in model. None of these factors were significantly associated with cognitive decline.
Partial correlation analysis showed that serum HDL‐C level was associated with executive function at month 27 (correlation coefficient 0.248, P < 0.001). No clinical factors correlated significantly with psychomotor speed and memory (shown in Table S1). A linear regression model was used to investigate the association between HDL‐C level and executive function at month 27 with correction for age, sex, education years, trial group assignment and baseline executive function. HDL‐C was positively associated with executive function at month 27 (β = 0.359, P < 0.001, 95% confidence interval 0.236–0.483). With further correction for the use of statin, HDL‐C was still significantly associated with executive function at month 27 (β = 0.366, P = 0.004, 95% confidence interval 0.116–0.616). On multilevel modeling of executive function at all time‐points, the highest tertile of the HDL‐C group had better executive function than the lowest tertile of the HDL‐C group after adjustment for age, sex, education and trial group assignment (Table 3; Figure 1). Time did not have an interaction effect on the association of the HDL‐C group with executive function (P = 0.963). The clinical characteristics of the participants in the tertiles of serum HDL‐C are shown in Table 4. Serum total cholesterol levels and triglyceride were significantly higher, whereas non HDL‐C levels were significantly decreased in the upper tertile of serum HDL‐C. In addition, the upper tertile of serum HDL‐C included a higher proportion of women. There were no significant differences in other clinical characteristics.
Table 3.
Comparisons of executive function between HDL‐C tertiles at follow up
| Baseline | 9‐month follow up | 18‐month follow up | 27‐month follow up | |
|---|---|---|---|---|
| Lowest tertile | −0.01 (0.83) | −0.01 (0.89) | −0.09 (0.80) | 0.04 (0.87) |
| Middle tertile | −0.11 (0.78) | −0.10 (0.87) | −0.01 (1.02) | −0.01 (0.82) |
| Highest tertile | 0.16* (0.93) | 0.18* (0.96) | 0.18** (0.96) | 0.33** (1.01) |
Data presented as mean (standard deviation) of z‐scores. *,**Significantly different from the lowest tertile, P < 0.05 and P < 0.01, respectively.
Figure 1.
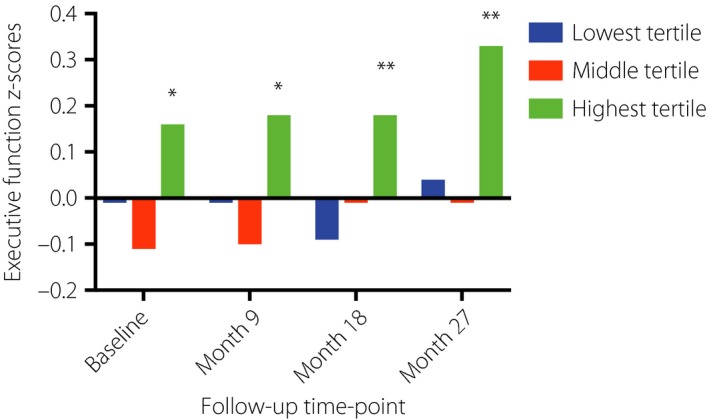
Comparisons of executive function among high‐density lipoprotein cholesterol tertiles at all time‐points. *,**Significantly different from the lowest tertile, P < 0.05 and P < 0.01, respectively.
Table 4.
Clinical characteristics of the participants in the tertiles of serum high‐density lipoprotein cholesterol
| Lowest tertile | Middle tertile | Upper tertile | P | ||||
|---|---|---|---|---|---|---|---|
| Mean | SD | Mean | SD | Mean | SD | ||
| Age (years) | 75.40 | 4.19 | 75.67 | 4.01 | 74.83 | 4.00 | 0.445 |
| Education (years) | 6.77 | 4.22 | 5.53 | 4.98 | 5.29 | 4.07 | 0.067 |
| HbA1c (%) | 7.21 | 1.04 | 7.04 | 0.79 | 7.00 | 0.94 | 0.313 |
| Creatinine (μmol/L) | 97.09 | 24.69 | 84.94 | 23.96 | 85.65 | 26.90 | 0.213 |
| LDL (mmol/L) | 2.37 | 0.72 | 2.32 | 0.60 | 2.27 | 0.72 | 0.648 |
| Total‐C (mmol/L) | 4.09 | 0.82 | 4.23 | 0.77 | 4.46 | 0.80 | 0.013* |
| Non‐HDL (mmol/L) | 3.10 | 0.82 | 2.97 | 0.63 | 2.70 | 0.85 | 0.010* |
| Triglyceride (g/L) | 1.61 | 0.81 | 1.42 | 1.01 | 1.11 | 0.46 | <0.001* |
| Hemoglobin (g/dL) | 13.47 | 1.30 | 12.82 | 1.25 | 13.09 | 1.21 | 0.312 |
| Urine albu:creat | 16.82 | 32.52 | 20.65 | 41.30 | 8.30 | 17.62 | 0.165 |
| MCV (fL) | 90.32 | 6.35 | 89.08 | 8.26 | 90.59 | 7.35 | 0.396 |
| MMSE (max 30) | 25.99 | 3.02 | 24.95 | 3.78 | 24.82 | 3.82 | 0.059 |
| GDS (max 15) | 3.82 | 2.25 | 3.23 | 2.24 | 3.19 | 2.32 | 0.426 |
| Hypertension | 82 | 87.23 | 70 | 89.74 | 56 | 78.87 | 0.143 |
| Stroke | 8 | 8.51 | 5 | 6.41 | 2 | 2.82 | 0.321 |
| Smoker | 10 | 10.64 | 3 | 3.85 | 5 | 7.04 | 0.131 |
| APOE4† | 19 | 20.21 | 7 | 8.97 | 7 | 9.86 | 0.059 |
| APOE3/3 | 64 | 68.09 | 54 | 69.23 | 41 | 57.75 | 0.458 |
| Drug use | |||||||
| Aspirin | 25 | 26.60 | 21 | 26.92 | 15 | 21.13 | 0.655 |
| Insulin | 10 | 10.64 | 9 | 11.54 | 7 | 9.86 | 0.946 |
| Metformin | 75 | 79.79 | 69 | 88.46 | 60 | 84.51 | 0.301 |
| Statin | 49 | 52.13 | 45 | 57.69 | 40 | 56.34 | 0.744 |
| ACEI/ARB | 57 | 60.64 | 50 | 64.10 | 39 | 54.93 | 0.505 |
| Female | 18 | 19.15 | 36 | 46.15 | 41 | 57.75 | <0.001* |
| Supplement group | 48 | 51.06 | 37 | 47.44 | 36 | 50.70 | 0.879 |
*Comparison between the highest and lowest tertiles, P < 0.05. †One copy. ACEI, angiotensin‐converting enzyme inhibitor; albu:creat, albumin (g) and creatinine (μmol/L) ratio; ApoE, apolipoprotein E; ARB, angiotensin receptor blocker; DM, diabetes mellitus; GDS, Geriatric Depression Scale; HbA1c, glycosylated hemoglobin; HDL, high‐density lipoprotein; LDL, low‐density lipoprotein; max, maximum; MCI, mild cognitive impaired (Clinical Dementia Rating scale score 0.5); MCV, mean corpuscular volume; MMSE, Mini‐Mental State Examination; Non‐HDL, non‐high‐density lipoprotein; NTB, Neuropsychological Test Battery; SD, standard deviation; Total‐C, total cholesterol.
Discussion
The present study could not identify any clinical risk factor for global cognitive decline in older people with diabetes mellitus, except that lower serum HDL‐C was significantly associated with worse executive function after adjustments for confounders.
During the 27‐month observational period in this study, 15% of participants experienced cognitive decline. This contrasts with the 17% incidence in 1.6 years reported by Bruce et al.11 This might be attributed to optimal diabetes control in this group of patients. Although the majority of participants had diabetes mellitus for >10 years, most of them were treated with statin, metformin and angiotensin receptor blockers, which have been reported to be neuroprotective in people with diabetes mellitus11, 12, 13. In addition, the prevalence of diabetic complications was relatively low. One observational study in Japan reported that the existence of diabetic nephropathy, higher systolic blood pressure and higher serum triglycerides (or lower HDL‐C) were associated with cognitive decline after 6 years in participants with diabetes mellitus14. Another study found that a lower urinary albumin:creatinine ratio and use of angiotensin‐converting enzyme inhibitors or angiotensin receptor blockers were protective for cognitive decline in older people with diabetes mellitus11.
Serum creatinine was higher in the decliners, but the difference was not independent of confounders. Renal dysfunction, as indicated by reduced creatinine clearance or higher urinary albumin:creatinine ratio, has been shown to be associated with cognitive decline in older people15. This might be attributed to a higher prevalence of cerebral small vessel disease16, which contributes to cognitive impairment17. The use of angiotensin‐converting enzyme inhibitor/angiotensin receptor blocker and metformin did not show a significant effect on cognitive impairment, which might be due to the frequent use of these drugs among all the participants. In addition, hypoglycemia is also a possible contributor of cognitive impairment in older people with diabetes mellitus18. However, serious hypoglycemia was rarely reported in the present study.
None of the clinical features were associated with global cognitive decline, but we found a robust association between HDL‐C and executive function. This suggests that serum HDL‐C is specifically associated with executive function in older people with diabetes mellitus. A case–control study found a positive association between HDL‐C levels and executive function in the diabetic statin users, but not in non‐users19. A longitudinal study in France reported that lower HDL‐C was associated with an increased risk of cognitive decline in executive function and psychomotor speed in older men20. In the present study, the association between HDL‐C and executive function was independent of sex and statin use in older people with diabetes mellitus.
It has been well demonstrated that HDL‐C undergoes significant qualitative changes in diabetes mellitus, in both structure and function21. When dealing with HDL‐C and cognitive function, we should keep in mind that cholesterol exists in two independent pools, the central nervous system and peripheral circulation. HDL‐C has multiple important functions in the brain. HDL‐C dysfunction in the central nervous system can directly cause cognitive impairment22. Although it is generally thought that there is no net transfer of cholesterol from the periphery into the central nervous system because of the blood–brain barrier, plasma HDL can affect the blood–brain barrier through its effects on endothelial function23. In addition, some small particles of HDL‐C; for example apolipoprotein A‐1, can cross blood–brain barrier. Furthermore, the major protein component of plasma HDL‐C, apolipoprotein A‐I, has a role in Aβ clearance24, and the anti‐oxidant and anti‐inflammatory properties of apolipoprotein A‐I/HDL‐C have been shown to play a significant role in neuroprotection25. Furthermore, the association between HDL‐C levels and cognition could be attributed to the higher cardiovascular risk associated with lower HDL‐C26.
Executive function is a primary domain of cognition that involves a broad set of cognitive abilities, such as attention, working memory, organization and persistence, which are essential to complex, goal‐directed activities27. Many studies have linked executive function with the pre‐frontal cortex28. Furthermore, white matter hyperintensities, irrespective of location, are associated with reduced frontal lobe metabolism and executive dysfunction. Previous studies have found that executive deficits could adversely affect glycemic control, and poor glycemic control in turn impairs cognitive function in adults with diabetes mellitus29. Hence, the preservation of executive function is important for the prevention of diabetic complications and global cognitive function in the longer term.
Serum HDL‐C can be increased by lifestyle modification. A meta‐analysis of 25 studies reported a mean net change in serum HDL‐C level of 2.53 mg/dL (95% confidence interval 1.36–3.70) with exercise averaging 3.7 sessions per week and 40.5 min per session30. Furthermore, several trials showed that exercise training programs improved the qualitative aspects of HDL‐C31, 32, 33. Polyunsaturated and monounsaturated fats, such as olive oil and coconut oil, mainly affect HDL2‐C or HDL3‐C concentration34, whereas very high polyunsaturated:saturated fat ratios and extremely high intakes of linoleic acid could significantly change serum HDL‐C levels35, 36. In addition, studies of very low carbohydrate diets together with weight loss have shown a mean increase of 11% in serum HDL‐C level compared with low‐fat diets37. Overall, the dietary influence on serum HDL‐C level is therefore limited.
Nicotinic acid, statins, cholesteryl ester transfer protein inhibitors and fibrates are four classes of agents targeted at increasing HDL‐C levels38. Nicotinic acid and fibrates can reduce low‐density lipoprotein cholesterol by 5–25% and triglyceride by 20–50% simultaneously39, 40. Cholesteryl ester transfer protein inhibitors can inhibit transferring of cholesterol esters from HDL‐C to larger lipoproteins, which could significantly increase HDL‐C levels and reduce low‐density lipoprotein cholesterol levels41.
Serum HDL‐C is a crude marker of HDL‐C function. Further studies on the influence of specific measures of HDL‐C function; for example, cholesterol efflux capacity of HDL‐C on cognitive function in older people with diabetes mellitus, are warranted.
The strengths of the present study included detailed neurocognitive assessments that tapped a range of cognitive domains at multiple time‐points, and the comprehensiveness of clinical factors. There were limitations. First, causality cannot be inferred, as it was an observational study. Second, the patients in the present study were the participants of a clinical trial. They might have been more health conscious than older people with diabetes mellitus in the general population. Third, we did not have data on diet and physical activity, which might confound the results.
In summary, no significant clinical factor for cognitive decline in older people with diabetes mellitus was found in the present study. Higher serum HDL‐C levels were associated with better performance in executive function. Elucidation of the underlying mechanisms of this association might lead to effective prevention strategies to prevent cognitive decline in older people with diabetes mellitus.
Disclosure
The authors declare no conflict of interest.
Supporting information
Table S1 ¦ Partial correlation analysis between baseline characteristics and Neuropsychological Test Battery domain z‐scores
Acknowledgments
This study was supported by a General Research Grant from the Hong Kong Research Grant Council (CUHK468110). All authors have reviewed and approved the manuscript.
J Diabetes Investig 2019; 10: 139–146
References
- 1. Chen L, Magliano DJ, Zimmet PZ. The worldwide epidemiology of type 2 diabetes mellitus–present and future perspectives. Nat Rev Endocrinol 2011; 8: 228–236. [DOI] [PubMed] [Google Scholar]
- 2. Strachan MW, Reynolds RM, Marioni RE, et al Cognitive function, dementia and type 2 diabetes mellitus in the elderly. Nat Rev Endocrinol 2011; 7: 108–114. [DOI] [PubMed] [Google Scholar]
- 3. Aung PP, Strachan MW, Frier BM, et al Severe hypoglycaemia and late‐life cognitive ability in older people with Type 2 diabetes: the Edinburgh Type 2 Diabetes Study. Diabet Med 2012; 29: 328–336. [DOI] [PubMed] [Google Scholar]
- 4. Whitmer RA, Karter AJ, Yaffe K, et al Hypoglycemic episodes and risk of dementia in older patients with type 2 diabetes mellitus. JAMA 2009; 301: 1565–1572. [DOI] [PMC free article] [PubMed] [Google Scholar]
- 5. McNay EC, Cotero VE. Mini‐review: impact of recurrent hypoglycemia on cognitive and brain function. Physiol Behav 2010; 100: 234–238. [DOI] [PMC free article] [PubMed] [Google Scholar]
- 6. Blom K, Vaartjes I, Peters SA, et al The influence of vascular risk factors on cognitive decline in patients with Alzheimer's disease. Maturitas 2014; 79: 96–99. [DOI] [PubMed] [Google Scholar]
- 7. Lee S, Shimada H, Park H, et al The association between kidney function and cognitive decline in community‐dwelling, elderly Japanese people. J Am Med Dir Assoc 2015; 16: 349.e1–349.e5. [DOI] [PubMed] [Google Scholar]
- 8. Ryan JP, Fine DF, Rosano C, et al Type 2 diabetes and cognitive impairment: contributions from neuroimaging. J Geriatr Psychiatry Neurol 2014; 27: 47–55. [DOI] [PMC free article] [PubMed] [Google Scholar]
- 9. Kwok T, Lee J, Ma RC, et al A randomized placebo controlled trial of vitamin B12 supplementation to prevent cognitive decline in older diabetic people with borderline low serum vitamin B12. Clin Nutr 2017; 36: 1509–1515. [DOI] [PubMed] [Google Scholar]
- 10. Harrison J, Minassian SL, Jenkins L, et al A neuropsychological test battery for use in Alzheimer disease clinical trials. Arch Neurol 2007; 64: 1323–1329. [DOI] [PubMed] [Google Scholar]
- 11. Bruce DG, Davis WA, Casey GP, et al Predictors of cognitive decline in older individuals with diabetes. Diabetes Care 2008; 31: 2103–2107. [DOI] [PMC free article] [PubMed] [Google Scholar]
- 12. Manschot SM, Biessels GJ, de Valk H, et al Metabolic and vascular determinants of impaired cognitive performance and abnormalities on brain magnetic resonance imaging in patients with type 2 diabetes. Diabetologia 2007; 50: 2388–2397. [DOI] [PMC free article] [PubMed] [Google Scholar]
- 13. Guo M, Mi J, Jiang QM, et al Metformin may produce antidepressant effects through improvement of cognitive function among depressed patients with diabetes mellitus. Clin Exp Pharmacol Physiol 2014; 41: 650–656. [DOI] [PubMed] [Google Scholar]
- 14. Umegaki H, Iimuro S, Shinozaki T, et al Risk factors associated with cognitive decline in the elderly with type 2 diabetes: baseline data analysis of the Japanese Elderly Diabetes Intervention Trial. Geriatr Gerontol Int 2012; 12(Suppl 1): 103–109. [DOI] [PubMed] [Google Scholar]
- 15. Kurella Tamura M, Wadley V, Yaffe K, et al Kidney function and cognitive impairment in US adults: the Reasons for Geographic and Racial Differences in Stroke (REGARDS) Study. Am J Kidney Dis 2008; 52: 227–234. [DOI] [PMC free article] [PubMed] [Google Scholar]
- 16. Makin SD, Cook FA, Dennis MS, et al Cerebral small vessel disease and renal function: systematic review and meta‐analysis. Cerebrovasc Dis 2015; 39: 39–52. [DOI] [PMC free article] [PubMed] [Google Scholar]
- 17. Yao H, Araki Y, Takashima Y, et al Chronic kidney disease and subclinical brain infarction increase the risk of vascular cognitive impairment: the Sefuri study. J Stroke Cerebrovasc Dis 2017; 26: 420–424. [DOI] [PubMed] [Google Scholar]
- 18. Feinkohl I, Aung PP, Keller M, et al Severe hypoglycemia and cognitive decline in older people with type 2 diabetes: the Edinburgh type 2 diabetes study. Diabetes Care 2014; 37: 507–515. [DOI] [PubMed] [Google Scholar]
- 19. Goh DA, Dong Y, Lee WY, et al A pilot study to examine the correlation between cognition and blood biomarkers in a Singapore Chinese male cohort with type 2 diabetes mellitus. PLoS One 2014; 9: e96874. [DOI] [PMC free article] [PubMed] [Google Scholar]
- 20. Ancelin ML, Ripoche E, Dupuy AM, et al Gender‐specific associations between lipids and cognitive decline in the elderly. Eur Neuropsychopharmacol 2014; 24: 1056–1066. [DOI] [PubMed] [Google Scholar]
- 21. Farbstein D, Levy AP. HDL dysfunction in diabetes: causes and possible treatments. Expert Rev Cardiovasc Ther 2012; 10: 353–361. [DOI] [PMC free article] [PubMed] [Google Scholar]
- 22. Gonzalez‐Escamilla G, Atienza M, Garcia‐Solis D, et al Cerebral and blood correlates of reduced functional connectivity in mild cognitive impairment. Brain Struct Funct 2016; 221: 631–645. [DOI] [PubMed] [Google Scholar]
- 23. Balazs Z, Panzenboeck U, Hammer A, et al Uptake and transport of high‐density lipoprotein (HDL) and HDL‐associated alpha‐tocopherol by an in vitro blood‐brain barrier model. J Neurochem 2004; 89: 939–950. [DOI] [PubMed] [Google Scholar]
- 24. Koldamova RP, Lefterov IM, Lefterova MI, et al Apolipoprotein A‐I directly interacts with amyloid precursor protein and inhibits A beta aggregation and toxicity. Biochemistry 2001; 40: 3553–3560. [DOI] [PubMed] [Google Scholar]
- 25. Kay AD, Day SP, Kerr M, et al Remodeling of cerebrospinal fluid lipoprotein particles after human traumatic brain injury. J Neurotrauma 2003; 20: 717–723. [DOI] [PubMed] [Google Scholar]
- 26. Khera AV, Cuchel M, de la Llera‐Moya M, et al Cholesterol efflux capacity, high‐density lipoprotein function, and atherosclerosis. N Engl J Med 2011; 364: 127–135. [DOI] [PMC free article] [PubMed] [Google Scholar]
- 27. Nguyen HT, Grzywacz JG, Arcury TA, et al Linking glycemic control and executive function in rural older adults with diabetes mellitus. J Am Geriatr Soc 2010; 58: 1123–1127. [DOI] [PMC free article] [PubMed] [Google Scholar]
- 28. Nakamizo A, Kikkawa Y, Hiwatashi A, et al Executive function and diffusion in frontal white matter of adults with moyamoya disease. J Stroke Cerebrovasc Dis 2014; 23: 457–461. [DOI] [PubMed] [Google Scholar]
- 29. Thabit H, Kyaw Tun T, McDermott J, et al Executive function and diabetes mellitus–a stone left unturned? Curr Diabetes Rev 2012; 8: 109–115. [DOI] [PubMed] [Google Scholar]
- 30. Kodama S, Tanaka S, Saito K, et al Effect of aerobic exercise training on serum levels of high‐density lipoprotein cholesterol: a meta‐analysis. Arch Intern Med 2007; 167: 999–1008. [DOI] [PubMed] [Google Scholar]
- 31. Casella‐Filho A, Chagas AC, Maranhão RC, et al Effect of exercise training on plasma levels and functional properties of high‐density lipoprotein cholesterol in the metabolic syndrome. Am J Cardiol 2011; 107: 1168–1172. [DOI] [PubMed] [Google Scholar]
- 32. Roberts CK, Ng C, Hama S, et al Effect of a short‐term diet and exercise intervention on inflammatory/anti‐inflammatory properties of HDL in overweight/obese men with cardiovascular risk factors. J Appl Physiol (1985) 2006; 101: 1727–1732. [DOI] [PubMed] [Google Scholar]
- 33. Ribeiro IC, Iborra RT, Neves MQ, et al HDL atheroprotection by aerobic exercise training in type 2 diabetes mellitus. Med Sci Sports Exerc 2008; 40: 779–786. [DOI] [PubMed] [Google Scholar]
- 34. Dreon DM, Vranizan KM, Krauss RM, et al The effects of polyunsaturated fat vs monounsaturated fat on plasma lipoproteins. JAMA 1990; 263: 2462–2466. [PubMed] [Google Scholar]
- 35. Mattson FH, Grundy SM. Comparison of effects of dietary saturated, monounsaturated, and polyunsaturated fatty acids on plasma lipids and lipoproteins in man. J Lipid Res 1985; 26: 194–202. [PubMed] [Google Scholar]
- 36. Shepherd J, Packard CJ, Patsch JR, et al Effects of dietary polyunsaturated and saturated fat on the properties of high density lipoproteins and the metabolism of apolipoprotein A‐I. J Clin Invest 1978; 61: 1582–1592. [DOI] [PMC free article] [PubMed] [Google Scholar]
- 37. Volek JS, Sharman MJ, Forsythe CE. Modification of lipoproteins by very low‐carbohydrate diets. J Nutr 2005; 135: 1339–1342. [DOI] [PubMed] [Google Scholar]
- 38. Keene D, Price C, Shun‐Shin MJ, et al Effect on cardiovascular risk of high density lipoprotein targeted drug treatments niacin, fibrates, and CETP inhibitors: meta‐analysis of randomised controlled trials including 117411 patients. BMJ 2014; 349: g4379. [DOI] [PMC free article] [PubMed] [Google Scholar]
- 39. Expert Panel on Detection, Evaluation . Executive summary of the Third Report of the National Cholesterol Education Program (NCEP) expert panel on detection, evaluation, and treatment of high blood cholesterol in adults (Adult Treatment Panel III). JAMA 2001; 285: 2486. [DOI] [PubMed] [Google Scholar]
- 40. Jacobson TA, Ito MK, Maki KC, et al National Lipid Association recommendations for patient‐centered management of dyslipidemia: part 1 ‐ executive summary. J Clin Lipidol 2014; 8: 473–488. [DOI] [PubMed] [Google Scholar]
- 41. Rensen PCN, Havekes LM. Cholesteryl ester transfer protein inhibition: effect on reverse cholesterol transport? Arterioscler Thromb Vasc Biol 2006; 26: 681–684. [DOI] [PubMed] [Google Scholar]
Associated Data
This section collects any data citations, data availability statements, or supplementary materials included in this article.
Supplementary Materials
Table S1 ¦ Partial correlation analysis between baseline characteristics and Neuropsychological Test Battery domain z‐scores