

Abstract
Aims/Introduction
To assess the associations of working conditions, eating habits and glycemic control among young Japanese workers with type 2 diabetes.
Materials and Methods
This hospital‐ and clinic‐based prospective study included 352 male and 126 female working patients with diabetes aged 20–40 years. Data were obtained from June to July 2012 and June to July 2013. Logistic regression analysis was used to estimate multivariable‐adjusted odds ratios (ORs) and 95% confidence intervals (CIs) for suboptimal glycemic control (glycosylated hemoglobin level of ≥7%) obtained from June to July 2013.
Results
Multivariable logistic regression analysis showed that disease duration of ≥10 years (OR 2.43, 95% CI 1.02–5.80), glycosylated hemoglobin level of ≥7% in 2012 (OR 8.50, 95% CI 4.90–14.80), skipping breakfast and late evening meals (OR 2.50, 95% CI 1.25–5.00) and working ≥60 h/week (OR 2.92, 95% CI 1.16–7.40) were predictive of suboptimal glycemic control in male workers, whereas a glycosylated hemoglobin level of ≥7% in 2012 (OR 17.96, 95% CI 5.93–54.4), oral hyperglycemic agent therapy (OR 12.49, 95% CI 2.75–56.86) and insulin therapy (OR 11.60, 95% CI 2.35–57.63) were predictive of suboptimal glycemic control in female workers.
Conclusions
Working ≥60 h/week and habitual skipping breakfast concomitant with late evening meals might affect the ability of young male workers with type 2 diabetes to achieve and maintain glycemic control.
Keywords: Glycosylated hemoglobin, Lifestyle, Type 2 diabetes
Introduction
In Japan, the association between long working hours (LWHs) and the phenomenon of karoshi (death owing to overwork) because of unhealthy lifestyle choices (i.e., physical inactivity, unhealthy eating habits and short sleep duration) and prolonged exposure to work‐related psychological stress has received much attention. Because most adults work for at least one‐third of the day, occupational factors might play an important role in glycemic control1. However, few epidemiological studies have investigated the effects of working conditions (i.e., working hours, occupation type, employment status and night work) on the incidence of type 2 diabetes and glycemic control among workers with type 2 diabetes2, 3, 4.
Various lifestyle factors, particularly habitually skipping breakfast (SB) and late evening meals (LEMs), were associated with the onset of obesity and type 2 diabetes. SB is independently associated with several risk factors for type 2 diabetes, including increased body mass index (BMI), waist circumference and insulin resistance5, 6, 7. Furthermore, SB is associated with poor glycemic control, even after adjusting for BMI8, 9. In contrast, owing to a lack of time, impaired appetite and fatigue, LEMs can be associated with SB the following day10. However, in the general Japanese population, hyperglycemia has been associated with LEMs, but not SB.
Therefore, the present hospital‐ and clinic‐based prospective study aimed to identify associations between suboptimal glycemic control and four work characteristics (i.e., number of working hours, type of occupation, status of employment and shift work) and unhealthy lifestyle habits (i.e., habitual SB or LEMs) among young Japanese adults with type 2 diabetes. Furthermore, subanalysis was carried out to assess the relationship between various lifestyle choices, socioeconomic status (SES) and complications of young Japanese adults with type 2 diabetes11.
Methods
Participants
The present study was carried out at 96 member facilities (53 hospitals and 43 clinics) of the Japan Federation of Democratic Medical Institutions (Min‐iren) that were located in 38 of the 48 Japanese Prefectures, rendering this a nationwide study11. The study cohort included 782 outpatients with type 2 diabetes aged 20–40 years as of 31 March 2012, who visited any of the participating facilities from 1 October 2011 to 31 March 2012, met the inclusion criteria and agreed to participate in this study. The study data were acquired from medical records dated from June to July of 2012 and a self‐administered questionnaire that was distributed at the same time. Subanalysis was carried out to identify type 2 diabetes‐related lifestyle factors that were associated with achieving or maintaining optimal glycemic control. Unemployed persons, students or welfare recipients, and those with missing data regarding glycosylated hemoglobin (HbA1c) levels owing to dropping out of the study from June to July 2013 were excluded. Of the 782 outpatients, data of 478 patients were included for analysis (Figure 1). The patients who achieved or maintained serum HbA1c levels of <7.0% were categorized as the optimal group (n = 179), and the remaining patients as the suboptimal group (n = 299).
Figure 1.
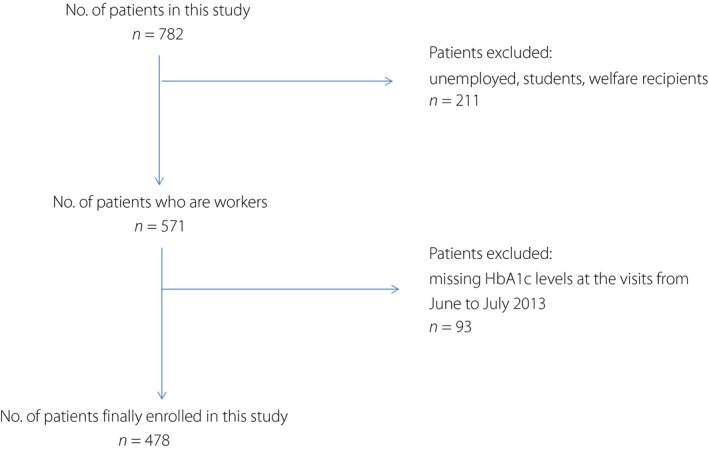
Flow chart of patient selection. HbA1c, glycosylated hemoglobin.
Measurements and definition
The diagnosis of type 2 diabetes and classification of diabetes type were carried out according to the guidelines of the Committee of the Japan Diabetes Society on the Diagnostic Criteria of Diabetes12. Data regarding type 2 diabetes diagnosis, sex, age, disease duration, HbAlc (%), BMI (kg/m2), drug therapy (oral hyperglycemic agents, glucagon‐like peptide‐1 [GLP‐l] analogs, insulin or antidyslipidemic agents), and the presence or absence of diabetic retinopathy and/or nephropathy were collected from medical records dated from June to July 2012. Using a self‐administered questionnaire, data regarding smoking habits, drinking habits, physical activity, sleep time, habitual SB or LEMs and SES were obtained.
Each patient was classified as obese (BMI ≥30 kg/m2), overweight (BMI ≥25 kg/m2) or having a normal bodyweight (BMI <25 kg/m2). The prevalence of retinopathy was based on a medical diagnosis. Nephropathy was confirmed based on proteinuria by qualitative testing (persistent proteinuria) or serum creatinine level of >2 mg/dL (renal insufficiency).
Histories of smoking and alcohol consumption were classified as current, previous or none. Regarding physical activity, regular exercise was defined as exercise carried out more than twice per week. Habitual SB was determined based on a positive response to the question: ‘Do you skip breakfast at least one time per week?’ The habit of LEMs was determined based on a positive response to the question: ‘Do you eat dinner after 10:00 pm at least one time per week?’ According to the combination of answers regarding habitual SB and LEMs, the patients were classified into four eating behavior groups: absence of both SB and LEMs (normal eating behavior), LEMs alone, SB alone, and both SB and LEMs (SB concomitant with LEMs), as described elsewhere10.
SES was determined by assessing the working environment of the patient. Employment status was classified as regular, non‐regular or unemployed. The number of working hours per week was classified into one of three categories as: ≤35, >35 and <60, and ≥60 h. Occupations were classified into one of three categories of: (i) manager/professional/independent business; (ii) white collar (e.g., sales, service or clerical worker); and (iii) blue collar (e.g., skilled, semiskilled or unskilled worker). The classification of work schedule was either shift work (involving irregular or unusual hours) or no shift work (normal daytime work schedule).
Informed consent
The study protocol was approved by the Ethics Committee of Jouhoku Hospital (Ishikawa, Japan), and written informed consent was obtained from all participants.
Study design and statistical analysis
Recommended treatment goals based on the Japanese Diabetes Society guidelines included HbAlc levels of <7.0%13. Therefore, suboptimal glycemic control was defined as: (i) yes, if HbAlc levels were ≥7%; or (ii) no, if HbAlc levels were <7%. The association between baseline factors and suboptimal glycemic control (HbAlc ≥7%) from June to July 2013 as the outcome variables was identified using univariate and multivariate analyses. These baseline covariates were disease duration, HbAlc (<7% or ≥7%), BMI (obese, overweight or normal), therapeutic agent for type 2 diabetes (oral hyperglycemic agent therapy with GLP‐l analogs or insulin therapy with oral hyperglycemic agents), smoking habit, drinking habit, physical activity, sleep time, unhealthy eating habit (SB and/or LEMs) and working conditions (employment status, number of working hours per week, occupation type and shift work, particularly at night).
Continuous variables are reported as mean ± standard deviations and categorical variables are reported as percentages. Intergroup comparisons were carried out using the t‐test or χ2‐test, depending on the data type of the variable. Associations based on logistic regression analysis are summarized as odds ratios (ORs) and 95% confidence intervals (CIs). All statistical tests were two‐tailed, and a P‐value of <0.05 was considered statistically significant. To determine the effects of multicollinearity on logistic regression analyses and subsequent conclusions, the uncertainty coefficient and Kendall's tau rank correlation were used. The Hosmer–Lemeshow test was used to evaluate the goodness‐of‐fit of the logistic regression analyses. A P‐value of >0.05 was considered a good fit. All calculations were carried out using SPSS 8.0J for Windows statistical software (SPSS Japan Inc., Tokyo, Japan).
Results
Clinical characteristics
The baseline characteristics of 478 workers are summarized with descriptive statistics in Table 1. There were no significant differences between baseline and 1‐year HbAlc (%) and BMI (kg/m2) values. The therapeutic method of the 352 male workers was dietary modification (13.1%), use of oral hypoglycemic agents with GLP‐l analogs (64.2%) and insulin therapy (22.7%). Of the 126 female workers, the therapeutic method was dietary modification (15.1%), the use of oral hypoglycemic agents with GLP‐l analogs (54.0%) and insulin therapy (30.2%). The prevalence of retinopathy was similar between men and women (21.9% vs 21.7%, respectively), whereas the prevalence of overt proteinuria and renal insufficiency was higher in men than in women (19.3% vs 9.5%, respectively). More men than women were regularly employed (79.0% vs 32.2%, respectively). Among male workers, the proportion of those who worked for ≥60 h/week was high, at approximately 26.7%.
Table 1.
Baseline characteristics of 478 workers (352 men and 126 women)
| Men (n = 352) | Women (n = 126) | |
|---|---|---|
| Age (years) | 35.1 ± 4.6 | 34.7 ± 4.6 |
| 20–29 | 13.4 | 14.8 |
| 30–40 | 86.6 | 85.2 |
| Duration of diabetes (years) | ||
| Mean (SD) | 5.9 ± 5.3 | 6.7 ± 5.8 |
| HbA1c (%)† | ||
| 2012 | 7.7 ± 1.7 | 7.6 ± 1.5 |
| 2013 | 7.7 ± 1.7 | 7.7 ± 1.5 |
| BMI (kg/m2)† | ||
| 2012 | 29.4 ± 5.7 | 29.3 ± 5.2 |
| 2013 | 29.2 ± 6.0 | 29.1 ± 5.8 |
| Retinopathy | ||
| Yes | 21.9 | 21.7 |
| No | 78.1 | 78.3 |
| Nephropathy | ||
| Yes | 19.3 | 9.5 |
| No | 80.7 | 90.5 |
| Treatment | ||
| Diet | 13.1 | 15.1 |
| Oral hyperglycemic agents | 64.2 | 54.7 |
| Insulin | 22.7 | 30.2 |
| Antidyslipidemic agents | ||
| Yes | 34.9 | 21.4 |
| No | 65.1 | 78.6 |
| Physical activity | ||
| Yes | 50.0 | 51.6 |
| No | 50.0 | 48.4 |
| Skipping breakfast | ||
| Yes | 39.2 | 32.5 |
| No | 60.8 | 67.5 |
| Late evening meals | ||
| Yes | 56.3 | 42.9 |
| No | 43.7 | 57.1 |
| Current drinking | ||
| Yes | 48.9 | 34.9 |
| No or former | 51.1 | 65.1 |
| Current smoking | ||
| Yes | 43.8 | 21.4 |
| No or former | 56.3 | 78.6 |
| Sleep time (h/day) | ||
| <6 | 24.4 | 23.0 |
| 6–9 | 73.6 | 75.4 |
| ≥9 | 1.9 | 1.6 |
| Employment status | ||
| Regular employment | 79.2 | 32.2 |
| Non‐regular employment | 20.8 | 67.8 |
| Occupations | ||
| Manager/professional/independent business | 26.1 | 19.0 |
| White collar | 33.0 | 53.2 |
| Blue collar | 40.9 | 27.8 |
| Shift work | ||
| Yes | 28.7 | 38.9 |
| No | 71.3 | 61.1 |
| Work h/week | ||
| ≤35 | 13.6 | 46.0 |
| 35–60 | 59.9 | 43.7 |
| ≥60 | 26.7 | 10.3 |
Data are presented as frequency and mean ± standard deviation or percentages. † P‐values were determined using the paired t‐test. Values were statistically significant at P < 0.05. BMI, body mass index; HbA1c, glycosylated hemoglobin; SD, standard deviation.
Simple correlations of clinical data
The baseline characteristics of the 478 workers in the optimal and suboptimal groups are summarized in Tables 2 and 3, respectively. Among the male workers, there were statistically significant differences between the two groups regarding HbAlc levels in 2012 (P < 0.001), type 2 diabetes duration (P = 0.001), therapeutic method (P < 0.001), current drinking (P = 0.049), eating habit (P = 0.003) and weekly working hours (P = 0.015). Similarly, among the female workers, statistically significant differences were observed between the two groups regarding HbAlc levels in 2012 (P < 0.001), therapeutic method (P < 0.001), eating habit (P = 0.021) and shift work (P = 0.031).
Table 2.
Baseline characteristics according to achieving or maintaining glycosylated hemoglobin level (glycosylated hemoglobin level of <7%) among male workers
| Optimal (n = 135) | Suboptimal (n = 217) | P‐value | |
|---|---|---|---|
| Age, years (%) | |||
| 20–29 | 14.1 | 12.9 | 0.753 |
| 30–40 | 85.9 | 87.1 | |
| Duration of diabetes, years (%) | |||
| ≤5 years | 47.4 | 42.1 | 0.001 |
| 5–10 | 23.9 | 30.6 | |
| ≥10 years | 14.7 | 22.3 | |
| HbA1c in 2012 (%) | |||
| Optimal (<7%) | 71.9 | 18.4 | <0.001 |
| Suboptimal (≥7%) | 28.1 | 81.6 | |
| BMI (%) | |||
| Normal | 26.7 | 20.7 | 0.060 |
| Overweight | 39.3 | 31.8 | |
| Obese | 34.0 | 47.5 | |
| Treatment (%) | |||
| Diet | 21.5 | 7.8 | <0.001 |
| Oral hyperglycemic agents | 67.4 | 65.0 | |
| Insulin | 11.1 | 27.2 | |
| Antidyslipidemic agents | |||
| Yes | 28.9 | 35.9 | 0.172 |
| No | 71.1 | 64.1 | |
| Physical activity (%) | |||
| Yes | 50.4 | 49.8 | 0.913 |
| No | 49.6 | 50.2 | |
| Eating habit (%) | |||
| Absence of SB and LEMs | 44.4 | 26.7 | 0.003 |
| SB alone | 10.4 | 10.1 | |
| LEMs alone | 25.2 | 28.6 | |
| SB plus LEMs | 20.2 | 34.6 | |
| Current drinking (%) | |||
| Yes | 42.2 | 53.0 | 0.049 |
| No or former | 57.8 | 47.0 | |
| Current smoking (%) | |||
| Yes | 43.0 | 44.2 | 0.814 |
| No or former | 57.0 | 55.8 | |
| Sleep time (h/day) | |||
| <6 (%) | 20.7 | 26.7 | 0.160 |
| 6–9 (%) | 78.5 | 70.5 | |
| ≥9 (%) | 0.7 | 2.8 | |
| Employment status (%) | |||
| Regular employment | 80.2 | 78.6 | 0.753 |
| Non‐regular employment | 20.0 | 21.4 | |
| Occupations (%) | |||
| Manager/professional/independent business | 21.8 | 28.0 | 0.391 |
| White collar | 33.8 | 33.2 | |
| Blue collar | 44.4 | 38.8 | |
| Shift work (%) | |||
| Yes | 28.9 | 28.6 | 0.949 |
| No | 71.1 | 71.4 | |
| Work h/week (%) | |||
| ≤35 | 17.0 | 11.1 | 0.015 |
| 35–60 | 64.4 | 57.1 | |
| ≥60 | 18.5 | 31.8 | |
The χ2‐test was used to examine categorical variables. P‐values of <0.05 were considered to be statistically significant. BMI, body mass index; HbA1c, glycosylated hemoglobin; LEMs, late evening meals; SB, skipping breakfast.
Table 3.
Baseline characteristics according to achieving or maintaining glycosylated hemoglobin level (glycosylated hemoglobin level of <7%) among female workers
| Optimal (n = 44) | Suboptimal (n = 82) | P‐value | |
|---|---|---|---|
| Age, years (%) | |||
| 20–29 | 18.2 | 15.9 | 0.738 |
| 30–40 | 81.8 | 84.1 | |
| Duration of diabetes, years (%) | |||
| ≤5 years | 54.5 | 42.7 | 0.438 |
| 5–10 | 20.5 | 24.4 | |
| ≥10 years | 25.0 | 32.9 | |
| HbA1c in 2012 (%) | |||
| Optimal (<7%) | 79.5 | 19.5 | <0.001 |
| Suboptimal (≥7%) | 20.5 | 80.5 | |
| BMI (%) | |||
| Normal | 25.6 | 17.1 | 0.265 |
| Overweight | 25.6 | 39.0 | |
| Obese | 48.8 | 43.9 | |
| Treatment (%) | |||
| Diet | 36.4 | 4.9 | <0.001 |
| Oral hyperglycemic agents | 45.5 | 64.6 | |
| Insulin | 18.2 | 30.5 | |
| Antidyslipidemic agents | |||
| Yes | 11.4 | 23.2 | 0.108 |
| No | 88.6 | 76.8 | |
| Physical activity (%) | |||
| Yes | 54.5 | 50.0 | 0.626 |
| No | 45.5 | 50.0 | |
| Eating habit (%) | |||
| Absence of SB and LEMs | 56.8 | 35.4 | 0.021 |
| SB alone | 18.5 | 12.2 | |
| LEMs alone | 18.2 | 28.0 | |
| SB plus LEMs | 6.8 | 24.4 | |
| Current drinking (%) | |||
| Yes | 31.8 | 36.6 | 0.593 |
| No or former | 68.2 | 63.4 | |
| Current smoking (%) | |||
| Yes | 20.5 | 22.0 | 0.845 |
| No or former | 79.5 | 78.0 | |
| Sleep time (h/day) | |||
| <6 (%) | 13.6 | 28.0 | 0.094 |
| 6–9 (%) | 8.4 | 69.5 | |
| ≥9 (%) | 0.0 | 2.4 | |
| Employment status (%) | |||
| Regular employment | 31.7 | 32.9 | 0.896 |
| Non‐regular employment | 68.3 | 67.1 | |
| Occupations (%) | |||
| Manager/professional/independent business | 14.6 | 22.7 | 0.583 |
| White collar | 58.5 | 53.3 | |
| Blue collar | 26.8 | 24.0 | |
| Shift work (%) | |||
| Yes | 26.8 | 47.4 | 0.031 |
| No | 73.2 | 52.6 | |
| Work h/week (%) | |||
| ≤35 | 44.2 | 47.6 | 0.489 |
| 35–60 | 41.9 | 45.1 | |
| ≥60 | 14.0 | 7.3 | |
The χ2‐test was used to examine categorical variables. P‐values of <0.05 were considered to be statistically significant. BMI, body mass index; HbA1c, glycosylated hemoglobin; LEMs, late evening meals; SB, skipping breakfast.
Risk factors for suboptimal glycemic control by univariate and multivariate correlation analyses
The results of univariate and multivariate logistic regression analyses for identifying clinical variables associated with suboptimal glycemic control among the 478 workers according to sex are presented in Tables 4 and 5, respectively. Univariate logistic regression analysis of male workers showed that the following nine characteristics were predictive of suboptimal glycemic control: disease duration of ≥10 years (OR 3.27, 95% CI 1.60–6.70), HbA1c level of ≥7% (OR 11.30, 95% CI 6.79–18.80), BMI of ≥30 kg/m2 (OR 1.79, 95% CI 1.02–3.13), oral hyperglycemic agent therapy with GLP‐l analogs (OR 2.53, 95% CI 1.31–7.72), insulin therapy (OR 7.39, 95% CI 3.25–16.80), LEMs alone (OR 1.89, 95% CI 1.09–3.23), SB and LEMs (OR 2.87, 95% CI 1.63–5.08), current drinking (OR 1.54, CI 1.00–2.38), and working ≥60 h/week (OR 2.65, 95% CI 1.27–5.50). In contrast, univariate logistic regression analysis of female workers showed that the following five characteristics were predictive of suboptimal glycemic control: HbA1c level of ≥7% (OR 16.00, 95% CI 6.43–40.00), oral hyperglycemic agent therapy with GLP‐l analogs (OR 10.89, 95% CI 3.21–36.94), insulin therapy (OR 11.20, 95% CI 3.02–41.60), SB and LEMs (OR 5.74, 95% CI 1.52–21.60), and shift work (OR 2.60, 95% CI 1.15–5.82). To assess whether these variables were associated with suboptimal glycemic control, multivariable logistic regression analysis was carried out. For male workers, disease duration of ≥10 years (OR 2.43, 95% CI 1.02–5.80), HbA1c level of ≥7% (OR 8.50, 95% CI 4.90–14.80), SB and LEMs (OR 2.50, 95% CI 1.25–5.00), and working ≥60 h/week (OR 2.92, 95% CI 1.16–7.40) remained significant. For female workers, HbA1c level of ≥7% (OR 17.96, 95% CI 5.93–54.4), oral hyperglycemic agents with GLP‐l analogs (OR 12.49, 95% CI 2.75–56.86), and insulin therapy (OR 11.60, 95% CI 2.35–57.63) remained significant.
Table 4.
Univariate and multivariate logistic regression analyses to identify clinical variables associated with suboptimal glycemic control among male workers
| Univariate | P‐value | Multivariate | P‐value | |
|---|---|---|---|---|
| OR (95% CI) | OR (95% CI) | |||
| Age (years) | ||||
| 20–29 | 1 (reference) | |||
| 30–40 | 1.10 (0.56–2.07) | 0.759 | ||
| Duration of diabetes (years) | ||||
| ≤5 years | 1 (reference) | 1 (reference) | ||
| 5–10 | 1.39 (0.84–2.30) | 0.194 | 1.23 (0.67–2.75) | 0.505 |
| ≥10 years | 3.27 (1.60–6.70) | 0.012 | 2.43 (1.02–5.80) | 0.045 |
| HbA1c in 2012 | ||||
| <7% | 1 (reference) | 1.0 | ||
| ≥7% | 11.3 (6.79–18.8) | <0.001 | 8.50 (4.90–14.8) | <0.001 |
| BMI, kg/m2 (%) | ||||
| Normal | 1 (reference) | 1 (reference) | ||
| Overweight | 1.04 (0.59–1.83) | 0.888 | 1.10 (0.55–2.24) | 0.783 |
| Obese | 1.79 (1.02–3.13) | 0.041 | 1.36 (0.67–2.75) | 0.397 |
| Treatment | ||||
| Diet | 1 (reference) | 1 (reference) | ||
| Oral hyperglycemic agents | 2.53 (1.31–7.72) | 0.006 | 1.18 (0.54–2.59) | 0.674 |
| Insulin | 7.39 (3.25–16.80) | <0.001 | 2.47 (0.93–6.60) | 0.071 |
| Antidyslipidemic agents | ||||
| Yes | 1.38 (0.87–2.20) | 0.172 | ||
| No | ||||
| Physical activity | ||||
| Yes | 1 (reference) | |||
| No | 0.98 (0.64–1.50) | 0.913 | ||
| Eating habit | ||||
| Absence of SB and LEMs | 1 (reference) | 1 (reference) | ||
| SB alone | 1.63 (0.76–3.43) | 0.217 | 1.14 (046–2.88) | 0.770 |
| LEMs alone | 1.89 (1.09–3.23) | 0.024 | 1.87 (095–3.71) | 0.070 |
| SB plus LEMs | 2.87 (1.63–5.08) | <0.001 | 2.50 (1.25–5.00) | 0.009 |
| Current drinking | ||||
| Yes | 1.54 (1.00–2.38) | 0.049 | ||
| No or former | 1 (reference) | |||
| Current smoking | ||||
| Yes | 1.05 (0.68–1.62) | 0.814 | ||
| No or former | 1 (reference) | |||
| Sleep time (h/day) | ||||
| <6 | 1.43 (0.86–2.40) | 0.170 | ||
| 6–9 | 1 (reference) | |||
| ≥9 | 4.15 (0.49–35.0) | 0.190 | ||
| Employment status | ||||
| Regular employment | 1 (reference) | |||
| Non‐regular employment | 1.02 (0.60–1.75) | 0.940 | ||
| Occupations | ||||
| Manager/professional/independent business | 1 (reference) | |||
| White collar | 0.76 (0.43–1.36) | 0.360 | ||
| Blue collar | 0.68 (0.39–1.18) | 0.170 | ||
| Shift work | ||||
| Yes | 0.98 (0.61–1.58) | 0.950 | ||
| No | 1 (reference) | |||
| Work h/week | ||||
| ≤35 | 1 (reference) | 1 (reference) | ||
| 35–60 | 1.37 (0.72–2.58) | 0.335 | 1.85 (0.81–4.23) | 0.145 |
| ≥60 | 2.65 (1.27–5.50) | 0.009 | 2.92 (1.16–7.40) | 0.023 |
P‐values of <0.05 were considered to be statistically significant. CI, confidence interval; BMI, body mass index; HbA1c, glycosylated hemoglobin; LEMs, late evening meals; OR, odds ratio; SB, skipping breakfast.
Table 5.
Univariate and multivariate logistic regression analyses to identify clinical variables associated with suboptimal glycemic control among female workers
| Univariate | P‐value | Multivariate | P‐value | |
|---|---|---|---|---|
| OR (95% CI) | OR (95% CI) | |||
| Age (years) | ||||
| 20–29 | 1 (reference) | |||
| 30–40 | 1.18 (0.45–3.10) | 0.738 | ||
| Duration of diabetes (years) | ||||
| ≤5 years | 1 (reference) | |||
| 5–10 | 1.09 (0.46–2.60) | 0.840 | ||
| ≥10 years | 1.88 (0.70–5.05) | 0.214 | ||
| HbA1c in 2012 | ||||
| <7% | 1(reference) | 1(reference) | ||
| ≥7% | 16.0 (6.43–40.0) | <0.001 | 17.96 (5.93–54.4) | <0.001 |
| BMI, kg/m2 (%) | ||||
| Normal | 1 (reference) | |||
| Overweight | 2.29 (0.80–6.50) | 0.121 | ||
| Obese | 1.35 (0.52–3.50) | 0.541 | ||
| Treatment | ||||
| Diet | 1 (reference) | 1 (reference) | ||
| Oral hyperglycemic agents | 10.89 (3.21–36.94) | <0.001 | 12.49 (2.75–56.86) | 0.001 |
| Insulin | 11.20 (3.02–41.60) | <0.001 | 11.60 (2.35–57.63) | 0.027 |
| Antidyslipidemic agents | ||||
| Yes | 2.35 (0.81–6.81) | 0.115 | ||
| No | 1 (reference) | |||
| Physical activity | ||||
| Yes | 1 (reference) | |||
| No | 0.83 (0.40–1.74) | 0.627 | ||
| Eating habit | ||||
| Absence of SB and LEMs | 1 (reference) | 1 (reference) | ||
| SB alone | 1.08 (0.37–3.15) | 0.891 | 1.94 (0.45–8.27) | 0.371 |
| LEMs alone | 2.46 (0.94–6.51) | 0.066 | 1.70 (0.46–6.30) | 0.428 |
| SB plus LEMs | 5.74 (1.52–21.6) | 0.010 | 5.85 (0.84–40.73) | 0.744 |
| Current drinking | ||||
| Yes | 1.24 (0.57–2.69) | 0.593 | ||
| No or former | 1 (reference) | |||
| Current smoking | ||||
| Yes | 1.09 (0.44–2.69) | 0.845 | ||
| No or former | 1 (reference) | |||
| Sleep time (h/day) | ||||
| <6 | 2.56 (0.95–6.86) | 0.063 | ||
| 6–9 (reference) | 1 (reference) | |||
| ≥9 | 328.40 (0.00–800.50) | 0.713 | ||
| Employment status | ||||
| Regular employment | 1 (reference) | |||
| Non‐regular employment | 0.91 (0.41–2.06) | 0.829 | ||
| Occupations | ||||
| Manager/professional/independent business | 1 (reference) | |||
| White collar | 0.59 (0.21–1.70) | 0.331 | ||
| Blue collar | 0.60 (0.19–1.90) | 0.382 | ||
| Shift work | ||||
| Yes | 2.60 (1.15–5.82) | 0.021 | 1.87 (0.55–6.41) | 0.320 |
| No | 1 (reference) | 1 (reference) | ||
| Work h/week | ||||
| ≤35 | 1(reference) | |||
| 35–60 | 1.00 (0.46–2.20) | 0.997 | ||
| ≥60 | 0.42 (0.12–1.42) | 0.161 | ||
P‐values of <0.05 were considered to be statistically significant. CI, confidence interval; BMI, body mass index; HbA1c, glycosylated hemoglobin; LEMs, late evening meals; OR, odds ratio; SB, skipping breakfast.
For male workers, no statistically significant correlation was found between disease duration and SB and LEMs (correlation coefficient 0.003, P = 0.870) using the uncertainty coefficient. Likewise, no statistically significant correlation was found between LWHs and SB and LEMs (correlation coefficient 0.015, P = 0.06) using the uncertainty coefficient. Although there was a statistically significant correlation between disease duration and HbA1c by Kendall's tau rank correlation, this correlation was weak (correlation coefficient 0.187, P < 0.001). For male workers, this analysis was considered well adjusted, according to the Hosmer–Lemeshow test (P = 0.308). At a cut‐off value of 0.5, the sensitivity and specificity of the analysis were 84.2% and 67.9%, respectively, with a positive predictive value of 78.0%. Although there was a statistically significant correlation between treatment and HbA1c levels with the uncertainty coefficient in female workers, this correlation was weak (correlation coefficient 0.102, P < 0.001). For female workers, this analysis was considered well adjusted, according to the Hosmer–Lemeshow test (P = 0.830). At a cut‐off value of 0.5, the sensitivity and specificity of the analysis were 81.5% and 79.6%, respectively, with a positive predictive value of 80.8%.
Discussion
The aim of the present prospective study was to assess the association of lifestyle habits and working conditions with suboptimal glycemic control among young adult outpatients with type 2 diabetes. Analysis based on sex revealed an association between LWHs (≥60 h/week) and suboptimal glycemic control in men. This association was robust when adjusted for BMI, pharmacotherapy and lifestyle factors, such as physical inactivity, unhealthy eating habits, smoking, alcohol consumption and sleep deprivation. Thus, LWHs (≥60 h/week) was identified as an independent predictive factor of suboptimal glycemic control. Few attempts have been made to identify the association between working hours and glycemic control among workers with type 2 diabetes4. To the best of our knowledge, this is the first prospective study to assess the association between suboptimal glycemic control and working conditions in adults with type 2 diabetes.
LWHs might result in suboptimal glycemic control owing to greater job stress or strain because of working long hours4. Although the biological mechanism is not well understood, chronic stress at work could affect glycemic control through negative behavioral habits, such as increased eating to cope with stress and neuroendocrinological factors, including counter‐regulatory hormones4. Nevertheless, a meta‐analysis showed no statistically significant associations between work‐related psychosocial stress and job strain with an increased risk of type 2 diabetes14.
Conversely, a recent meta‐analysis reported an evident association between LWHs and type 2 diabetes incidence in the low SES group, although details regarding the mechanisms underlying this association were not mentioned15. The authors determined SES based on the census classification groups (American cohorts), social class categorization of the Registrar General (British cohorts) and the Australian Standard Classification of Occupations (Australian cohorts). The most common occupations of the low SES group were crafts, operatives, service, labor, farming (American cohorts), non‐skilled manual and partly or skilled manual (British cohorts), and production, transportation, elementary and laborer (Australian cohorts). In the present study, the association between suboptimal glycemic control and LWHs was significant after adjusting for SES, as described above for British cohorts.
There was an association between LWHs and type 2 diabetes in male workers. Regarding the association between sex differences and health, one must consider the differences in social roles with respect to sex. We hypothesized that men are more commonly subjected to stress because of LWHs than women, because the social roles of men strongly affect work ethics in Japan, where men are considered to be the breadwinner of the family and who should work outside the home to earn a living16. In other words, these findings increase the possibility that men believe that they are not appropriately rewarded for their labor in regard to LWHs.
Strong associations between working overtime hours and the onset of brain and heart diseases have long been recognized in Japan. Working ≥100 h of overtime for the past 1 month and for ≥80 h of overtime for the past 2–6 months have been correlated with an increased incidence of karoshi 17. We would like to emphasize that ≥80 h of overtime per month is associated with LWHs (≥60 h/week), which was identified as an independent risk factor for suboptimal glycemic control in the present study.
Similarly, the present study results showed that the association between suboptimal glycemic control and SB concomitant with LEMs was robust when adjusted for BMI, pharmacotherapy and other lifestyle factors, such as physical inactivity, smoking, alcohol consumption and sleep duration. To the best of our knowledge, this is the first prospective study to report that SB concomitant with LEMs was more significantly associated with suboptimal glycemic control than SB alone.
Habitual SB is considered to be an unhealthy eating habit associated with the incidence of type 2 diabetes and glycemic control5, 6, 7, 8, 9. One of the mechanisms by which SB could potentially cause or exacerbate type 2 diabetes is the second‐meal phenomenon: the effect of a prior meal in decreasing the increase in blood glucose after a subsequent meal18, which is mediated by plasma‐free fatty acid suppression that induces insulin resistance in humans19. Furthermore, the association between SB intake frequency and metabolic risk factors of obesity, metabolic syndrome, hypertension and type 2 diabetes could be independent of dietary quality8.
The incidence of LEMs can be associated with that of SB the following morning because of several factors, such as a lack of time, impaired appetite and fatigue. Cross‐sectional studies have shown that SB concomitant with LEMs was significantly associated with metabolic syndrome, and that hyperglycemia in the general Japanese population was associated with LEMs alone, but not SB alone10, 20. Hence, the present study focused on the possible close association between SB and eating dinner late at night. SB concomitant with LEMs (a so‐called ‘nocturnal’ life) is related to SB and consumption of more food in the evening and at night, with sleep from midnight to the next morning. Furthermore, a previous study suggested that blood glucose concentration was maintained at a high level between midnight and early morning, and a nocturnal lifestyle leads to impairment of insulin response to glucose in healthy adults21.
In the present study, treatment for most patients included diet modification (13.1% in men and 15.1% in women) or the use of oral hypoglycemic agents with GLP‐1 analogs (64.2% in men and 54.0% in women). Thus, we speculated that endogenous insulin secretion was maintained in most patients. We hypothesized that the outcome regarding the strong association of suboptimal glycemic control with SB concomitant with LEMs was attributable to the effect of a nocturnal lifestyle on a high fasting blood glucose level the next day and the subsequent impairment of insulin response to glucose, as in a healthy person, accompanied by the so‐called second‐meal phenomenon
Neurohormonal and metabolic dysregulation due to experimentally‐induced circadian disruption have been reported in healthy volunteers. A previous cross‐sectional study showed that a later chronotype and larger portions at dinner were associated with poor glycemic control in patients with type 2 diabetes, independently of sleep disturbance. The authors emphasized the importance of the circadian system in metabolic regulation22. Unlike this previous observation, the results of the present study found no association between shift work (involving irregular or unusual hours), which led to severe circadian misalignment, and suboptimal glycemic control in male workers.
The relationship between body composition and chronotype is a possible explanation of the sex differences. Evening chronotype was associated with diabetes in men, but not in women. Men with an evening chronotype were more likely to have a low body mass (i.e., muscle tissue), which can modify insulin resistance rather than fat mass23. It is necessary to consider this fact, although body composition was not assessed in the present study. Another possible explanation is a type 2 error, because the number of female workers in the present study was relatively small. Although there was no significant difference, this tendency was also observed in female workers. Hence, the possibility of a similar association for females cannot be completely denied.
The present study had several strengths. First, this was a multicenter study involving 53 hospitals and 43 clinics with a prospective 1‐year design. Second, this study included comprehensive data regarding both the lifestyles and working conditions of the patients. However, this study also had some limitations. First, LWHs might be a marker of other risk factors for suboptimal glycemic control, such as job stress or strain4. Second, unhealthy eating habits might be a marker of other risk factors, such as dietary quality and patient adherence to medication for suboptimal glycemic control24. Third, not only sleep duration, but also sleep quality might be risk factors for suboptimal glycemic control25. However, the questionnaire did not include items about job strain, depression scale to evaluate the effect of job stress, dietary quality, patient adherence to medication or sleep quality, which could be confounders. Given the abovementioned findings, it became evident that LWHs and unhealthy eating habits of SB concomitant with LEMs might affect the ability of young adults with type 2 diabetes to maintain glycemic control.
The study results showed that LWHs and unhealthy eating habits were related to suboptimal glycemic control among young adults with type 2 diabetes. An inverse association between working hours and glycemic control was observed in male workers. To maintain close to normal glucose levels, interventions to reduce unhealthy lifestyles and reduction in working hours are necessary. With the increasing socioeconomic disparity in Japan, further assessments of the association between working conditions and type 2 diabetes are required.
Disclosure
The authors declare no conflict of interest.
Acknowledgment
The authors thank Enago (www.enago.jp) for the English language review.
J Diabetes Investig 2019; 10: 73–83
References
- 1. Uehata T. Long working hours and occupational stress‐related cardiovascular attacks among middle‐aged workers in Japan. J Hum Ergol (Tokyo) 1991; 20: 147–153. [PubMed] [Google Scholar]
- 2. Kawakami N, Araki S, Takatsuka N, et al Overtime, psychosocial working conditions, and occurrence of non‐insulin dependent diabetes mellitus in Japanese men. Epidemiol Community Health 1999; 53: 359–363. [DOI] [PMC free article] [PubMed] [Google Scholar]
- 3. Kuwahara K, Imai T, Nishihara A, et al Overtime work and prevalence of diabetes in Japanese employees: Japan epidemiology collaboration on occupational health study. Japan Epidemiology Collaboration on Occupational Health Study Group. PLoS ONE 2014; 9: e95732. [DOI] [PMC free article] [PubMed] [Google Scholar]
- 4. Davila EP, Florez H, Trepka MJ, et al Long work hours is associated with suboptimal glycemic control among US workers with diabetes. Am J Ind Med 2011; 54: 375–383. [DOI] [PMC free article] [PubMed] [Google Scholar]
- 5. Odegaard AO, Jacobs DRJr, Steffen LM, et al Breakfast frequency and development of metabolic risk. Diabetes Care 2013; 36: 3100–3106. [DOI] [PMC free article] [PubMed] [Google Scholar]
- 6. Smith KJ, Gall SL, McNaughton SA, et al Skipping breakfast: longitudinal associations with cardiometabolic risk factors in the Childhood Determinants of Adult Health Study. Am J Clin Nutr 2010; 92: 1316–1325. [DOI] [PubMed] [Google Scholar]
- 7. Uemura M, Yatsuya H, Hilawe EH, et al Breakfast skipping is positively associated with incidence of type 2 diabetes mellitus: evidence from the Aichi Workers’ Cohort Study. J Epidemiol 2015; 25: 351–358. [DOI] [PMC free article] [PubMed] [Google Scholar]
- 8. Mekary RA, Giovannucci E, Willett WC, et al Eating patterns and type 2 diabetes risk in men: breakfast omission, eating frequency, and snacking. Am J Clin Nutr 2012; 95: 1182–1189. [DOI] [PMC free article] [PubMed] [Google Scholar]
- 9. Reutrakul S, Hood MM, Crowley SJ, et al The relationship between breakfast skipping, chronotype, and glycemic control in type 2 diabetes. Chronobiol Int 2014; 31: 64–71. [DOI] [PubMed] [Google Scholar]
- 10. Nakajima K, Suwa K. Association of hyperglycemia in a general Japanese population with late‐night‐dinner eating alone, but not breakfast skipping alone. J Diabetes Metab Disord 2015; 14: 16. [DOI] [PMC free article] [PubMed] [Google Scholar]
- 11. Funakoshi M, Azami Y, Matsumoto H, et al Socioeconomic status and type 2 diabetes complications among young adult patients in Japan. PLoS ONE 2017; 12: e0176087. [DOI] [PMC free article] [PubMed] [Google Scholar]
- 12. Seino Y, Nanjo K, Tajima N, et al Report of the committee on the classification and diagnostic criteria of diabetes mellitus. J Diabetes Investig 2010; 1: 212–228. [DOI] [PMC free article] [PubMed] [Google Scholar]
- 13. Araki E, Haneda M, Kasuga M, et al New glycemic targets for patients with diabetes from the Japan Diabetes Society. J Diabetes Investig 2017; 8: 123–125. [DOI] [PMC free article] [PubMed] [Google Scholar]
- 14. Cosgrove MP, Sargeant LA, Caleyachetty R, et al Work‐related stress and Type 2 diabetes: systematic review and meta‐analysis. Occup Med (Lond) 2012; 62: 167–173. [DOI] [PubMed] [Google Scholar]
- 15. Kivimäki M, Virtanen M, Kawachi I, et al Long working hours, socioeconomic status, and the risk of incident type 2 diabetes: a meta‐analysis of published and unpublished data from 222120 individuals. Lancet Diabetes Endocrinol 2015; 3: 27–34. [DOI] [PMC free article] [PubMed] [Google Scholar]
- 16. Pfau‐Effinger B. Socio‐historical paths of the male breadwinner model ‐ an explanation of cross‐national differences. Br J Sociol 2004; 55: 377–399. [DOI] [PubMed] [Google Scholar]
- 17. Iwasaki K, Takahashi M, Nakata A. Health problems due to long working hours in Japan: working hours, workers’ compensation (Karoshi), and preventive measures. Ind Health 2006; 44: 537–540. [DOI] [PubMed] [Google Scholar]
- 18. Jovanovic A, Gerrard J, Taylor R. The second‐meal phenomenon in type 2 diabetes. Diabetes Care 2009; 32: 1199–1201. [DOI] [PMC free article] [PubMed] [Google Scholar]
- 19. Jovanovic A, Leverton E, Solanky B, et al The second‐meal phenomenon is associated with enhanced muscle glycogen storage in humans. Clin Sci (Lond) 2009; 117: 119–127. [DOI] [PubMed] [Google Scholar]
- 20. Kutsuma A, Nakajima K, Suwa K. Potential association between breakfast skipping and concomitant late‐night‐dinner eating with metabolic syndrome and proteinuria in the Japanese population. Scientifica (Cairo) 2014; 2014: 253581. [DOI] [PMC free article] [PubMed] [Google Scholar]
- 21. Qin LQ, Li J, Wang Y, et al The effects of nocturnal life on endocrine circadian patterns in healthy adults. Life Sci 2003; 73: 2467–2475. [DOI] [PubMed] [Google Scholar]
- 22. Reutrakul S, Hood MM, Crowley SJ, et al Chronotype is independently associated with glycemic control in type 2 diabetes. Diabetes Care 2013; 36: 2523–2529. [DOI] [PMC free article] [PubMed] [Google Scholar]
- 23. Yu JH, Yun CH, Ahn JH, et al Evening chronotype is associated with metabolic disorders and body composition in middle‐aged adults. J Clin Endocrinol Metab 2015; 100: 1494–1502. [DOI] [PubMed] [Google Scholar]
- 24. Wheeler ML, Dunbar SA, Jaacks LM, et al Macronutrients, food groups, and eating patterns in the management of diabetes: a systematic review of the literature, 2010. Diabetes Care 2012; 35: 434–445. [DOI] [PMC free article] [PubMed] [Google Scholar]
- 25. Knutson KL, Ryden AM, Mander BA, et al Role of sleep duration and quality in the risk and severity of type 2 diabetes mellitus. Arch Intern Med 2006; 166: 1768–1774. [DOI] [PubMed] [Google Scholar]