Abstract
When axonal fibres approach or leave the cortex, their trajectories tend to closely follow the cortical convolutions. To quantify this tendency, we propose a three-dimensional coordinate system based on the gyral geometry. For every voxel in the brain, we define a “radial” axis orthogonal to nearby surfaces, a “sulcal” axis along the sulcal depth gradient that preferentially points from deep white matter to the gyral crown, and a “gyral” axis aligned with the long axis of the gyrus.
When compared with high-resolution, in-vivo diffusion MRI data from the Human Connectome Project, we find that in superficial white matter the apparent diffusion coefficient (at b=1000) along the sulcal axis is on average 16% larger than along the gyral axis and twice as large as along the radial axis. This is reflected in the vast majority of observed fibre orientations lying close to the tangential plane (median angular offset < 7 degrees), with the dominant fibre orientation typically aligning with the sulcal axis.
In cortical grey matter, fibre orientations transition to a predominantly radial orientation. We quantify the width and location of this transition and find strong reproducibility in test-retest data, but also a clear dependence on the resolution of the diffusion data. The ratio of radial to tangential diffusion is fairly constant throughout most of the cortex, except for a decrease of the diffusivitiy ratio in the sulcal fundi and the primary somatosensory cortex (Brodmann area 3) and an increase in the primary motor cortex (Brodmann area 4).
Although only constrained by cortical folds, the proposed gyral coordinate system provides a simple and intuitive representation of white and grey matter fibre orientations near the cortex, and may be useful for future studies of white matter development and organisation.
1. Introduction
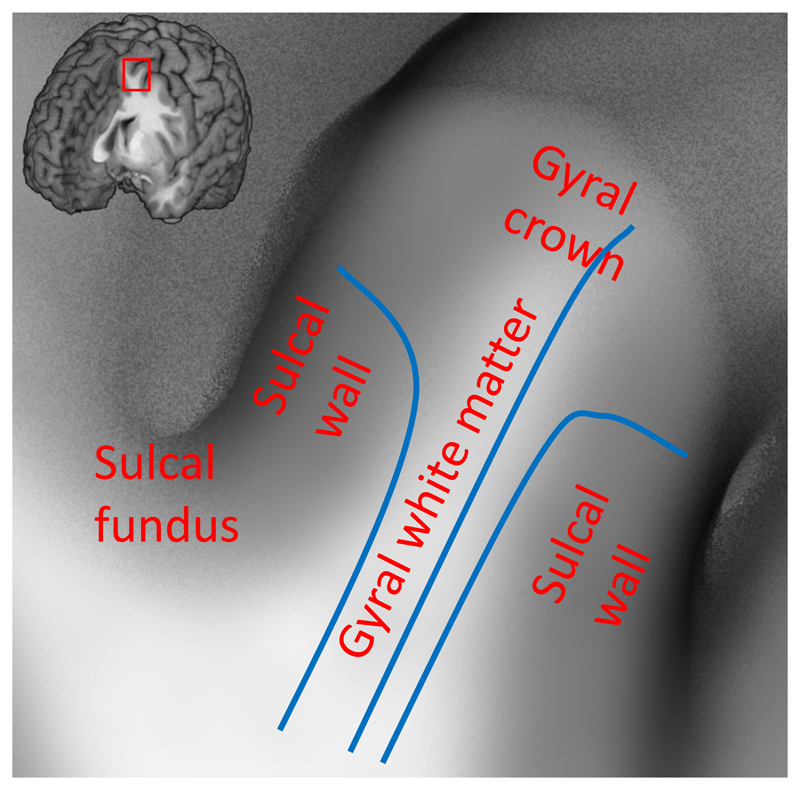
The cerebral cortex of the human brain is highly convoluted, and the pattern of cortical folding is reflected in the orientations of axonal fibres (Figure 1). In myelin-stained histological sections, the dominant axonal orientation in the gyral white matter runs parallel to the sulcal walls, and points towards the gyral crowns (Van Essen et al. 2014; Budde and Annese 2013). This implies that axons mostly cross the gyral crowns at an angle perpendicular to the surface, but approach the sulcal walls at oblique angles before turning 90 degrees to become radial within the cortex (Figure 1). Furthermore, predominantly tangential axons have been found in the white matter below the sulcal fundi, which is consistent with the expected trajectory of U-fibres connecting neighbouring gyri (Van Essen et al. 2014; Budde and Annese 2013; Reveley et al. 2015; Schilling et al. 2017). Despite the predominant tangential orientations found in superficial white matter, at least some axons cross the U-fibres in the sulcal fundi (Reveley et al. 2015) and some cross the gyral white matter to connect the opposite gyral banks (Van Essen et al. 2014). These results from myelin-stained sections present a good initial hypothesis of the axonal orientation distribution, even though the interpretation of these images is complicated due to the projection of a three-dimensional geometry on a two-dimensional plane.
Figure 1.
Illustration of the convoluted cortical surface consisting of protrusions called gyri separated by troughs called sulci. Concave sulcal fundi and convex gyral crowns are connected by relatively straight sulcal walls. Axons from the other parts of the brain have to follow the shape of the gyral white matter to reach the gyral crown and sulcal walls (e.g. blue lines). This suggests that a gyral coordinate system based on the shape of the gyri might be predictive of fibre orientation in gyral white matter.
Diffusion MRI allows us to investigate such patterns in three dimensions over many subjects in-vivo and non-invasively, albeit at a much lower resolution. Using high-resolution diffusion MRI, fibre bundle orientations are mostly radial within the cortex (McKinstry et al. 2002; Deipolyi et al. 2005; Leuze et al. 2014; Truong, Guidon, and Song 2014; Kleinnijenhuis et al. 2015; Bastiani et al. 2016), although at least some cortical regions have predominantly tangential fibre orientations such as the primary somatosensory cortex (Anwander, Pampel, and Knosche 2010; McNab et al. 2013; Calamante et al. 2017). One limitation of these investigations is that they typically do not extend below the cortex, although some do report predominantly tangential orientations just below cortex (Kleinnijenhuis et al. 2015; Reveley et al. 2015).
Here we extend these basic analyses of radiality beyond the cortex to the underlying white matter. We introduce a three-dimensional gyral coordinate system of white matter orientation that is fully specified by the cortical folding pattern. We define three axes: radial, sulcal, and gyral, which are defined relative to the white/grey matter boundary surface, and linearly interpolated to deep and superficial white matter, as well as different intra-cortical depth levels.
Compared with previous approaches, our analysis has two distinct advantages. First, we propose a novel interpolation scheme, which allows us to define the gyral coordinate system in the center of gyral folds by interpolating between the sulcal walls, as well as in the rest of the superficial white matter. Secondly, the three axes allow us to further subdivide tangential fibres into those that are aligned with, or orthogonal to, the sulcal depth gradient. The code to generate the gyral coordinates has been made available online4.
Using fibre orientations inferred from high-resolution diffusion MRI from the Human Connectome Project (HCP; Van Essen et al. 2013; Glasser et al. 2013; Sotiropoulos et al. 2013) dataset, we find that the best-fit diffusion tensors tend to align well with this gyral coordinate system. We confirm quantitatively that the dominant fibre orientations inferred from diffusion MRI are almost exclusively aligned with the tangential (sulcal/gyral) plane in white matter, and with the radial axis in the cortical grey matter.
Moreover, we propose that the transition of white matter orientation from the tangential plane to the radial axis (in the cortex) can be described using a sigmoidal function that parameterizes the location and width of the transition. We fitted this model to diffusion MRI-derived orientations using data acquired at multiple spatial resolutions. We found high reproducibility of the transition boundary across subjects, but also a notable dependence of this transition on spatial resolution.
2. Methods: defining a gyral coordinate system
The gyral coordinate system is based on cortical surface models of the white/grey matter boundary and pial surface as extracted by Freesurfer from a T1-weighted image (Dale, Fischl, and Sereno 1999; Fischl, Sereno, and Dale 1999; Fischl 2012). These surfaces are typically modeled as triangular meshes. On each triangle in a mesh, the “radial” axis is defined as the surface normal and the “sulcal” axis as the gradient of the sulcal depth along the surface, which is always orthogonal to the radial orientation. The “gyral” axis is defined as being orthogonal (i.e., as the cross-product) with respect to the other two axes.
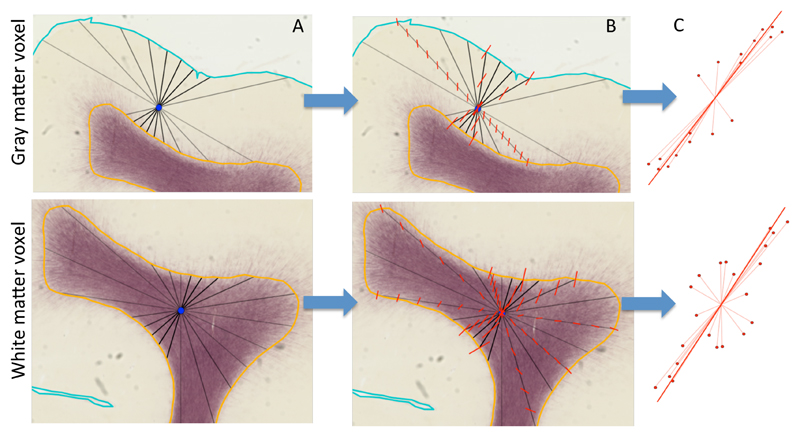
The axes should be interpolated to define them throughout the cortex and superficial white matter. The commonly adopted nearest-neighbour interpolation would lead to a discontinuity in the gyral coordinates at the centre of the gyral folds, especially if the sulcal walls on both sides of the white matter are not parallel to each other. To overcome this challenge, we devise a linear interpolation scheme that considers the convoluted geometry and achieves a smooth transition of the gyral coordinates from one sulcal wall to the other. Linear interpolation is defined either along lines or across a regular grid. We therefore generate a line connecting the two sulcal walls through a point of interest to perform linear interpolation. However, rather than relying on interpolation along a single line, we define the gyral coordinate system as the average of the linear interpolations of a large sample of possible lines through the point of interest (Figure 2).
Figure 2.
Illustration of the method for interpolating the radial axis for any point in the cortical grey matter (top panels) and white matter (bottom panels). For illustrative purposes we show the method on 2D myelin-stained histological sections rather than in the 3D MRI data in the rest of this work. The background is a myelin-stained coronal section from a young (postnatal day 6) macaque with the semi-automatically traced white/grey matter boundary (orange) and pial surface (cyan) marked (see Appendix A for details on the macaque data acquisition). A) Through the centre of any point of interest (blue) 300 lines are generated from a uniform orientation distribution (a subset of these lines is shown in black) connecting the white/grey matter boundary with the pial surface (for grey matter; top row) or the white/grey matter boundary with itself (for white matter; bottom row). B) Along each of these lines, the surface normals at both ends are linearly interpolated to the point of interest (illustrated by the red lines). C) The interpolated normals are given a weight inversely proportional to the length of the (black) line along which they are interpolated (eq. 1). Here this weight is illustrated as the length of the interpolated normal. These interpolated normals are averaged using a PCA-type analysis to get the average radial axis (solid red line). A similar method is used to define the sulcal axis running from the deep white matter to the gyral crown, where rather than the surface normal, the sulcal depth gradient along the surface is interpolated.
We first define the radial axis at every voxel. 300 uniform orientations are generated on a sphere. For each orientation (indexed as i) and each voxel we estimate the radial axis at the voxel of interest as follows:
Through the centre of the voxel, a line is drawn that follows the i-th orientation that terminates once each end intersects the meshes modeling the cortical surface (Figure 2A). In a grey matter voxel this line would intersect with the white/grey matter boundary surface on one end and the pial surface on the other. In a white matter voxel, both ends would intersect with the white/grey matter boundary surface. Lines perpendicular to the sulcal walls are typically short, because they only travel a small distance to intersect the sulcal wall (darker lines in Figure 2A). Conversely, lines parallel to the sulcal walls are longer because they tend to travel much further before intersecting the surface (lighter lines in Figure 2A).
At the intersections found in step 1, we compute the surface normals. These normals are then linearly interpolated along the line to the voxel of interest (Figure 2B). This interpolated normal represents one estimate of the radial orientation at the voxel of interest, which we will denote as
The orientation of the nearby cortical surface is expected to provide a more useful estimate of the radial orientation than elements further away. As noted above, a short line is more likely to encode information from these nearby surface elements, so we assign each interpolated radial orientation a weight wi inversely proportional to the length of the line, connecting the intersections with the surface (li):
| (1) |
The most straightforward method for averaging various estimates of the radial axis is to use a PCA analysis (Jones 2003), where the average axis is defined as the primary eigenvector of a summary matrix (Figure 2C).
The other two basis vectors lie within the plane orthogonal to the radial axis (i.e., the tangential plane). We define the “sulcal” axis at the cortical surface as the gradient of sulcal depth (as approximated from the “sulc” measure in Freesurfer). On the cortex, the gradient of the sulcal depth map is orthogonal to the surface normal and points from the sulcal fundus to the gyral crown. We interpolate this “sulcal” axis onto every voxel in the brain using the same interpolation method used for the radial axis. Although this “sulcal” axis is orthogonal to the normal on the surface, after linear interpolation and PCA averaging, the resulting vector might no longer be orthogonal to the radial axis. We therefore project the interpolated and averaged vector onto the plane orthogonal to the radial orientation to define the “sulcal” axis of our gyral coordinate system.
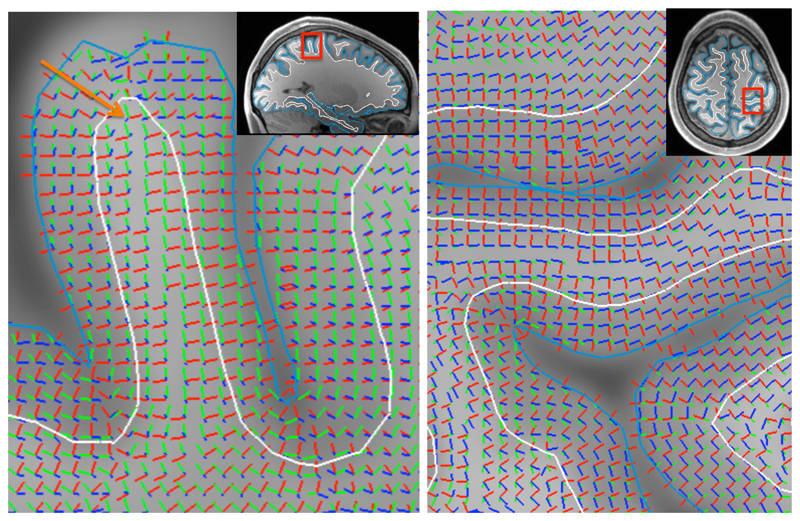
In summary, for every voxel we define three orthonormal orientations (see Figure 3):
Linear interpolation and PCA averaging of surface normals defines the radial axis.
Linear interpolation and PCA averaging of sulcal depth gradient defines the sulcal axis. The resulting orientation is then projected to be orthogonal to the radial axis.
The cross product of the radial and sulcal axes gives the gyral axis.
Figure 3.
Illustration of the three basis vectors defining the gyral coordinate system. The radial axis in red aligns with the normal to the sulcal wall and points along the short axis of the gyrus. The sulcal axis in green aligns with the sulcal depth gradient and tends to point from deep white matter to the gyral crown. The gyral axis in blue is orthogonal to the sulcal axis to define the tangential plane. The arrow on the left panel points to a white matter voxel underlying the gyral crown, which illustrates that even close to the gyral crown the gyral coordinates tend to be defined by the sulcal walls rather than crown (e.g., the radial orientation aligns with the sulcal wall normal). Note that because the gyral coordinates rely fully on the orientation of the WM/GM boundary (white) and the pial surface (cyan), it can be very sensitive to errors in reconstructing these surfaces (e.g., around the “dimple” in the pial surface at the gyral crown in the left panel).
The shortest lines tend to intersect the sulcal walls rather than the gyral crown even in white matter voxels close to the gyral crown, which causes the gyral coordinates to be defined relative to the walls (e.g., arrow in Figure 3). This means that fibres crossing the gyral crown at right angles, which in previous work would have been classified as radial, would here be classified as sulcal as they run parallel to the sulcal walls along the sulcal depth gradient (Appendix B, Figure B1). In Appendix B we further illustrate the advantages of our linear interpolation scheme over nearest-neighbour or non-linear interpolation.
For voxels even closer to the gyral crown than the one marked by the arrow in Figure 3, the radial and sulcal axes will eventually flip to align with the gyral crown. This discontinuity in the radial axis typically takes place at or very close to the WM/GM boundary of the gyral crown and complicates the interpretation of the alignment of fibre orientations measured at this boundary. The discontinuities of the radial axis at the gyral midline or of the gyral axis at the sulcal fundus and gyral crown are merely sign flips, which should not affect the analysis of the antipodally symmetric diffusion data.
The three orthonormal axes can be combined in a single 3x3 rotation matrix:
| (2) |
where is the radial axis, is the sulcal axis, and is the gyral axis. We can convert any orientation, tensor, or orientation distribution function from stereotaxic (i.e., x-, y-, z-) coordinates into gyral coordinates by multiplying with this rotation matrix.
3. Results
3.1. Fibre alignment with the gyral coordinate system
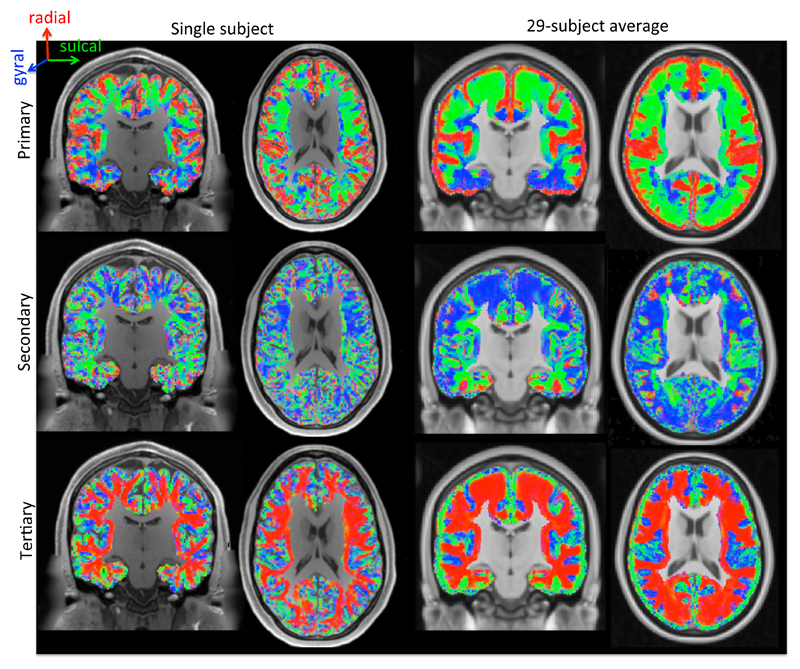
Here we compare the gyral coordinate system to the orientations of diffusion tensors estimated from 3T diffusion MRI data from the Human Connectome Project (HCP; Van Essen et al. 2013). The HCP diffusion data acquisition, pre-processing, (Andersson and Sotiropoulos 2016a) and analysis are briefly discussed in Appendix A (see Sotiropoulos et al. 2013 for more details). The gyral coordinates are evaluated at the centre of every voxel as described above. The eigenvectors of the best-fit diffusion tensors are expressed in these gyral coordinates by multiplying with the rotational matrix defined in eq. 2. These rotated eigenvectors have a distinctive pattern in both single-subject data (left two panels of Figure 4) and group-averaged data (29 subjects in MNI space; right two panels in Figure 4). The primary DTI eigenvector is predominantly radial (in red) in the cortex and tangential (in green or blue) in the underlying white matter (top row in Figure 4). The secondary DTI eigenvector is tangential throughout the brain (middle row in Figure 4). The tertiary DTI eigenvector has the opposite trend from the primary eigenvectors with tangential orientations in the cortex and radial orientations in the superficial white matter (bottom row in Figure 4).
Figure 4.
Alignment of the primary (top), secondary (middle), and tertiary (bottom) eigenvectors of the best-fit diffusion tensor with the gyral coordinates (red: radial; green: sulcal; blue: gyral) overlaid on a T1-weighted map. Left-most two panels: single subject; right-most panels: average of 29 subjects in MNI space. We excluded voxels that were more than 4 mm below the white/grey matter boundary or were closer to the medial wall than to the white/grey matter boundary.
The close alignment of the diffusion tensor eigenvectors with the gyral coordinates implies that once we express the diffusion tensor in the gyral coordinate system (using the rotation matrix from eq. 2) we can meaningfully average the diffusion tensor across either the cortex or the superficial white matter (and even across subjects). In the remainder of this section, we will exploit this to first explore in more detail the radial alignment in the cortex, then the tangential alignment in the white matter, and finally propose a model for the transition between these two regimes across the white/grey matter boundary.
3.2. Radial fibres in the cortex
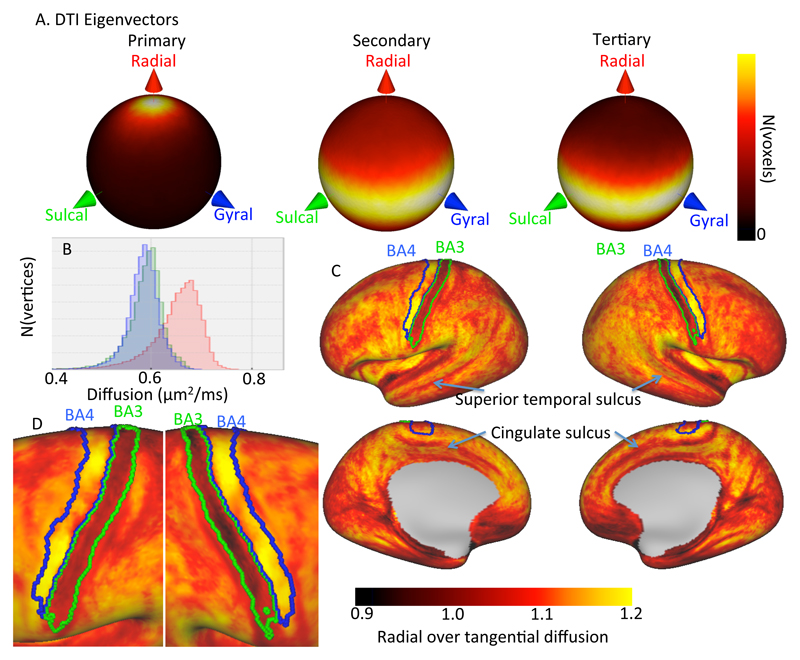
Figure 5 illustrates the alignment of the diffusion tensor with the gyral coordinate system in the cortex. To limit the partial volume from the white matter we only include voxels that are at least 1 mm above the WM/GM boundary. The primary eigenvector of the diffusion tensor is predominantly radial in this volume (left in Figure 5A). Across 29 subjects the median angular offset from the radial orientation is consistently small, between 24 and 31 degrees5 (60 degrees expected for a random distribution). The secondary and tertiary eigenvectors appear not to have a clear preferred orientation in the tangential plane (Figure 5A). In the upper-most layer one would expect to find primarily tangential orientations due to the dendritic tufts (e.g., Leuze et al. 2014). However, even if we only include voxels within 0.5 mm from the pial surface, we do not find evidence for such tangential orientations in the HCP data.
Figure 5.
Alignment of the diffusion tensors with the gyral coordinate system over 29 subjects in the upper cortex (i.e. more than 1 mm above the white/grey matter boundary. A) Spherical heat map of the orientation of the primary (left), secondary (middle) and tertiary (right) eigenvector of the best-fit diffusion tensor. B) Histogram of the radial (red), sulcal (green), and gyral (blue) diffusion coefficient as predicted by the tensor model averaged over 29 subjects. C) Radial over tangential diffusion of the diffusion tensor averaged for 29 subjects after projecting the diffusion tensor in gyral coordinates onto subject-specific surfaces (overlays of Brodmann areas 3 and 4 from Fischl et al. 2008 and Van Essen et al. 2012). D) Detail of Brodmann areas 3 and 4.
For Figure 5B, C we project the diffusion tensor onto the surface. Every voxel at least 1 mm above the white/grey matter boundary is assigned to the nearest surface element and the diffusion tensor expressed in gyral coordinates is averaged over these voxels. The surfaces from the HCP pipeline have all been aligned with the fsaverage template (Van Essen et al. 2012), which allows us to average over the 29 subjects. This averaging assures that the diffusion tensor is well defined even where the cortex is very thin (e.g., Brodmann area 3). Expressing the diffusion tensor in the gyral coordinate system allows us to meaningfully average the diffusion tensor across subjects even without perfect alignment between subjects. Figure 5B shows the histogram of the diffusion coefficient along the radial (red), sulcal (green), and gyral (blue) direction. The diffusivity along the radial axis is slightly higher (on average 10%) than the diffusivity along either tangential axis.
This preference for diffusion in the radial direction is not uniform across the cortex (Figure 5D). On the surface several sharp lines can be seen with a reduced ratio of radial to tangential diffusivity can be seen that tend to align with sulci, such as the marked superior temporal sulcus and the cingulate sulcus. This “radiality” measure is also greatly decreased in Brodmann area 3, where the tangential diffusivity becomes larger than the radial diffusivity. In Brodmann area 4 we see the opposite trend, with a slight increase in the ratio of radial to tangential diffusivity, which creates a clear contrast within the cortex that precisely matches these two brain areas.
3.3. Tangential fibres in the superficial white matter
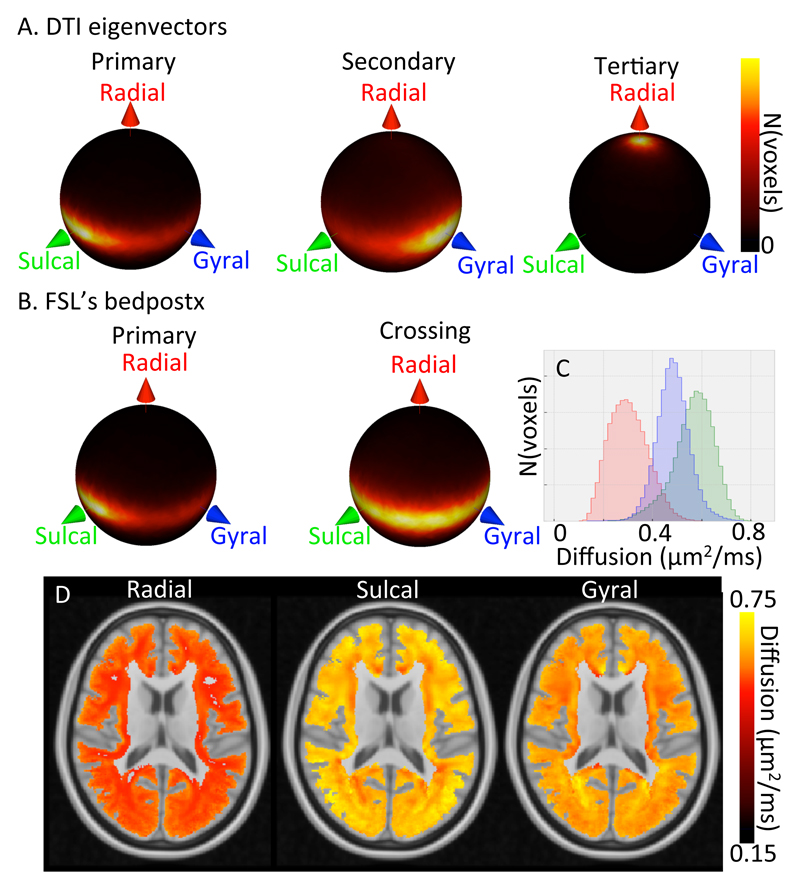
Although previous studies (McKinstry et al. 2002; Deipolyi et al. 2005; Anwander, Pampel, and Knosche 2010; Leuze et al. 2014; Truong, Guidon, and Song 2014; Kleinnijenhuis et al. 2015; Bastiani et al. 2016) mainly focused on the cortex, the alignment of the diffusion tensor eigenvectors with the gyral coordinates is even more striking in the superficial white matter (i.e., within 4 mm of the white/grey matter boundary). The primary eigenvector points preferentially in the sulcal direction, the secondary eigenvector in the gyral direction, and the tertiary eigenvector the radial direction (Figure 6A). The alignment of the tertiary eigenvector with the radial axis has a median angular offset varying between 11 and 16 degrees, which is a much better alignment than found for the primary eigenvector in the cortex. This strong alignment of the tertiary eigenvector can be explained if most fibre dispersion and crossings are constrained to the tangential plane. This is indeed what we find with a crossing fibre model, as implemented using FSL’s bedpostX (Behrens et al. 2007; Jbabdi et al. 2012) with the dominant orientation pointing preferentially along the sulcal axis (left in Figure 6B), and the crossing fibres (both secondary and tertiary) aligned with the tangential plane (right in Figure 6B). The median angular offset of all bedpostX fibre orientations from the tangential plane varies only between 5 and 7 degrees across the 29 subjects. These crossing fibres are very prevalent in the white matter with the crossing fibre model finding a single fibre in 9% of the voxels, two fibres in 26% of the voxels, and three crossing fibres in 65% of the voxels. These crossing fibres likely do not only reflect crossing bundles, but also fibre dispersion within the tangential plane.
Figure 6.
Alignment with the gyral coordinate system over 29 subjects in the superficial white matter (i.e., up to 4 mm below the white/grey matter boundary). A) Spherical heat map of the orientation of the primary (left), secondary (middle) and tertiary (right) tensor eigenvectors. B) Spherical heat map of the orientation of the primary fibre orientation (left) and the crossing fibre orientations (right) from FSL’s bedpostX. C) Histogram of the radial (red), sulcal (green), and gyral (blue) diffusion coefficient (predicted by the tensor model) averaged over 29 subjects in MNI space (note the increased range of the x-axis compared with Figure 5B). D) Maps of the radial (left), sulcal (middle), and gyral (right) diffusivity of the average diffusion tensor.
To investigate the spatial pattern further we transform the diffusion tensors expressed in gyral coordinates to MNI space and average them across all 29 subjects. Once the diffusion tensors are expressed in gyral coordinates they are already aligned with each other across the superficial white matter and the different subject, so we do not apply any additional warp during the registration to MNI space. Figure 6C shows the distribution of the radial (red), sulcal (green), and gyral (blue) diffusivities of the averaged diffusion tensors. The average diffusivity in the sulcal direction is approximately twice as large as for the radial direction. Only the largest diffusivities measured in the radial direction exceed the average diffusivity in the sulcal or gyral direction. These larger radial diffusivities are typically found very close to the cortex or in the deeper white matter (left in Figure 6D).
The histograms of diffusivities along the gyral and sulcal axes show far more overlap (Figure 6C). On average the diffusivity in the sulcal orientation is 16% higher than in the gyral orientation, with the largest difference in the white matter underlying the frontal lobe (22%) and the smallest underlying the temporal lobe (5%). These tangential diffusivities are anti-correlated with regions with lower sulcal diffusivity (e.g., much of the deep white matter) having a higher gyral diffusivity (Figure 6D).
3.4. Application: cortical fibre orientation transition boundary
Across the WM/GM boundary surface, fibres transition from tangential orientations in the superficial WM to radial orientations in the cortex. In this section we try to model this transition.
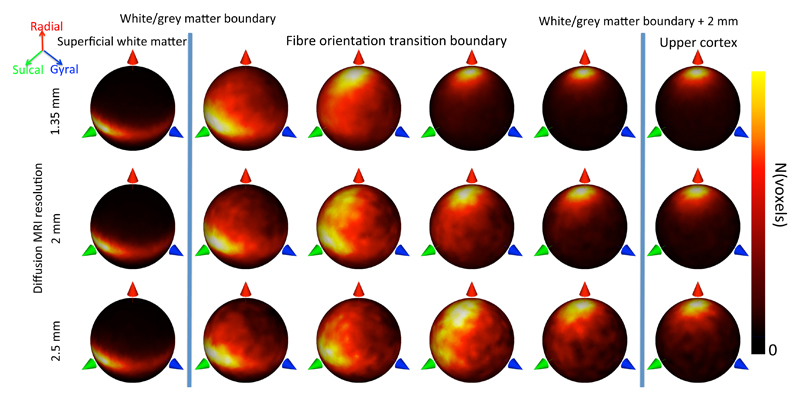
Any MRI measure at this boundary is potentially sensitive to partial volume between white and grey matter. First, we investigate this sensitivity by exploring the fibre orientation patterns across different spatial resolutions. We extracted fibre orientations independently from three diffusion MRI datasets acquired on the same subject at 2.5, 2, and 1.35 mm isotropic spatial resolution using a Siemens Prisma 3T clinical scanner. Except for the spatial resolution, the acquisition protocol for these data closely matches the HCP data acquisition and was pre-processed using the HCP pipelines (see Appendix A). Irrespective of the data resolution, fibre orientations were found to be consistently tangential in the white matter (left in Figure 7). Interestingly, the transition from tangential white matter to radial grey matter orientations shifts to more superficial layers as the resolution of the data increases (Figure 7). In the rest of this section we further quantify this fibre orientation transition boundary across the cortex and its dependence on the spatial resolution of the data.
Figure 7.
Transition from tangential fibres in superficial WM (left) to radial fibres in the cortex (right) for diffusion MRI data acquired on the same subject at 1.35, 2, and 2.5 mm resolution. Each heatmap in the fibre orientation transition boundary represents a cortical depth level sampled at steps of 0.5 mm.
The predominance of tangential fibre orientations in the white matter and radial fibre orientations in the cortical grey matter suggests that we can describe the transition between these two regimes by a sigmoidal function:
| (3) |
where rpred,k is the predicted radial index, defined as the radial coordinate of the primary diffusion tensor eigenvector, for a voxel k that is a distance di from the white/grey matter boundary. The transition from a radial index of 0 in the white matter to 1 in the cortex is determined by two variables: an offset oj from the white/grey matter boundary and a width wj, which are defined across the cortical surface for every vertex j. For every voxel k we use in [3] the offset and width are defined at the nearest vertex j.
The predicted radial index is fitted to the observed radial coordinate of the primary eigenvector using a minimum least-squares approach, with the offset and width parameters treated as unknowns. Many vertices will have too few voxels associated with them to provide adequate constraints on the sigmoidal fit. So in addition to fitting the data we added a regularization term that smooths the offset and width of the transition across the surface:
| (4) |
where the weighting of the regularization λ is set to 1. This value was determined using cross-validation, as having the best predictive power for unseen data points in dataset of a representative HCP subject.
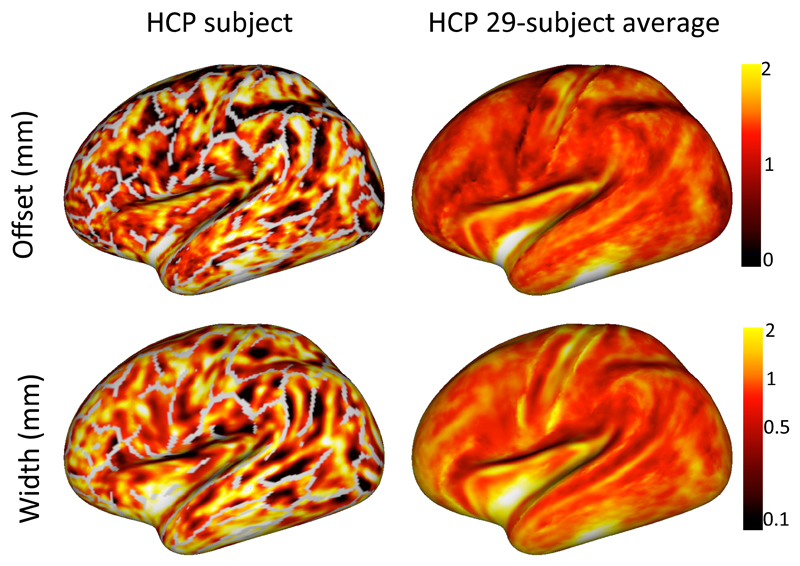
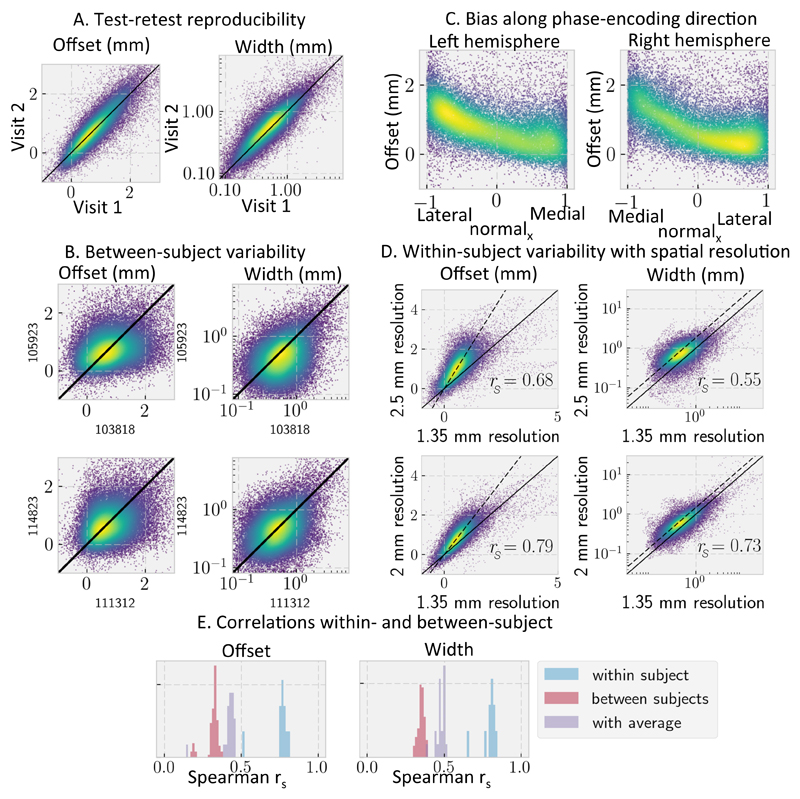
This fit provides for every surface element in the sulcal walls and fundi an estimate of the offset and width of the transition boundary with respect to the WM/GM boundary, as derived from a segmentation of an anatomical reference (e.g. T1-weighted) (Figure 8). Gyral crowns were excluded, because they typically do not show a sharp transition between the fibre orientations in the cortex and superficial white matter. Despite the offset and width typically being smaller than the HCP diffusion MRI resolution of 1.25 mm, both the offset and width were well reproduced between multiple datasets of the same subject (Figure 9A) as long as the datasets have the same spatial resolution. However, as illustrated in Figure 7 the observed transition does shift to more superficial layers with diffusion MRI data acquired at lower spatial resolutions (Figure 9B). This suggests that the transition boundary location and width are a qualitative measure that can only be meaningfully compared between datasets acquired at the same spatial resolutions. If we compare the offset and width between datasets at the same spatial resolution we do find Spearman correlations around 0.4 between subjects (Figure 9D), which is significantly lower than the within-subject Spearman correlations around 0.7 (Figure 9E).
Figure 8.
Maps of the transition offset from the WM/GM boundary (top) and the width of the transition boundary (bottom) for a single HCP subject (left) and a 29-subject average (right). The grey lines on the single-subject surface indicate the gyral crowns, where there is no sharp transition in fibre orientations. Note that in some regions (e.g., the insula) there are insufficient voxels with a radial orientation for an accurate fit, which leads to very high transition offset and width in these regions.
Figure 9.
Correlation in the fibre orientation transition boundary offset from the white/grey matter boundary and the transition width for various acquisition parameters within the same subject and for the same acquisition between subjects. A) Within-subject variability in an HCP subject using the retest dataset; B) Variability between two sets of HCP subjects; C) Correlation between the x-component of the surface normal and the offset between the transition and white/grey matter boundary for an HCP subject; D) Within-subject variability for DTI orientations measured at three different spatial resolutions (1.35, 2, and 2.5 mm resolution). The black lines show the expected trend if the transition offset and width are the same expressed in mm (solid) or voxels (dashed); E) Distribution of Spearman’s rank correlation within individual HCP subjects (blue), between subjects (red), and between individual subjects and a 29-subject average (purple).
In addition to the effect of spatial resolution, we also observed an interesting bias in the offset parameter as a function of the x-component of the surface normal (which in this dataset corresponds to the direction of phase-encoding, Figure 9C). For data with anterior-posterior phase encoding the bias is seen along the y-axis instead. Whilst the cause of such bias is likely due to blurring along the phase-encoding direction, a full characterization of the causes and consequences (e.g. for tractography) is beyond the scope of this paper. The fact that most of the variability in the offset can be explained by this blurring is suggestive of the uniformity of this transition from tangential to radial orientations across the cortex.
4. Discussion
In this paper we propose a new gyral coordinate system, which extends the earlier definitions of a radial orientation in the cortex (McKinstry et al. 2002; Leuze et al. 2014; Kleinnijenhuis et al. 2015) in two ways. First, we extend the single radial orientation to a gyral coordinate system of three orthonormal orientations (radial, sulcal, and gyral, see Figure 3). Secondly, we define this coordinate system not only in the cortex, but also throughout superficial white matter. Importantly, the definition of the gyral coordinate system does not depend on the diffusion MRI data, but only on the cortical surface (i.e., the white/grey matter boundary and pial surface) extracted from a T1-weighted image (Fischl 2012). Despite this blindness to diffusion data, the gyral coordinate system is highly predictive of the diffusion tensors and fibre orientations extracted from diffusion MRI data. In the cortex we confirm that apparent diffusion tends to be larger in the radial direction with no preferred orientation identified in the tangential plane (Figure 5). In superficial white matter apparent diffusion is found to be largest along the sulcal axis (i.e., tangential to the surface and parallel to the sulcal depth gradient). The diffusivity in this direction is typically 20% larger than in the gyral direction (i.e., tangential to the surface and orthogonal to the sulcal depth gradient) and about twice as large as along the radial and tangential orientations in the white matter (Figure 6C). This low diffusion in the radial orientation is reflected in the fibre orientations estimated by a crossing fibre model (FSL’s bedpostX), which are nearly all confined to the tangential plane (i.e., 50% of fibre orientations within 7 degrees of the tangential plane, 95% within 45 degrees; Figure 6B).
Despite this excellent alignment, some limitations of the adopted algorithm should be mentioned. By depending fully on the orientation of the triangular meshes representing the WM/GM boundary and the pial surfaces, the gyral coordinate system is very sensitive to any errors in this reconstruction as seen around the “dimple” in the gyral crown in Figure 3. We believe that one of the more efficient ways to improve the alignment between the gyral coordinates and observed diffusion data would be to further refine these meshes.
Another limitation arises at points equidistant to three differently oriented surfaces. While the linear interpolation ensures a smooth transition between two surfaces, it cannot do so with three surfaces, which leads to a sharp discontinuity in the gyral coordinates. This arises most commonly close to the gyral crown, where there is a discontinuity between gyral coordinates determined by the sulcal walls to those determined by the gyral crown. In the adopted algorithm this discontinuity happens close to the gyral crown (e.g., the voxel marked by the arrow in Figure 3 still has gyral coordinates determined by the sulcal walls; also see Figure B1). Hence the alignment with the gyral coordinates for voxels just below the WM/GM boundary of the gyral crown should be interpreted with great care. See St-Onge et al. (2017) for an alternative algorithm to predict fibre orientations in the superficial white matter, which achieves a mean angular offset of ~30 degrees in this region close to the gyral crown.
Within gyral white matter, the gyral coordinates are not only predictive of the orientation of the best-fit diffusion tensor, but might have an interesting interpretation. Radial fibres run directly towards or from the sulcal fundi or walls (fibres running towards the gyral crown are classified as sulcal rather than radial). Hence, the low radial diffusion found throughout superficial white matter (Figure 6C, D) suggests that the major fibre bundles tend to approach the sulcal fundi and walls under oblique angles and only become fully radial within the cortex. This oblique approach has been previously observed in myelin-stained histological sections (Budde and Annese 2013; Van Essen et al. 2014) and proposed as a main cause of the bias of tractography streamlines to terminate at the gyral crown rather than sulcal walls or fundi (Van Essen et al. 2014; Reveley et al. 2015 ; Schilling et al. 2017).
When interpreting this lack of radial orientations, it is important to note that white matter in the gyral folds tends to be very narrow. The white/grey matter boundaries of two opposite sulcal walls are typically only 2 to 4 mm apart from each other. Therefore, even fibres connecting opposite banks of a gyrus (such as between the massively interconnected V1 and V2; Van Essen et al. 1986) are expected to be at least somewhat oblique unless they connect points that are exactly opposite each other. This geometric constraint might account for the mostly tangential fibres found in the white matter. It should also be noted that diffusion MRI is only sensitive to the average orientations of large number of axons. So our observation of nearly exclusive tangential fibre orientations, does not exclude that there might be a dispersion of axon orientations in more radial directions. Nonetheless, the paucity of quasi-radial fibre bundles in relation to known anatomical connectivity remains puzzling and represents a challenge for tractography’s ability to accurately estimate cortico-cortical connectivity.
Within gyral white matter any fibre bundles connecting the sulcal walls and gyral crowns with the rest of the brain must run at least partly along the sulcal depth gradient to reach the deep white matter. Interestingly, this suggests that the gyral coordinate system can be used to classify fibres as within-gyrus fibres, which run predominantly along the “gyral” axis to other regions in the same gyrus, or between-gyri fibres, which run predominantly along the “sulcal” axis to other gyri and the rest of the brain. Hence, this classification could be used to separately study these within-gyrus and between-gyri connections. Throughout most of the superficial white matter we find that the diffusivity along the sulcal axis is typically larger than along the gyral axis after averaging over 29 subjects, particularly in the gyral white matter (Figure 6).
While axons from the frontal, parietal, and occipital lobes can reach deep white matter by travelling along the sulcal depth gradient, this is not true in the temporal lobe. Here axons need to follow a tract like the inferior longitudinal fasciculus perpendicular to the sulcal depth gradient to reach deep white matter and the rest of the brain. This might explain the alignment of the first diffusion tensor eigenvector with the gyral rather than sulcal axis observed in large part of the temporal lobe (top row in Figure 4).
In the cortical gray matter many previous studies have noted the tendency of the primary eigenvector of the best-fit diffusion tensor to line up with the radial orientation (e.g., McKinstry et al. 2002; Leuze et al. 2014; Kleinnijenhuis et al. 2015), we further quantify this trend by computing the ratio of the diffusivity along the radial axis and the average along the tangential plane (Figure 5C,D). This measure of radiality shows a slight decrease in the sulcal fundi, which is likely caused by the predominance of U-fibres within the lower part of the cortex (e.g., Budde and Annese 2013). More striking is the large drop in Brodmann area 3, where the diffusion in the tangential plane becomes even larger than along the radial axis. This has been reported before as tangential fibres in the primary somato-sensory cortex (Anwander, Pampel, and Knosche 2010; McNab et al. 2013; Calamante et al. 2017). We find that this region of decreased radiality overlaps nearly perfectly with the borders of Brodmann areas 3, which had been defined based on the cortical folding by Fischl et al. (2008) (Figure 5D). In Brodmann area 4 we find an increase in the radiality, which once again overlaps very well with the borders from Fischl et al. (2008). Calamante et al. (2017) report a similar increase in the cortical apparent fibre density (Raffelt et al. 2012) estimated from multi-shell multi-tissue constrained spherical deconvolution (Jeurissen et al. 2014). While this increase in apparent fibre density was also observed in many other regions with an increased cortical myelin, our measure of radial over tangential diffusivity appears much more specific to Brodmann area’s 3 and 4.
We use this dichotomy of mostly tangential orientations in white matter versus mostly radial orientations in the cortex to extract the fibre transition boundary. The dependence of the location and width of this transition boundary on the spatial resolution suggests that it is a qualitative measure that can only be usefully compared between datasets with the same resolution. However, even after the distortion correction using FSL’s eddy (Andersson and Sotiropoulos 2016a), systematic offsets between the white/grey matter boundary and the transition boundary remain along the phase-encoding direction. This residual misalignment might be explained by the dependence of the susceptibility field on head position (Sulikowska et al. 2014; Liu et al. 2017), which will be corrected for in future versions of eddy. Irrespective of the cause, this systematic misalignment suggests that surface analyses in diffusion MRI space might benefit from using surfaces defined in diffusion MRI space (such as the transition boundary) rather than directly registering surface from structural MRI to diffusion space.
Supplementary Material
Acknowledgments
MC is supported by the EPSRC UK (EP/L023067). MB is supported by the European Research Council under the European Union's Seventh Framework Programme (FP/2007-2013/ERC Grant Agreement no. 319456). SJ is supported by the MRC UK (Grant Ref: MR/L009013/1). The Wellcome Centre for Integrative Neuroimaging is supported by core funding from the Wellcome Trust (203139/Z/16/Z). Primate studies were supported in part by the National Institutes of Health, Bethesda, MD, USA; grants HD052664, HD37100, and HD062171; and by DA 05072 and 8P51OD011092 for the operation of the Oregon National Primate Research Center.
Footnotes
A github repository containing code for generating gyral coordinates is available at https://git.fmrib.ox.ac.uk/ndcn0236/gyralcoord.
A single outlier subject with a median angular offset of 43 degrees was excluded from this and any further analysis
References
- Andersson JL, Skare S, Ashburner J. How to Correct Susceptibility Distortions in Spin-Echo Echo-Planar Images: Application to Diffusion Tensor Imaging. Neuroimage. 2003;20(2):870–88. doi: 10.1016/S1053-8119(03)00336-7. [DOI] [PubMed] [Google Scholar]
- Andersson JL, Sotiropoulos SN. An Integrated Approach to Correction for Off-Resonance Effects and Subject Movement in Diffusion MR Imaging. Neuroimage. 2016a Jan;125:1063–78. doi: 10.1016/j.neuroimage.2015.10.019. [DOI] [PMC free article] [PubMed] [Google Scholar]
- Andersson JL, Sotiropoulos SN. An Integrated Approach to Correction for Off-Resonance Effects and Subject Movement in Diffusion MR Imaging. Neuroimage. 2016b Jan;125:1063–78. doi: 10.1016/j.neuroimage.2015.10.019. [DOI] [PMC free article] [PubMed] [Google Scholar]
- Anwander Alfred, Pampel André, Knosche TR. In Vivo Measurement of Cortical Anisotropy by Diffusion-Weighted Imaging Correlates with Cortex Type. Proc Int Soc Magn Reson Med. 2010;18:109. [Google Scholar]
- Bastiani Matteo, Oros-Peusquens Ana-Maria, Seehaus Arne, Brenner Daniel, Moellenhoff Klaus, Celik Avdo, Felder Jörg, et al. Automatic Segmentation of Human Cortical Layer-Complexes and Architectural Areas Using Diffusion MRI and Its Validation. Frontiers in Neuroscience. 2016;10:487. doi: 10.3389/fnins.2016.00487. [DOI] [PMC free article] [PubMed] [Google Scholar]
- Behrens TE, Berg HJ, Jbabdi S, Rushworth MF, Woolrich MW. Probabilistic Diffusion Tractography with Multiple Fibre Orientations: What Can We Gain? Neuroimage. 2007;34(1):144–55. doi: 10.1016/j.neuroimage.2006.09.018. [DOI] [PMC free article] [PubMed] [Google Scholar]
- Brambrink AM, Back SA, Riddle A, Gong X, Moravec MD, Dissen GA, Creeley CE, Dikranian KT, Olney JW. Isoflurane-Induced Apoptosis of Oligodendrocytes in the Neonatal Primate Brain. Ann Neurol. 2012;72(4):525–35. doi: 10.1002/ana.23652. [DOI] [PMC free article] [PubMed] [Google Scholar]
- Budde MD, Annese J. Quantification of Anisotropy and Fiber Orientation in Human Brain Histological Sections. Front Integr Neurosci. 2013;7:3. doi: 10.3389/fnint.2013.00003. [DOI] [PMC free article] [PubMed] [Google Scholar]
- Calamante F, Jeurissen B, Smith RE, Tournier JD, Connelly A. The Role of Whole-Brain Diffusion MRI as a Tool for Studying Human in Vivo Cortical Segregation Based on a Measure of Neurite Density. Magn Reson Med. 2017 Sep; doi: 10.1002/mrm.26917. [DOI] [PubMed] [Google Scholar]
- Creeley CE, Dikranian KT, Dissen GA, Back SA, Olney JW, Brambrink AM. Isoflurane-Induced Apoptosis of Neurons and Oligodendrocytes in the Fetal Rhesus Macaque Brain. Anesthesiology. 2014;120(3):626–38. doi: 10.1097/ALN.0000000000000037. [DOI] [PMC free article] [PubMed] [Google Scholar]
- Dale AM, Fischl B, Sereno MI. Cortical Surface-Based Analysis. I. Segmentation and Surface Reconstruction. Neuroimage. 1999;9(2):179–94. doi: 10.1006/nimg.1998.0395. [DOI] [PubMed] [Google Scholar]
- Deipolyi AR, Mukherjee P, Gill K, Henry RG, Partridge SC, Veeraraghavan S, Jin H, et al. Comparing Microstructural and Macrostructural Development of the Cerebral Cortex in Premature Newborns: Diffusion Tensor Imaging versus Cortical Gyration. Neuroimage. 2005;27(3):579–86. doi: 10.1016/j.neuroimage.2005.04.027. [DOI] [PubMed] [Google Scholar]
- Fischl B. FreeSurfer. Neuroimage. 2012;62(2):774–81. doi: 10.1016/j.neuroimage.2012.01.021. [DOI] [PMC free article] [PubMed] [Google Scholar]
- Fischl B, Rajendran N, Busa E, Augustinack J, Hinds O, Yeo BT, Mohlberg H, Amunts K, Zilles K. Cortical Folding Patterns and Predicting Cytoarchitecture. Cereb Cortex. 2008;18(8):1973–80. doi: 10.1093/cercor/bhm225. [DOI] [PMC free article] [PubMed] [Google Scholar]
- Fischl B, Sereno MI, Dale AM. Cortical Surface-Based Analysis. II: Inflation, Flattening, and a Surface-Based Coordinate System. Neuroimage. 1999;9(2):195–207. doi: 10.1006/nimg.1998.0396. [DOI] [PubMed] [Google Scholar]
- Glasser MF, Sotiropoulos SN, Wilson JA, Coalson TS, Fischl B, Andersson JL, Xu J, et al. The Minimal Preprocessing Pipelines for the Human Connectome Project. Neuroimage. 2013 Oct;80:105–24. doi: 10.1016/j.neuroimage.2013.04.127. [DOI] [PMC free article] [PubMed] [Google Scholar]
- Jbabdi S, Sotiropoulos SN, Savio AM, Graña M, Behrens TE. Model-Based Analysis of Multishell Diffusion MR Data for Tractography: How to Get over Fitting Problems. Magn Reson Med. 2012;68(6):1846–55. doi: 10.1002/mrm.24204. [DOI] [PMC free article] [PubMed] [Google Scholar]
- Jeurissen B, Tournier JD, Dhollander T, Connelly A, Sijbers J. Multi-Tissue Constrained Spherical Deconvolution for Improved Analysis of Multi-Shell Diffusion MRI Data. Neuroimage. 2014 Dec;103:411–26. doi: 10.1016/j.neuroimage.2014.07.061. [DOI] [PubMed] [Google Scholar]
- Jones DK. Determining and Visualizing Uncertainty in Estimates of Fiber Orientation from Diffusion Tensor MRI. Magn Reson Med. 2003;49(1):7–12. doi: 10.1002/mrm.10331. [DOI] [PubMed] [Google Scholar]
- Kleinnijenhuis M, van Mourik T, Norris DG, Ruiter DJ, van Cappellen van Walsum AM, Barth M. Diffusion Tensor Characteristics of Gyrencephaly Using High Resolution Diffusion MRI in Vivo at 7T. Neuroimage. 2015 Apr;109:378–87. doi: 10.1016/j.neuroimage.2015.01.001. [DOI] [PubMed] [Google Scholar]
- Leuze CW, Anwander A, Bazin PL, Dhital B, Stüber C, Reimann K, Geyer S, Turner R. Layer-Specific Intracortical Connectivity Revealed with Diffusion MRI. Cereb Cortex. 2014;24(2):328–39. doi: 10.1093/cercor/bhs311. [DOI] [PMC free article] [PubMed] [Google Scholar]
- Liu Jiaen, de Zwart Jacco, van Gelderen Peter, Duyn Jeff. Motion-Induced Magnetic Field Changes inside the Brain. International Society for Magnetic Resonance in Medicine; 2017. [Google Scholar]
- McKinstry RC, Mathur A, Miller JH, Ozcan A, Snyder AZ, Schefft GL, Almli CR, Shiran SI, Conturo TE, Neil JJ. Radial Organization of Developing Preterm Human Cerebral Cortex Revealed by Non-Invasive Water Diffusion Anisotropy MRI. Cereb Cortex. 2002;12(12):1237–43. doi: 10.1093/cercor/12.12.1237. [DOI] [PubMed] [Google Scholar]
- McNab JA, Polimeni JR, Wang R, Augustinack JC, Fujimoto K, Stevens A, Triantafyllou C, et al. Surface Based Analysis of Diffusion Orientation for Identifying Architectonic Domains in the in Vivo Human Cortex. Neuroimage. 2013 Apr;69:87–100. doi: 10.1016/j.neuroimage.2012.11.065. [DOI] [PMC free article] [PubMed] [Google Scholar]
- Raffelt D, Tournier JD, Rose S, Ridgway GR, Henderson R, Crozier S, Salvado O, Connelly A. Apparent Fibre Density: A Novel Measure for the Analysis of Diffusion-Weighted Magnetic Resonance Images. Neuroimage. 2012;59(4):3976–94. doi: 10.1016/j.neuroimage.2011.10.045. [DOI] [PubMed] [Google Scholar]
- Reveley C, Seth AK, Pierpaoli C, Silva AC, Yu D, Saunders RC, Leopold DA, Ye FQ. Superficial White Matter Fiber Systems Impede Detection of Long-Range Cortical Connections in Diffusion MR Tractography. Proc Natl Acad Sci U S A. 2015 May; doi: 10.1073/pnas.1418198112. [DOI] [PMC free article] [PubMed] [Google Scholar]
- Schilling K, Gao Y, Janve V, Stepniewska I, Landman BA, Anderson AW. Confirmation of a Gyral Bias in Diffusion MRI Fiber Tractography. Hum Brain Mapp. 2017 Dec; doi: 10.1002/hbm.23936. [DOI] [PMC free article] [PubMed] [Google Scholar]
- Sotiropoulos SN, Jbabdi S, Xu J, Andersson JL, Moeller S, Auerbach EJ, Glasser MF, et al. Advances in Diffusion MRI Acquisition and Processing in the Human Connectome Project. Neuroimage. 2013 Oct;80:125–43. doi: 10.1016/j.neuroimage.2013.05.057. [DOI] [PMC free article] [PubMed] [Google Scholar]
- St-Onge E, Daducci A, Girard G, Descoteaux M. Surface-Enhanced Tractography (SET) Neuroimage. 2017 Dec; doi: 10.1016/j.neuroimage.2017.12.036. [DOI] [PubMed] [Google Scholar]
- Sulikowska Aleksandra, Wharton Samuel, Glover Paul M, Bowtell Richard, Gowland Penny A. Will Field Shifts Due to Head Rotation Compromise Motion Correction. International Society for Magnetic Resonance in Medicine; 2014. [Google Scholar]
- Truong TK, Guidon A, Song AW. Cortical Depth Dependence of the Diffusion Anisotropy in the Human Cortical Gray Matter in Vivo. PLoS One. 2014;9(3):e91424. doi: 10.1371/journal.pone.0091424. [DOI] [PMC free article] [PubMed] [Google Scholar]
- Uğurbil K, Xu J, Auerbach EJ, Moeller S, Vu AT, Duarte-Carvajalino JM, Lenglet C, et al. Pushing Spatial and Temporal Resolution for Functional and Diffusion MRI in the Human Connectome Project. Neuroimage. 2013 Oct;80:80–104. doi: 10.1016/j.neuroimage.2013.05.012. [DOI] [PMC free article] [PubMed] [Google Scholar]
- Van Essen DC, Glasser MF, Dierker DL, Harwell J, Coalson T. Parcellations and Hemispheric Asymmetries of Human Cerebral Cortex Analyzed on Surface-Based Atlases. Cereb Cortex. 2012;22(10):2241–62. doi: 10.1093/cercor/bhr291. [DOI] [PMC free article] [PubMed] [Google Scholar]
- Van Essen DC, Jbabdi S, Sotiropoulos SN, Chen C, Dikranian K, Coalson T, Harwell J, Behrens TEJ, Glasser MF. Mapping Connections in Humans and Non-Human Primates: Aspirations and Challenges for Diffusion Imagining. In: Johansen-Berg H, Behrens TEJ, editors. Diffusion MRI: From Quantitative Measurement to In-Vivo Neuroanatomy. Elsevier Science; 2014. pp. 337–58. [Google Scholar]
- Van Essen DC, Newsome WT, Maunsell JH, Bixby JL. The Projections from Striate Cortex (V1) to Areas V2 and V3 in the Macaque Monkey: Asymmetries, Areal Boundaries, and Patchy Connections. J Comp Neurol. 1986;244(4):451–80. doi: 10.1002/cne.902440405. [DOI] [PubMed] [Google Scholar]
- Van Essen DC, Smith SM, Barch DM, Behrens TE, Yacoub E, Ugurbil K, WU-Minn HCP Consortium The WU-Minn Human Connectome Project: An Overview. Neuroimage. 2013 Oct;80:62–79. doi: 10.1016/j.neuroimage.2013.05.041. [DOI] [PMC free article] [PubMed] [Google Scholar]
- Waehnert MD, Dinse J, Weiss M, Streicher MN, Waehnert P, Geyer S, Turner R, Bazin PL. Anatomically Motivated Modeling of Cortical Laminae. Neuroimage. 2014 Jun;93(Pt 2):210–20. doi: 10.1016/j.neuroimage.2013.03.078. [DOI] [PubMed] [Google Scholar]
Associated Data
This section collects any data citations, data availability statements, or supplementary materials included in this article.


