

Abstract
Objective:
To evaluate image quality and radiation dose exposure of low-kV (100 kV) and low contrast medium (CM) volume CT angiography (CTA) in patients candidate to Transcatheter Aortic Valve Implantation (TAVI), in comparison with standard CTA protocol.
Methods:
79 patients candidate for TAVI were prospectively enrolled in this study and examined with 256-MDCT. 42 patients were evaluated using study-group protocol (100 kV; whole-body retrospective ECG-gating; with 50 ml of CM; iterative reconstruction algorithm) while 37 patients underwent a standard CTA study (120 kV; ECG-gating for chest; 100 ml of CM; FBP reconstruction). Overall image quality was evaluated using a 4-point scale. Vascular enhancement (HU) was then assessed in each patient by manually drawing multiple ROIs in lumen of 7 segments of the whole aorta. The radiation dose exposure of both groups was calculated and all data were compared and statistically analyzed.
Results:
On low-kV protocol, higher mean attenuation values were achieved in all the measurements as compared to standard protocol. There were no significant differences in the image quality evaluation in both groups. Mean radiation dose value of study group was significantly lower than in control group (reduction of 20%).
Conclusion:
Low kV and low CM volume CTA protocols allow TAVI planning to be carried out with high quality images and a significant reduction in the radiation dose as compared to the standard CTA protocol.
Advances in knowledge:
Low-kV CTA for pre-operative assessment of patients candidates for TAVI, permits to achieve a significant reduction of radiation dose exposure and contrast medium volume, reducing the risk of contrast induced nephropathy.
introduction
Aortic valve stenosis is a common disease and frequently affects aged patients.1, 2 In severe and symptomatic stenosis, aortic valve replacement is indicated, whereas untreated patients have poor prognosis.3–5 Recently, transcatheter aortic valve implantation (TAVI) procedure has become increasingly employed as an alternative technique to the standard surgical aortic valve replacement, in patients with contraindications to surgery or with high surgical risk.1, 6 Typically, the preferred implantation route is transfemoral but, if it is not suitable because of patient characteristics, valve can be implanted via the subclavian artery or with an aortic or apical approach.1, 7 Whether a femoral, subclavian, aortic or apical approach is used, accurate analysis and measurements of thoracoabdominal vascular structures are relevant in valves type and patient selection.1, 3,6 All these data can be obtained with different imaging techniques such as echocardiography (both trans-thoracic and trans-esophageal), cardiac magnetic resonance, fluoroscopy, coronary angiography and cardiac catheterization.
Multidetector CT angiography (MDCT) is an accurate and fast technique to get pre-procedural information for TAVI,1,3,6,8–10 allowing a more comprehensive assessment of the relationship between coronary arteries, annulus and valve leaflets, combined with the information about aortic root morphology, dimensions and angle of deployments.3, 7 Furthermore, the multiplanar capabilities of MDCT allow a complete 3D assessment of vascular access site suitability and prevent possible complications (i.e. calcium embolization, arterial rupture or dissection) providing information on arteries structure.3, 7
The first problem in obtaining a diagnostic examination in TAVI protocol is the need for an ECG-synchronization to study the aortic valve and ascending aorta without motion artefact,1 that leads to a split of the acquisition protocol in a ECG-synchronized part for the thoracic and a non-gated one for the abdominal tract, requiring additional time for the CT scanner to switch between the two protocols. Secondly, there is a large acquisition volume, going from the subclavian arteries to the femoral ones. Therefore, in order to obtain good quality images of the entire aorta, an increase of contrast medium (CM) volume is mandatory, but the large amount of CM represents another issue because several studies showed that the contrast-induced nephropathy (CIN) of renal function directly depends on the amounts of contrast medium.11–15 Moreover, patients with aortic stenosis generally tend to be aged1, 2 and with other co-morbidities, such as chronic kidney disease and diabetes, that could increase the risk of CIN.
Lowering the tube voltage approaches the K-edge of iodine, leading to a greater attenuation levels of iodinated contrast medium due to greater photoelectric effect and decreased Compton scattering.16–23 Consequently, it is possible to reduce the CM volume while obtaining the same vessels attenuation, leading to a high attenuation difference between the arterial system and poorly enhanced surrounding tissues that can partially offset the higher image noise (caused by the kV reduction without an equal mAs increment) while maintaining the subjective image quality.17, 22 This technology is well matched in the dual energy CT protocols, which allows radiologists to acquire CT angiography examinations using low contrast medium volume due to the use of different kV-setting (i.e. 70 and 140 kVp), obtaining a very good contrast enhancement and final high diagnostic images.24 But, not all radiology departments have the dual-energy CT scanner and most of them are still using the “standard” MDCT scanners.
Furthermore, the use of new iterative reconstruction algorithms (IR) that can reduce the image noise allows one to obtain an equivalent or improved image quality from a low-kV protocol (80–100 kV), compared to Filtered Back Projection (FBP) algorithms.25, 26
Finally, according to ALARA principle (As Low As Reasonably Achievable), lowering the tube voltage (kV) allows one to exponentially reduces the radiation dose exposure of the patient, because the dose change with the square of tube voltage.17–20
Our purpose is to maintain adequate diagnostic image quality, reducing the radiation dose exposure (100 kV) as well as the contrast medium volume (50 ml), in CT angiography (CTA) study in patients candidate to transcatheter aortic valve implantation, using the iterative reconstruction algorithms technique, in comparison with standard CT angiography protocol (120 kV, 100 ml of CM, Filtered Back Projection).
METHODS AND materialS
Study population
This study was performed in a single university center, approved by our institutional review board and a written informed consent was obtained from all patients.
A total of 79 consecutive patients (39 males; mean age 79.2 years, range 67–90 years), candidate for TAVI, were prospectively enrolled in our study.
We randomly divided patients in two groups, during the admission at our Institution, 42 patients (study group; 19 males; mean age 82.6 years, range 79–90 years) were evaluated using low-kV (100 kV), low volume (50 ml) of iso-osmolar contrast medium (350 mgI ml−1), retrospective ECG-gated protocol and automated tube current modulation, while 37 patients (control group; 20 males; mean age 75.8 years, range 67–88 years) underwent a standard CTA study (120 kV; 100 ml of iso-osmolar CM; retrospective ECG-gated protocol; automated tube current modulation). In study group, Iterative Reconstruction (iDose4 Level 4, Philips Healthcare, Cleveland, OH) was used to process raw images data, whereas control group raw data were reconstructed with a standard Filtered Back Projection technique.
Exclusion criteria for contrast-enhanced CT examination were: (a) patients with renal failure (eGFR <30 mL/min/1.73 m2) or other contraindications for iodinated contrast material, such as previous allergic reaction; (b) heart rate >100 beats per minute (bpm); (c) body mass index (BMI) ≥30 at the time of the examination; (d) failure to do an inspiratory apnea.
In order to obtain a feasible CTA protocol, useful to evaluate all non-obese patients in the clinical practice, the included patients were not stratified in different categories according to BMI values.
Study group CT angiography protocol
All patients were examined with a 256-MDCT (iCT, Philips Medical Systems, Best, The Netherlands) using a low dose radiation protocol with 100 kV and automated tube-current modulation, with a single ECG-gated acquisition from the upper level of the clavicles to initial femoral head and with the following scan parameters: thickness 1 mm; increment 1 mm; collimation 96 × 0.625; pitch 0.915; rotation time 0.44 s; FOV 350; matrix 512 × 512.
In each patient an 18-gauge intravenous catheter was placed in an antecubital vein in the upper limb, and contrast medium (CM) was injected using a double-syringe injector (Medrad Stellant, Pittsburgh, PA). In order to obtain an optimal intraluminal contrast enhancement, the start of scanning was individually obtained for each patient by using bolus-tracking (B-T) technique, with a trigger level of 120 HU and a delay time between 5 to 7 s. The trigger area was manually placed at the top of the ascending aorta, in order to reduce the time needed for the CT bed to reach the starting level of acquisition. In all 42 patients of this group, low contrast medium volume (50 ml; Xenetix 350, 350 mgI ml−1, Guerbet Aulnay, France) was administered, with a flow rate of 3.5 ml s−1 followed by saline flushing (50 ml; flow rate 3.5 ml s−1).
In the evaluation of thoracic aorta, in order to minimize motion artifacts due to cardiac pulsation, we used a retrospective ECG-gated protocol with ECG-based tube modulation.
Moreover, to use a low CM volume, we maintain the same ECG-gated protocol also for abdominal aorta, because it’s possible to reduce the scan time deleting the “switch-time” from the triggered protocol to the standard acquisition.
Control group CT angiography protocol
Control group patients were evaluated on the same 256-MDCT scanner, with a standard 120 kV protocol and automated tube-current modulation, with two acquisition, one ECG-gated for the thorax and one non-gated for the abdomen, and with the following scan parameters: thickness 1 mm; increment 1 mm; collimation 128 × 0.625; pitch 0.915 (0.17 for the chest); rotation time 0.4 s. (0.27 s for the chest); FOV 350; matrix 512 × 512.
The contrast medium administration protocol was the same of the study group, but we use a total of 100 ml of CM (Xenetix 350, 350 mgI ml−1) with a flow rate of 3.5 ml s−1, followed by saline flushing (50 ml; flow rate 3.5 ml s−1).
The same ECG-gating protocol of the study group was used to acquire only the thoracic aorta.
The coverage area for both thoracic and abdominal CTA studies was the same as in the study group.
Image analysis and radiation dose
Images were anonymized and processed on a dedicated workstation (Brilliance Workspace, Philips) in order to produce multiplanar reconstructions (thickness 2 mm; increment 1 mm; standardized smooth reconstruction kernel), maximum intensity projections (MIP) and volume rendering (VR) images.
Vessel contrast enhancement (mean attenuation value, HU) was measured in the axial native images, by manually placing a circular region of interest (ROI) in the center of vascular lumen at 4 different levels along z-axis in the thoracic as follows: (1) aortic valve plane; (2) ascending aorta; (3) aortic arch; (4) descending aorta. In the abdomen, ROIs were placed at 4 different levels as follow: (1) aorta (above celiac trunk); (2) aorta below renal arteries; (3) both common iliac arteries; (4) both external iliac arteries. The ROI’s size was as large as possible depending on arteries size and avoiding wall calcifications and thrombus. We also evaluated the vessel opacification after CM volume injection, considering adequate for diagnostic CTA a difference less than 50 HU in attenuation values among the different levels along z-axis.11 These methods of analysis were derived from previous studies.11,16,27–29
Two radiologists with 7 and 3 years of experience in CTA and 3D vascular images interpretation, blinded to scanning parameters and patient information, performed qualitative evaluations of the randomized 3D aortograms on VR and MIP-reconstructed images. For qualitative evaluation, the diagnostic quality of images and the visualization of major aortic branches were evaluated using a modification of previously proposed in literature11, 27,28 4 points subjective scale: 4 as “Excellent” (no artifacts and excellent visualization of boundary and major branches); 3 as “good” (good visualization of the boundary, minor artifacts especially in small branches and good visualization of major branches); 2 as “acceptable” (delineation of the boundary equivocal but within an acceptable range, minor artifacts and sufficient visualization of major branches); 1 as “low” (major artifacts, unsatisfactory delineation of the boundary or poor visualization of major branches).
To analyze the radiation dose exposure, the CT dose-length product (DLP, mGycm) and the CT dose index (CTDIvol, mGy) were recorded for all scans. We also calculated the effective radiation dose (ED) of thoraco-abdominal CTA, using the known formula ED = k · DLP,30 where DLP (mGym) is the dose-length product and k is the region-specific normalized effective dose (mSv/mGycm) derived from the paper by Deak et al.31 For both the study (100 kV) and control (120 kV) group we used a k of 0.0141 mSv/mGycm, as the mean between chest (k = 0.0144 mSv/mGycm), abdominal (k = 0.0151 mSv/mGycm) and pelvic (k = 0.0127 mSv/mGycm) k values.
Finally, we compared the image noise in the two groups by calculating the signal-to-noise ratio (SNR) using the following formula: mean attenuation values of the vessel (HU)/standard deviation (SD).
Statistical analysis
All statistical analysis was performed using commercially available software (Med Calc, Med Calc Software 14.8.1, Mariakerke, Belgium). The U Mann-Whitney test was used to evaluate differences between the study group (100 kV; 50 ml) and control group (120 kV; 100 ml) in terms of age, weight, mean attenuation values of the aorta (HU) and SNR. Using the same test, we also compared the radiation dose exposure (DLP and ED) and the image quality scores, between the two groups. A p-value < 0.05 was considered statistically significant.
The interobserver agreement of mean attenuation values and SNR was calculated using Intraclass Correlation Coefficient (ICC). Additionally, the inter observer agreement of image quality scores was determined by reliability statistics using ICC based on the Alpha (Cronbach) model. Agreement less than 0.61 was considered moderate, between 0.61 and 0.81 good and more than 0.81 very good, respectively.20
results
Patients’ characteristics
All CTA examinations were completed without any complications and without any adverse effect after contrast material injection. No β-blockers or heart-rate-lowering agents were administered before scanning.
The clinical characteristics of patients in each study and control group are summarized in Table 1 there were no statistically significant differences in terms of age, BMI and baseline HR between the two groups.
Table 1.
Patients characteristic
| Patients characteristics | Study group | Control group |
| No. of patients | 42 | 37 |
| Age, years (range) | 83.6 (78–89) | 84.3 (81–90) |
| Male, no. (%) | 19 (45) | 20 (54) |
| BMI, kg m−2 | 24.8 ± 2.9 | 25.4 ± 3.8 |
| HR, bpm | 73 ± 6.8 | 75 ± 8.7 |
| Sinus rhythm, no. (%) | 42 (100) | 37 (100) |
BMI, body mass index; HR, Heart rate (beats per minute).
Scan characteristics
The mean scan time was 18.28 ± 3.19 s (sec) for the study group and 23.9 ± 1.2 s for the control group, with a statistical difference between the two group (p = 0.011) (Figure 1). The mean scan range in study group was 66.51 ± 7.34 centimeters (cm), whereas in control group was 69.68 ± 4.38 cm with no statistical difference (p = 0.112) (Table 2).
Figure 1.

Box-plot graphics: Scan length and scan time for the study group and control group. The boxes represent the median, first and third quartile values of the scan length and scan time. The whiskers represent the lowest datum still within 1.5 interquartile range (IQR) of the lower quartile and the highest datum still within 1.5 IQR of the upper quartile.
Table 2. .
Scan characteristics of study and control group
| Scan characteristics | Study group | Control group | p-value |
| Scan range, cm | 66.51 ± 7.34 | 69.68 ± 4.38 | 0.112 |
| Scan time, seconds | 17.40 ± 2.09 | 22.66 ± 1.04 | 0.0002 |
| DLP, mGycm | 1600.3 ± 340.7 | 2044.5 ± 130.2 | <0.0001 |
| ED, mSv | 22.56 ± 5.8 | 28.82 ± 2.2 | <0.0001 |
All data are reported as mean value ± standard deviation.
DLP, dose-length product; ED, effective radiation dose (organ weighting factor k = 0.0141 mSv/mGycm).
Dose delivered
DLP and ED in the study group were significantly lower than those in the control group (p < 0.0001). In particular, mean DLP was 1600.29 ± 340.65 mGycm in the study group and 2044.53 ± 130.22 mGycm in the control one, while the mean ED were 22.56 ± 5.8 mSv and 28.82 ± 2.21 mSv, respectively (Table 2 and Figure 2). Compared with the control group, the study group showed an average of 20% reduction in the overall radiation dose.
Figure 2.
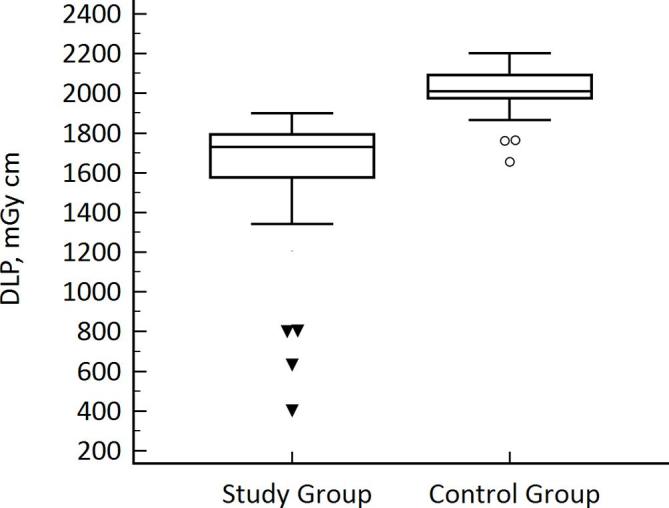
Box-plot graphic of DLP: Box represents median, first and third quartile values of radiation dose exposure between the two groups, expressed as dose-length-product. The whiskers represent the lowest datum still within 1.5 interquartile range (IQR) of the lower quartile and the highest datum still within 1.5 IQR of the upper quartile. Black triangles and white circles express the outlier values for study and control group (DLP significantly lower than whiskers), respectively. A DLP reduction of 20% was reached in study group compared to control one.
Image quality
No significant difference was reached in image quality rating scores of the two readers for the study and control groups, obtaining an average score of 3.48 ± 0.71 and 3.45 ± 0.67 (p = 0.378) respectively for first reader, and an average score of 3.45 ± 0.67 and 3.41 ± 0.62 (p = 0.621) for second reader (Figure 3). The Cronbach’s Alpha value for the interobserver agreement was good (0.8).
Figure 3.
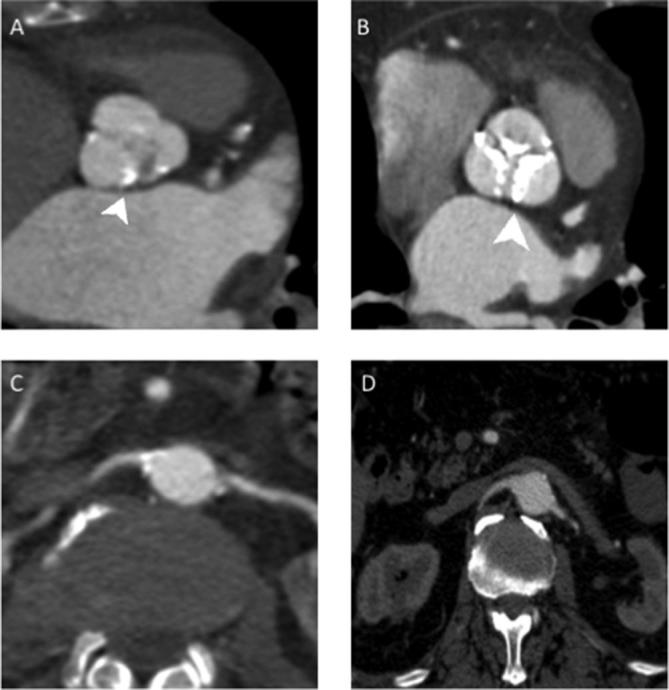
Aortic bulb and renal arteries images comparison between study group (A–C) and control group (B–D). (A) MPR reconstruction of aortic bulb from a study protocol acquisition; it is possible to see a part of “clover-shaped” image of aortic valve. (B) Same reconstruction as image A of a different patient in a standard protocol acquisition, it is possible to see the presence of calcification of all the three aortic leaflets (arrowhead). (C) Renal arteries in axial view in a study protocol examination. (D) Renal arteries in the same reconstruction in standard protocol examination. As we can see it was obtained a similar image quality in the two different protocol used for image acquisition. Therefore, it is possible to appreciate the same diagnostic value of the study protocol among the control one.
The intravessel density (HU) was higher in study group than in control group for each vessels level studied, with a significant statistical difference (p < 0.05) (Tables 3, 4 and Figure 4). The mean difference between the maximum and minimum attenuation values along the aortic z-axis did not differ significantly between study group and control group (p-value 0.49), with a value <50 HU indicating a uniform vascular opacification column for CTA performed with both protocols.
Table 3. .
First reader vessels enhancement evaluation
| Aortic tract analyzed | Study group (HU) | Control group(HU) | p-value |
| Aortic Valves | 347 ± 19.78 | 314.71 ± 23.76 | 0.0039 |
| Ascending Aorta | 356.4 ± 19.78 | 313.56 ± 20.56 | 0.002 |
| Aortic Arch | 351.7 ± 18.69 | 313.86 ± 20.20 | 0.0078 |
| Descending Aorta | 347.6 ± 18.86 | 306.79 ± 22.04 | 0.0011 |
| Celiac Trunk | 334.4 ± 27.8 | 301.94 ± 25.02 | 0.0054 |
| Below Renal Arteries | 326.3 ± 24.59 | 298.75 ± 24.65 | 0.0179 |
| Right Common Iliac Artery | 323.5 ± 20.69 | 290.49 ± 22.28 | 0.0059 |
| Left Common Iliac Artery | 322.2 ± 21.12 | 286.50 ± 20.90 | 0.0038 |
| Right external Iliac Artery | 321.2 ± 19.37 | 284.21 ± 18.46 | 0.0022 |
| Left external Iliac Artery | 319.5 ± 20.87 | 289.05 ± 17.76 | 0.009 |
All data are reported as mean value ± standard deviation.
Table 4. .
Second reader vessels enhancement evaluation
| Aortic tract analyzed | Study group (HU) | Control group (HU) | p-value |
| Aortic Valves | 349.44 ± 22.87 | 315.76 ± 21.85 | 0.036 |
| Ascending Aorta | 356.38 ± 22.81 | 313.63 ± 21.06 | 0.01 |
| Aortic Arch | 353.65 ± 20.80 | 314.54 ± 18.96 | 0.019 |
| Descending Aorta | 351.86 ± 22.30 | 306.25 ± 18.75 | 0.011 |
| Celiac Trunk | 340.42 ± 27.30 | 291.24 ± 24.28 | 0.003 |
| Below Renal Arteries | 339.55 ± 25.58 | 286.40 ± 23.20 | 0.0014 |
| Right common Iliac Artery | 340.39 ± 19.97 | 281.19 ± 20.11 | 0.01 |
| Left common Iliac Artery | 340.54 ± 21.76 | 278.02 ± 20.07 | 0.001 |
| Right external Iliac Artery | 332.19 ± 19.73 | 273.10 ± 17.55 | 0.001 |
| Left external Iliac Artery | 334.55 ± 21.05 | 272.62 ± 20.24 | 0.001 |
All data are reported as mean ± standard deviation.
Figure 4.

Box-Plot graphics of first reader mean attenuation evaluation. median, first and third quartile values of attenuation values at different aortic levels between the two groups. Whiskers represent the lowest and highest values of all measurements. (A) Aortic valves; (B) Aortic arch; (C) Below renal arteries; (D) Left common iliac artery.
The SNR of the study group (15.7 ± 2.11) was statistically higher than control group’s one (13.7 ± 1.42), with a p-value of 0.043.
A very good interobserver agreement level was found in the evaluation of attenuation value and SNR both in study group (ICC = 0.97) and in control group (ICC = 0.98).
discussion
The pre-procedural evaluations for transcatheter aortic valve implantation include a CT angiography (CTA) of the aorto-iliac tract to analyze the access patency, internal-luminal caliper, tortuosity, and wall calcification.1
Considering that TAVI is performed on a generally more elderly population, who typically has multiple comorbidities like diabetes and chronic kidney disease, the main problem in performing CTA is the amount of contrast medium volume used to obtain diagnostic images, because of the higher risk of this patients to develop a contrast induced nephropathy (CIN). Indeed, it is already known that CIN accounts for 11–12% of all cases of in-hospital acute kidney injury (AKI) and is also associated with an overall in-hospital mortality rate of 6%, as described by some papers.32–34 Beside this, there is another important concern regarding patient’s high radiation dose exposure, due to a large CT acquisition volume, and the related theoretical radiation-induced cancer risk from CT examination, which has been reported as not negligible in literature.35–38
These problem can be solved with the use of the new multidetector-row CT (MDCT), that allows to cover large body segments in few seconds obtaining high quality images, combined with several strategies like the use of low-kV protocol, automated or patient size-adjusted tube current modulation (mA) and iterative reconstruction algorithms (i.e. iDose4). In our study, according to our equipment, we try to combine the best levels of the automatic tube-current modulation and a low tube-voltage level (100 kV) with iterative reconstruction (iDose4, Level 4) in order to obtain a reduction of radiation dose; we also used a triggered protocol to access the entire aorta, instead of the only ascendant thoracic tract, in order to reduce the total acquisition time (see tab.2) and then to reduce the CM volume. In spite of a reduction of the CM volume administered during images acquisition, it was possible to obtain a good arterial vessels opacification and an acceptable image quality because of the higher X-ray attenuation of iodine-based CM at low voltages, as reported by different authors.19, 20,39,40
The use of our 100 kV protocol, compared with a standard one, leads to a reduction of 22% in radiation dose exposure, calculated as DLP and ED (1600.29 ± 340.65 mGycm vs 2044.53 ± 130.22 mGycm and 22.56 ± 5.8 mSv vs 28.82 ± 2.21 mSv), and allowed a CM reduction about 40%. This result is in line with the review of Alkadhi et al17 which reported a dose reduction from 20 to 50% using a low tube voltage settings (80–100 kV) compared to the standard (120 kV) protocol.
Furthermore, another benefit derived from low-kV protocol is the increase of SNR due to the higher attenuation of iodine-containing arteries at 100 kV, meaning also a better vessels opacification, as reported by Wintersperger et al.16 In our study the mean SNR was higher in 100 kV group than 120 kV group (15.7 ± 2.11 vs 13.7 ± 1.42, p = 0.044) and a better contrast enhancement was obtained in each segments of the study group than the control group (p < 0.05). This could be explained firstly by a lower attenuation of iodine contrast medium at 120 kV than at 100 kV, as reported by Itatani et al41 that leads to an increment in vessel attenuation, and secondly by a stable value of image noise due to the use the of iDose4, that allows one to maintain the image quality in the study group, leading to a decreased image noise and image artifacts, as shown in Figure 3.
Moreover, in all examinations evaluated by the two readers, the vessels opacification after contrast medium injection was considered adequate in all segments of aorta analyzed, with a difference <50 HU in attenuation values among the various levels along z-axis (i.e. Reader1 aortic valve plane 347 ± 19.78 HU vs right external iliac artery 321.2 ± 19.37 HU) (Table 3). These results lead to a high diagnostic quality images (i.e. Figure 5) and allowed high quality 3D reconstructions (i.e. Figure 6) to be obtained.
Figure 5.
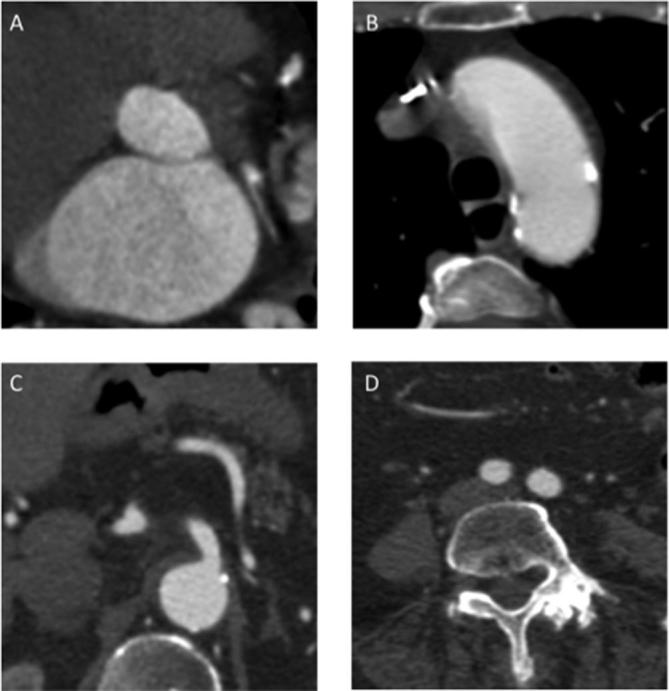
Thoracic and abdominal images of study protocol. Patient male, 67-years-old, BMI of 29.5 Kg/m2, with a moderate aortic stenosis studied with the low-kV protocol: (A) Image of aortic annulus, obtained with a multiplanar reconstruction; (B) image of aortic arch in axial view; (C) celiac tripod in axial view; (D) common iliac artery at L4 vertebra level, in axial view.
Figure 6.
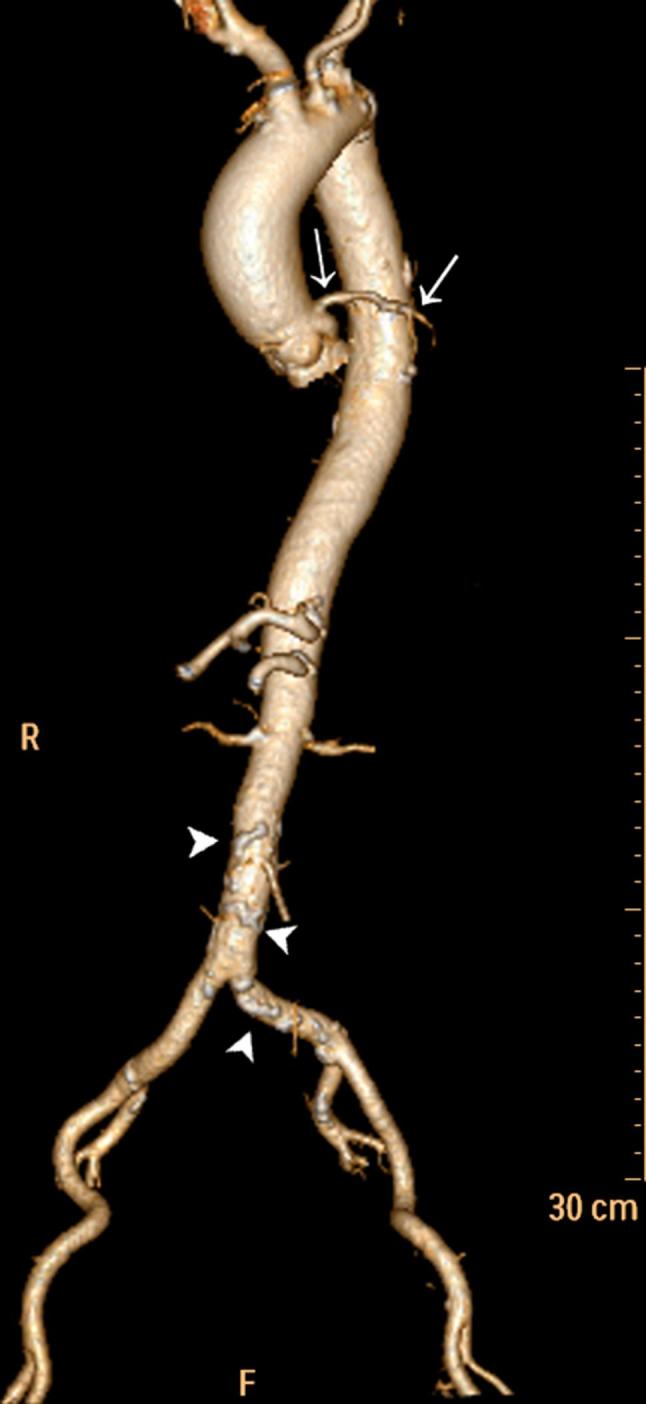
Volume rendering reconstruction of entire aorta and iliac axis. The image was reconstructed with the origin of the most important aortic branches, removing the distal tract to have a better view of any calcified parietal plaques (white arrowheads in abdominal aorta). It is also possible to see the proximal tract of the left coronary artery (white arrows), due to good opacification.
Finally, we noticed that the image artifacts reduction was also achieved with the use of retrospective ECG-gated acquisition of the entire aorta, that leads to better image quality although an increase of radiation dose (compared to prospective ECG-gating technique), that could help to explain our lower percentage of dose saving (20%) compared with the study by Alkadhi et al17 which reported a 29–34% effective radiation reduction for 100 kV CTA compared to 120 kV. The use of the ECG-gated acquisition on the entire aorta let us to gain about 5.62 s compared with the standard protocol with two acquisition. This, in addition to a reduced flow rate of 3.5 ml s−1, let us to acquire the entire scan volume with a low quantity of CM.
Regarding the subjective image evaluation, a similar score was achieved by the two readers both in the study and control group, with non-statistical difference between results (p > 0.05); therefore, we can say that there is no difference in image quality between the two protocols used.
The present study has some limitations. Firstly, based on ethical concerns, we did not compare the same group of patients but two different cohorts. Therefore, hemodynamic differences may have influenced study results, although bolus-timing options were used in all patients in order to optimize contrast-agent injection. Moreover, differences in body habitus may have contributed to variations in signal and noise measurements, as reported by Sigal-Cinqualbre et al40 who demonstrated an exponential increment of the noise with an increment of patient’s weight (keeping the tube-voltage constant). Secondly, we did not evaluate and compare the planning parameters of the aortic valve derived from our examinations with the reference standard angiography, but this could be a starting point for further investigations. Moreover, despite the fact that the data were anonymized and the two readers were blinded to scanning parameters and patient information, they may have been able to recognize the image reconstruction algorithm used in the two groups and this may represent a possible bias in the evaluation of subjective quality, that we have to consider. Finally, our study was performed in a single center with a small number of patients; to confirm our results will be useful a multicenter prospective study with a larger patient population.
conclusion
In conclusion, our results suggest that when applicable (BMI <30 kg m−2 and eGFR >30 mL/min/1.73 m2) a low-kV CTA protocols, which facilitates a reduction of 40% in CM volume, permits TAVI planning with high quality images leading to a reduction both of patient radiation dose exposure (−22%) and kidney impairment risk, compared to standard CTA protocol.
Contributor Information
Cammillo R Talei Franzesi, Email: ctfdoc@hotmail.com.
Davide Ippolito, Email: davide.atena@tiscalinet.it.
Luca Riva, Email: luca.riva89@gmail.com.
Davide Fior, Email: davidefior85@gmail.com.
Cecilia Cangiotti, Email: cecilia.cangiotti@gmail.com.
Sandro Sironi, Email: surgery_ctf@yahoo.com.
REFERENCES
- 1.Achenbach S, Delgado V, Hausleiter J, Schoenhagen P, Min JK, Leipsic JA. SCCT expert consensus document on computed tomography imaging before transcatheter aortic valve implantation (TAVI)/transcatheter aortic valve replacement (TAVR). J Cardiovasc Comput Tomogr 2012; 6: 366–80. doi: 10.1016/j.jcct.2012.11.002 [DOI] [PubMed] [Google Scholar]
- 2.Nkomo VT, Gardin JM, Skelton TN, Gottdiener JS, Scott CG, Enriquez-Sarano M. Burden of valvular heart diseases: a population-based study. Lancet 2006; 368: 1005–11. doi: 10.1016/S0140-6736(06)69208-8 [DOI] [PubMed] [Google Scholar]
- 3.Leipsic J, Gurvitch R, Labounty TM, Min JK, Wood D, Johnson M, et al. Multidetector computed tomography in transcatheter aortic valve implantation. JACC Cardiovasc Imaging 2011; 4: 416–29. doi: 10.1016/j.jcmg.2011.01.014 [DOI] [PubMed] [Google Scholar]
- 4.Bonow RO, Carabello BA, Chatterjee K, , Faxon DP, et al. ACC/AHA 2006 guidelines for the management of patients with valvular heart disease: a report of the American College of Cardiology/ American Heart Association Task Force on Practice Guidelines (Writing Committee to Revise the 1998 Guidelines for the Management of Patients With Valvular Heart Disease). J Am Coll Cardiol 2006; 48: e1–1. [DOI] [PubMed] [Google Scholar]
- 5.Vahanian A, Alfieri O, Andreotti F, Antunes MJ, Baron-Esquivias G, Baumgartner H, et al. Guidelines on the management of valvular heart disease (version 2012). The Joint Task Force on the Management of Valvular Heart Disease of the European Society of Cardiology (ESC) and the European Association for Cardio-Thoracic Surgery (EACTS). Eur Heart J 2012; 33: 2451–96. [DOI] [PubMed] [Google Scholar]
- 6.Holmes DR, Mack MJ, Kaul S, Agnihotri A, Alexander KP, Bailey SR, et al. 2012 ACCF/AATS/SCAI/STS expert consensus document on transcatheter aortic valve replacement. J Am Coll Cardiol 2012; 59: 1200–54. doi: 10.1016/j.jacc.2012.01.001 [DOI] [PubMed] [Google Scholar]
- 7.Bruschi G, de Marco F, Botta L, Cannata A, Oreglia J, Colombo P, et al. Direct aortic access for transcatheter self-expanding aortic bioprosthetic valves implantation. Ann Thorac Surg 2012; 94: 497–503. doi: 10.1016/j.athoracsur.2012.04.021 [DOI] [PubMed] [Google Scholar]
- 8.Schoenhagen P, Hausleiter J, Achenbach S, Desai MY, Tuzcu EM, Kapadia SR, Halliburton SS, Svensson LG. Computed tomography in the evaluation for transcatheter aortic valve implantation (TAVI). Cardiovasc Diagn Ther 2011; 1: 44–56. doi: 10.3978/j.issn.2223-3652.2011.08.01 [DOI] [PMC free article] [PubMed] [Google Scholar]
- 9.Tops LF, Wood DA, Delgado V, Schuijf JD, Mayo JR, Pasupati S, et al. Noninvasive evaluation of the aortic root with multislice computed tomography implications for transcatheter aortic valve replacement. JACC Cardiovasc Imaging 2008; 1: 321–30. doi: 10.1016/j.jcmg.2007.12.006 [DOI] [PubMed] [Google Scholar]
- 10.Wood DA, Tops LF, Mayo JR, Pasupati S, Schalij MJ, Humphries K, et al. Role of multislice computed tomography in transcatheter aortic valve replacement. Am J Cardiol 2009; 103: 1295–301. doi: 10.1016/j.amjcard.2009.01.034 [DOI] [PubMed] [Google Scholar]
- 11.Kubo S, Tadamura E, Yamamuro M, Kanao S, Kataoka ML, Takahashi M, et al. Multidetector-row computed tomographic angiography of thoracic and abdominal aortic aneurysms: comparison of arterial enhancement with 3 different doses of contrast material. J Comput Assist Tomogr 2007; 31: 422–9. doi: 10.1097/01.rct.0000237819.64419.d2 [DOI] [PubMed] [Google Scholar]
- 12.Joshi SB, Mendoza DD, Steinberg DH, Goldstein MA, Lopez CF, Raizon A, et al. Ultra-low-dose intra-arterial contrast injection for iliofemoral computed tomographic angiography. JACC Cardiovasc Imaging 2009; 2: 1404–11. doi: 10.1016/j.jcmg.2009.08.010 [DOI] [PubMed] [Google Scholar]
- 13.Kubo S, Tadamura E, Yamamuro M, Hosokawa R, Kimura T, Kita T, et al. Thoracoabdominal-aortoiliac MDCT angiography using reduced dose of contrast material. AJR Am J Roentgenol 2006; 187: 548–54. doi: 10.2214/AJR.05.0309 [DOI] [PubMed] [Google Scholar]
- 14.Martin ML, Tay KH, Flak B, Fry PD, Doyle DL, Taylor DC, et al. Multidetector CT angiography of the aortoiliac system and lower extremities: a prospective comparison with digital subtraction angiography. AJR Am J Roentgenol 2003; 180: 1085–91. doi: 10.2214/ajr.180.4.1801085 [DOI] [PubMed] [Google Scholar]
- 15.Tepel M, Aspelin P, Lameire N. Contrast-induced nephropathy: a clinical and evidence-based approach. Circulation 2006; 113: 1799–806. doi: 10.1161/CIRCULATIONAHA.105.595090 [DOI] [PubMed] [Google Scholar]
- 16.Wintersperger B, Jakobs T, Herzog P, Schaller S, Nikolaou K, Suess C, et al. Aorto-iliac multidetector-row CT angiography with low kV settings: improved vessel enhancement and simultaneous reduction of radiation dose. Eur Radiol 2005; 15: 334–41. doi: 10.1007/s00330-004-2575-y [DOI] [PubMed] [Google Scholar]
- 17.Alkadhi H, Schindera ST. State of the art low-dose CT angiography of the body. Eur J Radiol 2011; 80: 36–40. doi: 10.1016/j.ejrad.2010.12.099 [DOI] [PubMed] [Google Scholar]
- 18.Huda W, Scalzetti EM, Levin G. Technique factors and image quality as functions of patient weight at abdominal CT. Radiology 2000; 217: 430–5. doi: 10.1148/radiology.217.2.r00nv35430 [DOI] [PubMed] [Google Scholar]
- 19.Zhang H, Ma Y, Lyu J, Yang Y, Yuan W, Song Z. Low kV and low concentration contrast agent with iterative reconstruction of computed tomography (CT) coronary angiography: a preliminary study. Med Sci Monit 2017; 23: 5005–10. [DOI] [PMC free article] [PubMed] [Google Scholar]
- 20.Leschka S, Stolzmann P, Schmid FT, Scheffel H, Stinn B, Marincek B, et al. Low kilovoltage cardiac dual-source CT: attenuation, noise, and radiation dose. Eur Radiol 2008; 18: 1809–17. doi: 10.1007/s00330-008-0966-1 [DOI] [PubMed] [Google Scholar]
- 21.Nakaura T, Awai K, Maruyama N, Takata N, Yoshinaka I, Harada K, et al. Abdominal dynamic CT in patients with renal dysfunction: contrast agent dose reduction with low tube voltage and high tube current-time product settings at 256-detector row CT. Radiology 2011; 261) , (No.2): 467–476Vol.. doi: 10.1148/radiol.11110021 [DOI] [PubMed] [Google Scholar]
- 22.Schindera ST, Graca P, Patak MA, Abderhalden S, von Allmen G, Vock P, et al. Thoracoabdominal-aortoiliac multidetector-row CT angiography at 80 and 100 kVp: assessment of image quality and radiation dose. Invest Radiol 2009; 44: 650–5. doi: 10.1097/RLI.0b013e3181acaf8a [DOI] [PubMed] [Google Scholar]
- 23.Becker CR, Bruening R, Schaetzl M, Schoepf UJ, Reiser MF. Xenon versus ceramics: a comparison of two CT X-ray detector systems. J Comput Assist Tomogr 1999; 23: 795–9. doi: 10.1097/00004728-199909000-00030 [DOI] [PubMed] [Google Scholar]
- 24.Shen Y, Sun Z, Xu L, Li Y, Zhang N, Yan Z, et al. High-pitch, low-voltage and low-iodine-concentration CT angiography of aorta: assessment of image quality and radiation dose with iterative reconstruction. PLoS One 2015; 10: e0117469–16. doi: 10.1371/journal.pone.0117469 [DOI] [PMC free article] [PubMed] [Google Scholar]
- 25.Yin WH, Lu B, Li N, Han L, Hou ZH, Wu RZ, , et al. Iterative reconstruction to preserve image quality and diagnostic accuracy at reduced radiation dose in coronary CT angiography: an intraindividual comparison. JACC Cardiovasc Imaging 2013; 6: 1239–49n° 12. doi: 10.1016/j.jcmg.2013.08.008 [DOI] [PubMed] [Google Scholar]
- 26.Hou Y, Liu X, Xv S, Guo W, Guo Q. Comparisons of image quality and radiation dose between iterative reconstruction and filtered back projection reconstruction algorithms in 256-MDCT coronary angiography. AJR Am J Roentgenol 2012; 199: 588–94. doi: 10.2214/AJR.11.7557 [DOI] [PubMed] [Google Scholar]
- 27.Nakayama Y, Awai K, Funama Y, Liu D, Nakaura T, Tamura Y, et al. Lower tube voltage reduces contrast material and radiation doses on 16-MDCT aortography. AJR Am J Roentgenol 2006; 187: W490–W497. doi: 10.2214/AJR.05.0471 [DOI] [PubMed] [Google Scholar]
- 28.Fujioka C, Horiguchi J, Kiguchi M, Yamamoto H, Kitagawa T, Ito K. Survey of aorta and coronary arteries with prospective ECG-triggered 100-kV 64-MDCT angiography. AJR Am J Roentgenol 2009; 193: 227–33. doi: 10.2214/AJR.08.1722 [DOI] [PubMed] [Google Scholar]
- 29.Farrelly C, Davarpanah A, Keeling AN, Sheehan J, Ragin A, Yaghmai V, et al. Low dose dual-source CT angiography of the thoracic aorta. Int J Cardiovasc Imaging 2011; 27: 1025–34. doi: 10.1007/s10554-010-9742-9 [DOI] [PubMed] [Google Scholar]
- 30.Menzel H, Schibilla H, Teunen D. European guidelines on quality criteria for computed tomography.Publication no. EUR 16262 EN. Luxembourg, Luxembourg: The British Institute of Radiology.; 2000. [Google Scholar]
- 31.Deak PD, Smal Y, Kalender WA. Multisection CT protocols: sex- and age-specific conversion factors used to determine effective dose from dose-length product. Radiology 2010; 257: 158–66. doi: 10.1148/radiol.10100047 [DOI] [PubMed] [Google Scholar]
- 32.Chang CF, Lin CC. Current concepts of contrast-induced nephropathy: a brief review. J Chin Med Assoc 2013; 76: 673–81. doi: 10.1016/j.jcma.2013.08.011 [DOI] [PubMed] [Google Scholar]
- 33.Nash K, Hafeez A, Hou S. Hospital-acquired renal insufficiency. Am J Kidney Dis 2002; 39: 930–6. doi: 10.1053/ajkd.2002.32766 [DOI] [PubMed] [Google Scholar]
- 34.Hou SH, Bushinsky DA, Wish JB, Cohen JJ, Harrington JT. Hospital-acquired renal insufficiency: a prospective study. Am J Med 1983; 74: 243–8. doi: 10.1016/0002-9343(83)90618-6 [DOI] [PubMed] [Google Scholar]
- 35.Brenner DJ, Elliston CD. Estimated radiation risks potentially associated with full-body CT screening. Radiology 2004; 232: 735–8. doi: 10.1148/radiol.2323031095 [DOI] [PubMed] [Google Scholar]
- 36.Brenner DJ. Radiation risks potentially associated with low-dose CT screening of adult smokers for lung cancer. Radiology 2004; 231: 440–5. doi: 10.1148/radiol.2312030880 [DOI] [PubMed] [Google Scholar]
- 37.Brenner D, Elliston C, Hall E, Berdon W. Estimated risks of radiation-induced fatal cancer from pediatric CT. AJR Am J Roentgenol 2001; 176: 289–96. doi: 10.2214/ajr.176.2.1760289 [DOI] [PubMed] [Google Scholar]
- 38.Berrington de González A, Darby S. Risk of cancer from diagnostic X-rays: estimates for the UK and 14 other countries. Lancet 2004; 363: 345–51. doi: 10.1016/S0140-6736(04)15433-0 [DOI] [PubMed] [Google Scholar]
- 39.Nakayama Y, Awai K, Funama Y, Hatemura M, Imuta M, Nakaura T, et al. Abdominal CT with low tube voltage: preliminary observations about radiation dose, contrast enhancement, image quality, and noise. Radiology 2005; 237: 945–51. doi: 10.1148/radiol.2373041655 [DOI] [PubMed] [Google Scholar]
- 40.Sigal-Cinqualbre AB, Hennequin R, Abada HT, Chen X, Paul JF. Low-kilovoltage multi-detector row chest CT in adults: feasibility and effect on image quality and iodine dose. Radiology 2004; 231: 169–74. doi: 10.1148/radiol.2311030191 [DOI] [PubMed] [Google Scholar]
- 41.Itatani R, Oda S, Utsunomiya D, Funama Y, Honda K, Katahira K, et al. Reduction in radiation and contrast medium dose via optimization of low-kilovoltage CT protocols using a hybrid iterative reconstruction algorithm at 256-slice body CT: phantom study and clinical correlation. Clin Radiol 2013; 68: e128–e1357 FIGURES LEGEND. doi: 10.1016/j.crad.2012.10.014 [DOI] [PubMed] [Google Scholar]