Abstract
Fat necrosis of the breast is a well-described benign entity that can result in unnecessary biopsy of breast lesions. The pathogenesis of fat necrosis is a non-suppurative inflammatory process of adipose tissue, which may be seen after trauma, surgery, biopsy, post-breast reconstruction, post-fat grafting, post-radiotherapy, infection, and duct ectasia, among other conditions. Clinically, these patients may be asymptomatic or may present with a palpable lump, skin tethering, induration, and occasionally axillary lymphadenopathy. Depending on the time at which diagnostic imaging is performed, fat necrosis can have highly variable appearances on different modalities as it evolves. This is directly related to whether inflammation or fibrosis is predominating within the lesion, and correlation with clinical history is paramount in evaluating these patients. This review aims to analyze benign and suspicious imaging features of fat necrosis confirmed by tissue sampling. Knowledge of both benign and malignant-appearing features of fat necrosis on conventional modalities such as mammography and ultrasound, as well as newer applications including digital breast tomosynthesis, PET/CT, and MRI, should help the radiologist minimize the number of unnecessary biopsies.
Introduction
Fat necrosis comprises 2.75% of all breast lesions,1 and its prevalence continues to increase. The most common cause of fat necrosis in the breast is trauma, followed by surgery with post-operative radiotherapy, which is estimated to occur in 4 to 25% of patients.2 A large retrospective review of 2152 breast reduction procedures found that fat necrosis has been observed in greater than 8% of cases.3 Another post-surgical population in whom fat necrosis has been described as the most common post-operative imaging finding are breast reconstruction in patients after mastectomy, postulated to be due to an inadequate blood supply to the flap.4 Additionally, fat necrosis has been described as an undesirable outcome in fat grafting, and has been attributed to bolus injection and uneven distribution of fat droplets.5
Fat necrosis may be detected incidentally on routine screening examination in an otherwise asymptomatic patient, or in a patient undergoing workup for clinically abnormal breast examination. Clinical presentation at physical examination may range from a single lump, to multiple smooth round nodules, or irregular masses with skin retraction.1 Additional clinical features include pain, erythema, skin dimpling, nipple retraction, and axillary lymphadenopathy. When due to trauma, the location of clinically visible abnormalities tend to be superficially located near the skin or areola, sites within the breast which are vulnerable to traumatic insults.6 This review aims to describe both typically benign and suspicious imaging features on multimodality imaging of pathologically-proven fat necrosis cases.
Pathogenesis
The pathogenesis of fat necrosis begins with the destruction of adipocytes and the cascade initiated by the release of lipases, which may continue as a smoldering inflammatory process or progress to fibrosis. This process can be broken down into four phases to best understand how the pathogenesis of fat necrosis relates to its broad spectrum of imaging appearances. In the first hyperacute phase, vessel damage resulting in the initial inflammatory reaction is characterized by transient arteriolar vasoconstriction. This results in fluid transudation into the interstitial tissues, resulting in a halo of edema occasionally seen on imaging.7 Specifically as it relates to radiotherapy, some authors have proposed that radiation itself causes endarteritis obliterans resulting in vascular occlusion, and subsequently ischemic injury with leakage of cellular contents into surrounding tissues.2 The second acute inflammatory phase is initiated by the endothelial damage activating the coagulation cascade, which creates the fibrin meshwork. From this framework, the deposition of granulation tissue and angiogenesis may occur.7 Histiocytic and lymphocytic infiltration are present in varying degrees as well, with histiocytes contributing to scar tissue formation. Angiogenesis consists of new vessels with relatively smaller muscular components and prominent gaps between endothelial cells, a feature which accounts for the passage of gadolinium into the interstitial tissue on contrast-enhanced MRI. The third phase is characterized by formation of the lipid cyst, which occurs as local destruction of adipocytes causes the release of lipases into the interstitium. This form of chemical irritation, along with the acute inflammation already occurring due to endothelial damage, may cause a fibrous capsule to form around the oily fatty acids. The fourth phase consists of a type of foreign-body or chronic granulomatous reaction, resulting in irregular fibrosis or calcification. This phase only occurs if the fatty acids are not encapsulated and are thus attacked by the immune system. The multitude of appearances of fat necrosis on imaging is hence dependent on the degree of histiocytic infiltrate, hemorrhage, fibrosis, and calcification.1, 7 Several imaging appearances will be further discussed as seen in patients with pathologically proven fat necrosis, with emphasis on typically benign and suspicious appearances on multimodality imaging.
Mammography
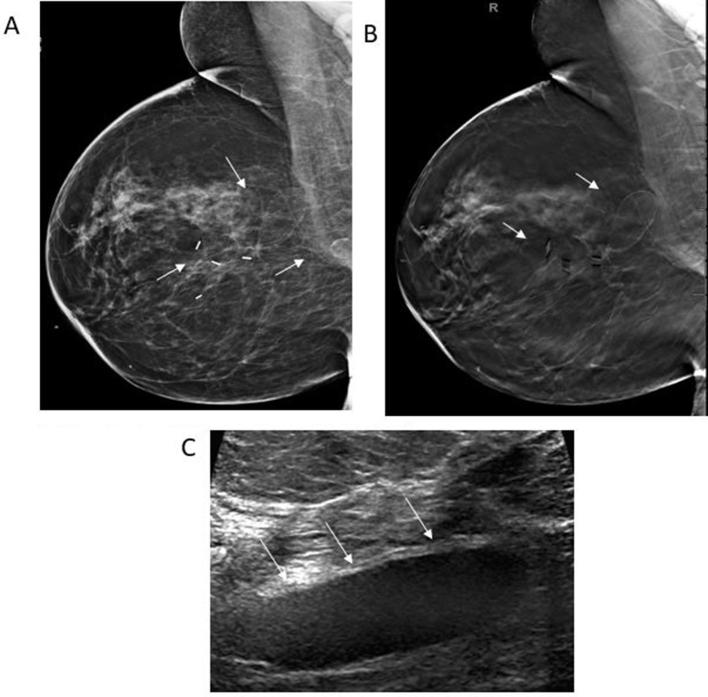
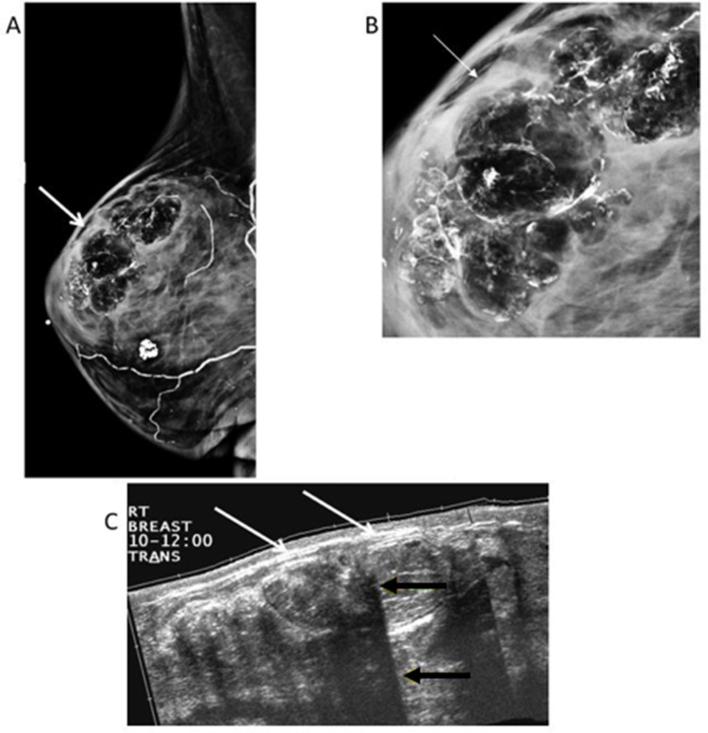
The radiological appearance of fat necrosis comprises a broad spectrum, relating to the age of the process. The classically benign-appearing mammographic findings for fat necrosis are single or multiple oil cysts, which are radiodensities with central lucency. The oil cyst represents macroscopic necrotic fat with a thin fibrous membrane, which develops from proliferation of reparative fibroblasts around the periphery of the cyst.8 The typical oil cyst appearance on mammography is illustrated in Figure 1. These oil cysts may be accompanied by peripheral coarse and ring-shaped rim or “eggshell” calcifications. The presence of calcifications on mammography suggests that most of the masses will evolve to a dystrophic morphology as the lesions become older.7 The oil cyst appearance and rim or “eggshell” calcifications are pathognomonic of the classically benign appearance of fat necrosis on mammography.8 Figure 2 demonstrates these typically benign features on standard and magnified views.
Figure 1.
50-year-old female with bilateral breast cancer and bilateral segmentectomies. (A) Right MLO view reveals a post-surgical scar in the upper outer quadrant associated with circumscribed oval radiolucent masses (white arrows). (B) Corresponding DBT MLO image demonstrates encapsulated, radiolucent oval masses with the capsule clearly seen (white arrows). (C) Transverse gray-scale ultrasound shows a circumscribed hypoechoic oval mass (white arrows) consistent with an oil cyst. DBT, digital breast tomosynthesis; MLO view, mediolateral oblique view.
Figure 2.
66-year-old female with left breast cancer, status post-left mastectomy and right reduction mammoplasty. (A) Right MLO view shows multiple circumscribed radiolucent masses with calcifications (white arrows), typical of fat necrosis. (B) Magnified LM view shows the fat contained masses are lined with rim-shell calcifications. (C) Extended field-of-view ultrasound of the upper outer quadrant reveals multiple hyperechoic masses (white arrows) with multiple areas of posterior acoustic shadowing (yellow arrows) related to the curvilinear calcifications. LM, latero-medial; MLO view, mediolateral oblique view.
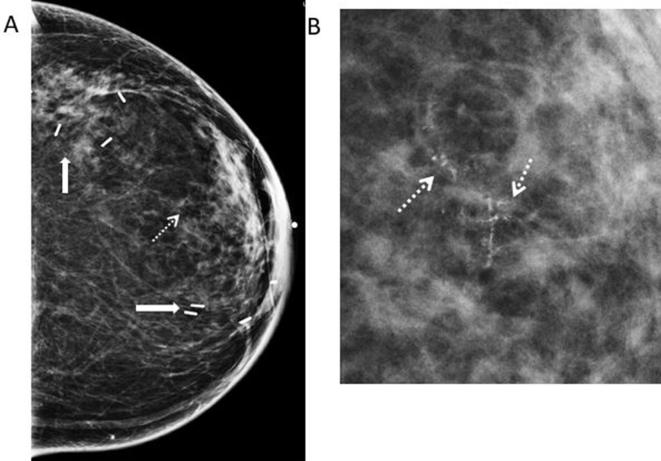
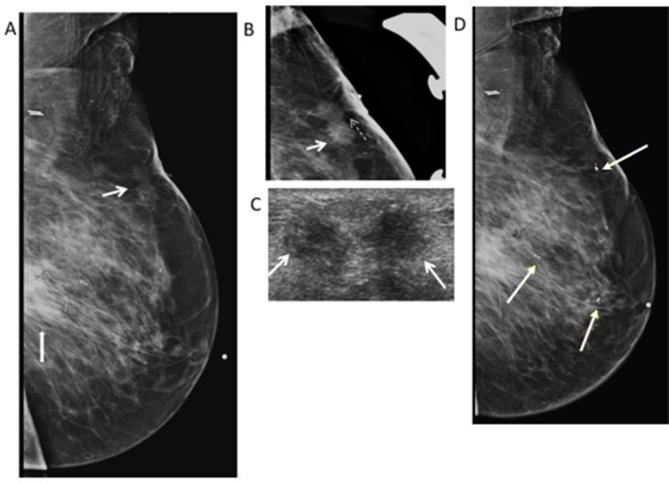
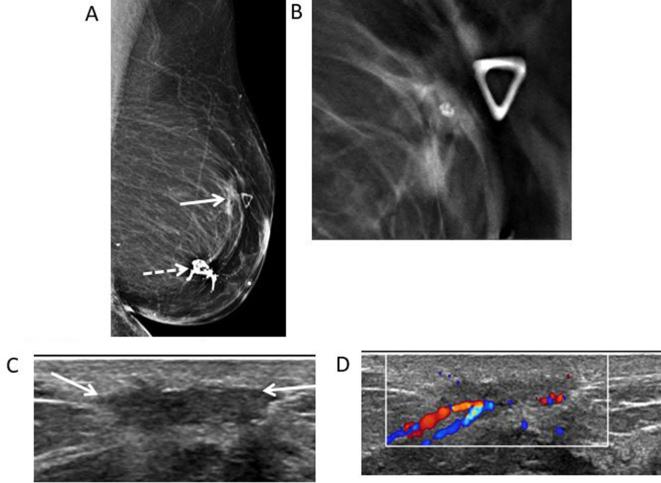
If the fibrous calcified rim of the cyst collapses, this may result in a mammographically indeterminate appearance. Additional worrisome calcifications include those which are pleomorphic, branching, rod-like, or angular in morphology,1 such as those seen in Figure 3. Lesions which are associated with an intense fibrotic reaction may appear as focal asymmetry, microcalcifications, or an irregular spiculated mass on mammography. Fat necrosis appearing as suspicious non-calcified masses may demonstrate increased density due to progressive parenchymal fibrosis resulting in an ill-defined, spiculated mass such as those seen in Figures 4 and 5.
Figure 3.
58-year-old female with history of left breast cancer, status post-segmentectomy and immediate reconstruction with oncoplastic surgery. (A) Left CC mammogram shows surgical clips (white thick arrows) related to recent segmentectomy and oncoplastic surgery. New calcifications are noted in the central region of the left breast (dotted white arrow). (B) CC magnification view shows heterogeneous and branching calcifications (white dotted arrows) in linear distribution suspicious for recurrence. Stereotactic biopsy was performed revealing fat necrosis. CC, cranial-caudal.
Figure 4.
79-year-old woman with history of breast cancer in 2009 followed by segmental mastectomy and radiation in 2010. She presents for evaluation of palpable abnormality in the left breast. (A) Left MLO mammogram shows a post-surgical scar (thick white arrow) in the central posterior region of the left breast. There is also an irregular non-calcified mass (thin white arrow) with spiculated margins in the superior region of the left breast correlating with the palpable marker (white dotted arrow). (B) Spot LM view shows the spiculated margins of the mass (white arrow) with tethering (white dash arrow) and thickening of the overlying skin. BI-RADS 4C was assigned. (C) Transverse gray- scale ultrasound shows the irregular mass with spiculated margins (white arrows) and heterogeneous hyperechogenicity. Core biopsy was performed revealing fat necrosis. (D) Left MLO view shows multiple clips seen in the left breast related to multiple biopsies of suspicious masses on ultrasound. Pathology shows no malignancy, and recurrent fat necrosis. Bi-RADS, breast imaging-reporting and data system; LM, latero-medial; MLO, mediolateral oblique.
Figure 5.
73-year-old female with history of left breast DCIS, status post-segmentectomy presents for evaluation of palpable abnormality. (A) Left MLO mammogram shows dystrophic calcifications consistent with typical fat necrosis calcifications at the surgical site (white dotted arrow). At the area of palpable abnormality, there is an irregular mass (white arrow). (B.) MLO close-up DBT view allows improved visualization of the spiculated margins of the mass. No entrapped fat was seen. (C) Transverse gray-scale ultrasound shows the superficial hypoechoic mass with irregular margins (white arrows). (D) Color Doppler ultrasound shows the mass demonstrates increased vascularity. BI-RADS: 4C. Core biopsy was performed showing fat necrosis. Bi-RADS, breast imaging-reporting and data system; DBT, digital breast tomosynthesis; DCIS, ductal carcinoma in situ; MLO, mediolateral oblique.
Ultrasound
The internal echotexture of a breast mass is an important distinguishing feature in the breast diagnostic workup. This is in large part due to the fact that the overwhelming majority of hyperechoic masses are benign.1, 9 Hyperechoic cancers in the breast are reported to comprise less than 0.8% of tumors.9 Hence, when evaluating the possibility of fat necrosis by ultrasound, hyperechoic echotexture is a somewhat reassuring feature to the radiologist, as seen in Figure 2C. However, fat necrosis ranges on sonography from hypoechoic on sonography to complex cystic or solid masses, echogenic bands, or posterior acoustic shadowing.1 While there is no “typically benign sonographic” appearance of fat necrosis as there is on conventional mammography, occasionally, fat necrosis may appear as a simple cyst on ultrasound. Alternatively, it may appear as a hypoechoic solid mass (Figure 1C) or as an anechoic mass with posterior acoustic shadowing.8
Worrisome features on sonography seen in Figures 4–6 include a hypoechoic or heterogenous echotexture, ill-defined mass with spiculated margins, a mass containing debris or a complex mass.8 In addition, associated vascularity would signify a suspicious imaging finding as seen in Figure 5D.
Figure 6.
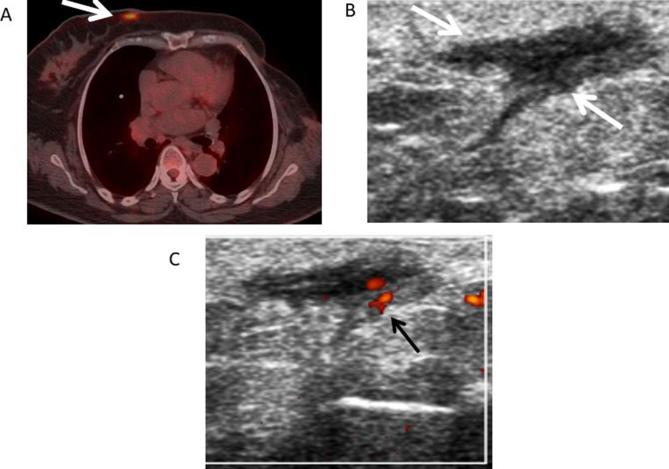
61-year-old female with left breast cancer followed by mastectomy. (A) Axial fused PET-CT image shows a focal area of increased FDG uptake (white arrow) in the medial region of the right breast with a maximum standardized uptake value of 6.4 suspicious for metastasis or primary breast neoplasm. (B) Transverse gray-scale ultrasound shows an irregular dermal hypoechoic lesion (white arrows) correlating with the lesion shown on the PET-CT. (C) Doppler ultrasound showed internal vascularity (black arrow) within the lesion. BI-RADS 4B. Ultrasound FNA was performed showing fat necrosis. Bi-RADS, breast imaging-reporting and data system; FDG, fluoro-D-glucose; FNA, Fine needle aspiration; PET-CT, positron emission tomography-CT.
Digital breast tomosynthesis
Digital breast tomosynthesis (DBT) is gaining increasing popularity as an adjunct to two-dimensional digital mammography, due to its ability to depict breast tissue on a dynamic sequence of reconstructed cross-sectional images. Studies have shown that DBT combined with two-dimensional digital mammography improves the specificity of diagnostic imaging, without a loss of sensitivity.10 The greatly reduced summation of overlapping tissues may help to reveal the presence of fat within a breast mass. In addition, a thin capsule of a lipid cyst may be more perceptible on the DBT image than on the corresponding mammogram (Figure 1B). However, it is important to recognize that a fatty component on DBT is not synonymous with benignity. The improved detail of DBT to evaluate mass margins and shape should weigh more than the presence of fat in the lesion to determine additional evaluation with ultrasound and biopsy.11
PET-CT
While whole-body 18F-FDG PET-CT (fluoro-D-glucose positron emission tomography-CT) is not currently indicated for primary breast cancer detection, it is frequently performed in breast cancer patients as part of the staging workup. The detection of locoregional or distant metastases is greatly aided by this modality. Bearing this in mind, both malignant and non-malignant processes, including fat necrosis, may demonstrate higher metabolic rates than surrounding tissue. On PET-CT, fat necrosis may demonstrate increased 18F- FDG-uptake in the acute phase, due to the presence of metabolically active inflammatory cells.12 For example, in the case shown in Figure 6 where PET-CT was performed, the region of fat necrosis has an SUV of 5.3. Correlation with mammogram and ultrasound is always required in these cases.
MRI
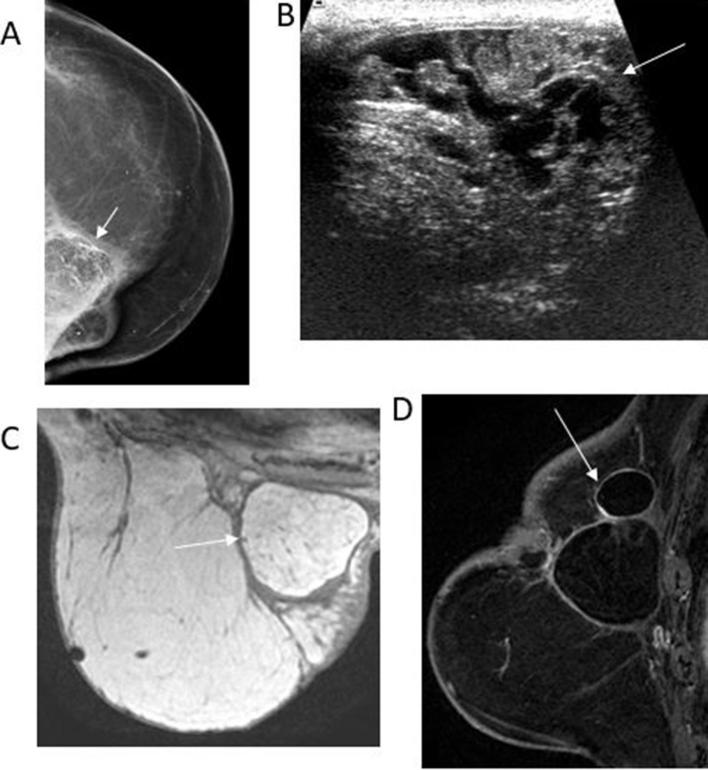
The amount of inflammatory reaction, presence of liquefied fat, and the degree of fibrosis determines the varying signals of fat necrosis on MRI.12 Administration of contrast may result in enhancement, particularly during the early stages of the inflammatory process.7, 13 Some benign features include fatty-signal intensity masses with hyperintensity on T1 weighted non-fat-suppressed sequences. Fat suppression sequences are critical to differentiate the presence of fat from enhancing lesions on T1 weighted MRI, and may help to obviate the need for biopsy, as demonstrated in Figure 7C,D. Contrast kinetics are variable; they may be slow, with gradual enhancement, or they may demonstrate rapid enhancement.13
Figure 7.
78-old-year female with history of left breast cancer followed by mastectomy and reconstruction with TRAM flap presented for evaluation of redness and hardness along the medial region of the left breast. (A) Left CC mammographic view reveals lucent masses with peripheral and dystrophic calcifications in the upper inner quadrant (white arrow). (B) Transverse gray-scale ultrasound reveals the mixed echogenicity of the mass (arrow). (C) Axial T1 weighted non-fat-saturated image shows a hyperintense circumscribed mass with a hypointense rim (arrow). The mass signal is similar to the adjacent fat, characteristic of fat necrosis. (D) Sagittal T1 enhanced and fat-suppressed image shows the fat-containing mass with a non-enhancing thin fibrous rim (arrow). Note that no enhancing mass is identified, therefore needle biopsy can be safely avoided. CC, cranial-caudal.
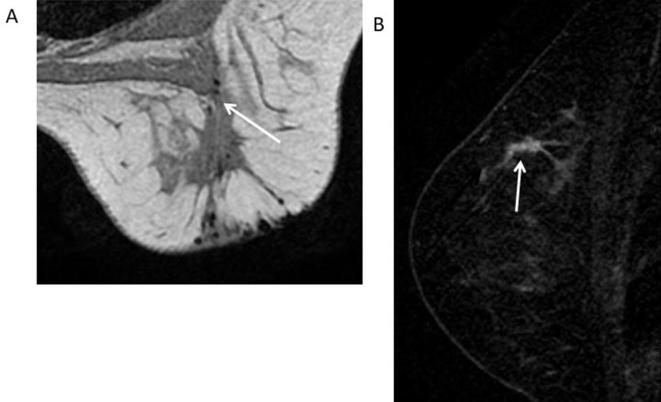
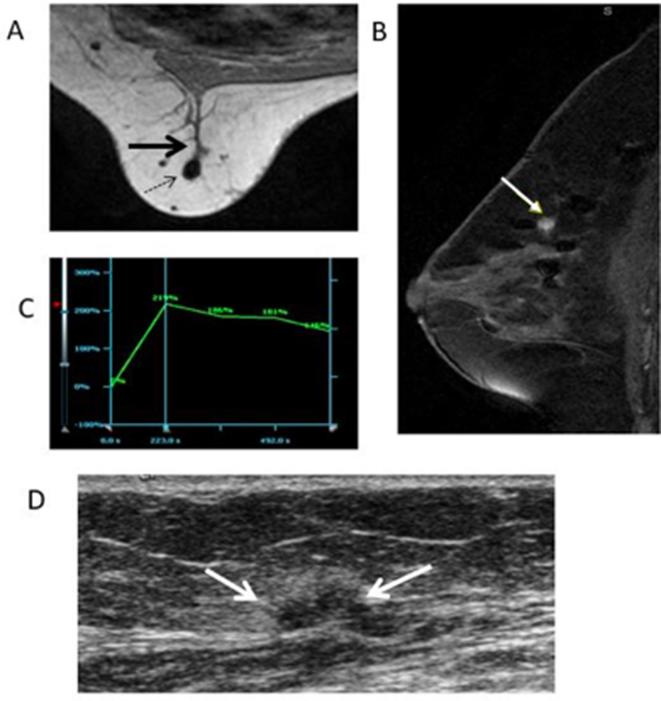
More suspicious features of fat necrosis on MRI include ill-defined masses with or without enhancement, as seen in Figures 8 and 9. In addition, there may be washout in the delayed phase on kinetic curves, as seen in Figure 9C. When non-fatty signal intensity irregular masses with variable enhancement patterns are seen, this is likely a reflection of the later stages of fat necrosis (i.e. predominately fibrotic stage).
Figure 8.
33-year-old female with history of DCIS followed by breast conservation surgery and radiation. (A) Axial T1 weighted non-fat-suppressed image of the right breast shows a post-surgical scar in the upper outer quadrant (white arrow). (B) Sagittal T1 weighted subtracted image shows a 3 cm clumped enhancement adjacent to the post-surgical scar (white arrow) suspicious for recurrence. BI-RADS 4C. Recommendation: MRI guided biopsy. Core biopsy showed fat necrosis. Bi-RADS, breast imaging-reporting and data system; DCIS, ductal carcinoma in situ.
Figure 9.
59-year-old female with history of atypical ductal hyperplasia, status post-segmental mastectomy presents for high-risk screening. (A) Axial T1 weighted non-fat-saturated image shows an ill-defined mass (black thick arrow) adjacent to a surgical clip (dotted black arrow). (B) Sagittal T1 enhanced and fat-suppressed image shows the mass enhances with contrast (yellow arrow). (C) Graph of the kinetic curve confirms the mass has a wash-in and wash-out curve. (D) Second look ultrasound shows the enhancing mass correlates with an irregular, hypoechoic mass (white arrow) and hyperechoic halo. Core biopsy showed fat necrosis.
Conclusion
The varying multimodality appearances of fat necrosis have been extensively described previously and are reviewed here. Particular attention should be made to seek out those imaging features which are suspicious or indeterminate for malignancy. Benign and malignant features are summarized in Table 1, and include lesions with a collapsed fibrous calcified rim on mammography, lesions with a hypoechoic or heterogenous echotexture on ultrasound, and lesions demonstrating increased FDG-avidity on PET-CT. Critically analyzing these imaging features and distinguishing between benign and malignant appearing lesions may help to decrease the number of unnecessary biopsies.
Table 1.
Summary of selected fat necrosis imaging features
| Imaging Modality | Benign | Suspicious findings |
| Mammography | Oil cyst Rim calcifications Dystrophic calcifications |
Irregular, spiculated mass Architectural distortion Coarse heterogeneous Pleomorphic |
| Ultrasound | Echogenic band within an oil cyst Echogenic mass in the superficial plane of the breast |
Irregular mass Hypoechoic masses with posterior acoustic shadowing Complex cystic and solid masses |
| Breast MRI | Round or oval masses hyperintense on T1 Black Hole sign on STIR sequence |
Irregular enhancing masses Thick and Irregular rim enhancing masses |
| PET-CT | Hypermetabolic lesion |
PET-CT, positron emission tomography-CT. STIR, short time inversion recovery.
Contributor Information
Sidra J Tayyab, Email: SJ2_27@hotmail.com.
Beatriz E Adrada, Email: Beatriz.Adrada@mdanderson.org.
Wei Tse Yang, Email: wyang@mdanderson.org.
REFERENCES
- 1.Kerridge WD, Kryvenko ON, Thompson A, Shah BA. Fat Necrosis of the breast: A pictorial review of the mammographic, ultrasound, CT, and MRI findings with histopathologic correlation. Radiol Res Pract 2015; 2015: 1–8. doi: 10.1155/2015/613139 [DOI] [PMC free article] [PubMed] [Google Scholar]
- 2.Trombetta M, Valakh V, Julian TB, Werts ED, Parda D. Mammary fat necrosis following radiotherapy in the conservative management of localized breast cancer: does it matter? Radiother Oncol 2010; 97: 92–4. doi: 10.1016/j.radonc.2010.02.021 [DOI] [PubMed] [Google Scholar]
- 3.Manahan MA, Buretta KJ, Chang D, Mithani SK, Mallalieu J, Shermak MA. An outcomes analysis of 2142 breast reduction procedures. Ann Plast Surg 2015; 74(No. 3): 289–92. doi: 10.1097/SAP.0b013e31829d2261 [DOI] [PubMed] [Google Scholar]
- 4.Neal CH, Yilmaz ZN, Noroozian M, Klein KA, Sundaram B, Kazerooni EA, et al. Imaging of breast cancer-related changes after surgical therapy. AJR Am J Roentgenol 2014; 202: 262–72. doi: 10.2214/AJR.13.11517 [DOI] [PubMed] [Google Scholar]
- 5.Mineda K, Kuno S, Kato H, Kinoshita K, Doi K, Hashimoto I, et al. Chronic inflammation and progressive calcification as a result of fat necrosis: the worst outcome in fat grafting. Plast Reconstr Surg 2014; 133: 1064–72. doi: 10.1097/PRS.0000000000000097 [DOI] [PubMed] [Google Scholar]
- 6.Aqel NM, Howard A, Collier DS. Fat necrosis of the breast: a cytological and clinical study. Breast 2001; 10: 342–5. doi: 10.1054/brst.2000.0275 [DOI] [PubMed] [Google Scholar]
- 7.Ganau S, Tortajada L, Escribano F, Andreu X, Sentís M. The great mimicker: fat necrosis of the breast--magnetic resonance mammography approach. Curr Probl Diagn Radiol 2009; 38: 189–97. doi: 10.1067/j.cpradiol.2009.01.001 [DOI] [PubMed] [Google Scholar]
- 8.Chala LF, de Barros N, de Camargo Moraes P, Endo E, Kim SJ, Pincerato KM, et al. Fat necrosis of the breast: mammographic, sonographic, computed tomography, and magnetic resonance imaging findings. Curr Probl Diagn Radiol 2004; 33: 106–26. doi: 10.1067/j.cpradiol.2004.01.001 [DOI] [PubMed] [Google Scholar]
- 9.Adrada B, Wu Y, Yang W. Hyperechoic lesions of the breast: radiologic-histopathologic correlation. AJR Am J Roentgenol 2013; 200: W518–W530. doi: 10.2214/AJR.12.9263 [DOI] [PubMed] [Google Scholar]
- 10.Zuley ML, Bandos AI, Ganott MA, Sumkin JH, Kelly AE, Catullo VJ, et al. Digital breast tomosynthesis versus supplemental diagnostic mammographic views for evaluation of noncalcified breast lesions. Radiology 2013; 266: 89–95. doi: 10.1148/radiol.12120552 [DOI] [PMC free article] [PubMed] [Google Scholar]
- 11.Freer PE, Wang JL, Rafferty EA. Digital breast tomosynthesis in the analysis of fat-containing lesions. Radiographics 2014; 34: 343–58. doi: 10.1148/rg.342135082 [DOI] [PubMed] [Google Scholar]
- 12.Adejolu M, Huo L, Rohren E, Santiago L, Yang WT. False-positive lesions mimicking breast cancer on FDG PET and PET/CT. AJR Am J Roentgenol 2012; 198: W304–W314. doi: 10.2214/AJR.11.7130 [DOI] [PubMed] [Google Scholar]
- 13.Taboada JL, Stephens TW, Krishnamurthy S, Brandt KR, Whitman GJ. The many faces of fat necrosis in the breast. AJR Am J Roentgenol 2009; 192: 815–25. doi: 10.2214/AJR.08.1250 [DOI] [PubMed] [Google Scholar]


