

Abstract
Autosomal dominant polycystic kidney disease (ADPKD) is the most prevalent inherited nephropathy. To date, therapies alleviating the disease have largely focused on targeting abnormalities in renal epithelial cell signaling. ADPKD has many hallmarks of cancer, where targeting T cells has brought novel therapeutic interventions. However, little is known about the role and therapeutic potential of T cells in ADPKD. Here, we used an orthologous ADPKD model, Pkd1 p.R3277C (RC), to begin to define the role of T cells in disease progression. Using flow cytometry, we found progressive increases in renal CD8+ and CD4+ T cells, correlative with disease severity, but with selective activation of CD8+ T cells. By immunofluorescence, T cells specifically localized to cystic lesions and increased levels of T-cell recruiting chemokines (CXCL9/CXCL10) were detected by qPCR/in situ hybridization in the kidneys of mice, patients, and ADPKD epithelial cell lines. Importantly, immunodepletion of CD8+ T cells from one to three months in C57Bl/6 Pkd1RC/RC mice resulted in worsening of ADPKD pathology, decreased apoptosis, and increased proliferation compared to IgG-control, consistent with a reno-protective role of CD8+ T cells. Thus, our studies suggest a functional role for T cells, specifically CD8+ T cells, in ADPKD progression. Hence, targeting this pathway using immune-oncology agents may represent a novel therapeutic approach for ADPKD.
Keywords: adaptive immunity, autosomal dominant polycystic kidney disease, CD8+ T cells, Pkd1 RC mouse model
Autosomal dominant polycystic kidney disease (ADPKD) is the most common, potentially lethal monogenic nephropathy caused predominantly by mutations to either PKD1 or PKD2.1–4 ADPKD accounts for 8% to 10% of patients receiving renal replacement therapy for end-stage renal disease (ESRD) worldwide5 and affects roughly 1:400 to 1:1000 people.6,7 The disease is characterized by dysregulated growth of renal epithelial cells leading to progressive, bilateral fluid-filled renal cysts and resulting in ESRD in about 50% of patients by middle age.8,9 Extrarenal manifestations, such as liver and pancreatic cysts or cardiovascular abnormalities, further decrease quality of life and increase morbidity and mortality.10,11 Previous research focused on targeting pathways central to cyst pathology, such as cyclic adenosine monophosphate/protein kinase A, epidermal growth factor, and mammalian target of rapamycin,12 have provided positive data in murine preclinical trials, but their efficacy in humans was modest at best.13–17 Hence the number of US Food and Drug Administration (FDA)-approved compounds for the treatment of ADPKD are limited, and ESRD is managed by either dialysis or kidney transplant.18 Thus an urgent need exists to explore new treatment options that can slow the progression of ADPKD and prevent advancement to ESRD.
Whereas mutations in PKD1 or PKD2 mediate ADPKD initiation and progression,19,20 observed intra- and interfamilial phenotypic heterogeneity, ranging from in utero onset21,22 to adequate renal function at old age,23 exceeds genic effects,3,24 suggesting that additional, nongenetic factors contribute to disease progression. Further, the functional role of the PKD1 and PKD2 proteins, polycystin-1 and polycystin-2, while extensively studied, remains elusive, leaving many open questions regarding the mechanisms that drive cystogenesis.25–28
Although ADPKD historically has been considered a “neoplasia in disguise,”29 the significant similarities between ADPKD and cancer have been rediscovered more recently.30 In fact, many of the cancer hallmarks as defined by Hanahan and Weinberg31 are applicable to ADPKD (e.g., sustained proliferation,12,30,32 genomic instability,33–35 deregulated cellular energetics,36,37 and inflammation/avoiding immune destruction38–47). Importantly, interstitial inflammation has been reported in human patients with ADPKD, as well as in animal models of the disease.40 In concordance with an inflammatory response, increased levels of pro-inflammatory cytokines, such as monocyte chemoattractant protein-1 and tumor necrosis factor-α, were detected in cyst fluid of patients with ADPKD, and anti-inflammatory therapies have been shown to attenuate disease progression in animal models.38–40 Furthermore, macrophage infiltration can be observed in orthologous and nonorthologous ADPKD models at advanced disease stage,41–43 and a few reports show CD4+ T cells, mast cells, and neutrophils in the interstitium of patients with ADPKD.44–46 Additionally, historic data showed that murine PKD models raised in germ-free environments present with milder cystic disease,47 suggesting a role for the immune system in PKD. In fact, it was shown that M2-like macrophages can promote cyst growth in murine models of autosomal recessive PKD (ARPKD) and ADPKD and that their depletion slows renal and hepatic cystogenesis.41,42,48 However, to date, no research in the literature addresses the role of the adaptive immune system in ADPKD initiation and progression.
Targeting adaptive immunity has become a central focus in developing new therapeutic approaches in multiple malignancies.49,50 In many cancers, increased numbers of tumor-infiltrating T cells are associated with better prognosis,51 consistent with a role for these cells in inhibiting tumor progression. However, the role of different T-cell subtypes is complex because of their heterogeneity.52 As such, different populations have either pro-tumorigenic (e.g., regulatory T cells [Tregs]) or antitumorigenic (e.g., CD8+ T cell) roles. Additionally, cancers have developed multiple cellular and molecular pathways to suppress T-cell functions. Strategies targeting the interaction of specific T cells with cancer cells have shown recent clinical success, leading to FDA approval of checkpoint inhibitors that target the interactions of programmed cell death protein-1 (PD-1) with its ligand PD-L1, resulting in reactivation of antitumor CD8+ T cells.53,54 The progress made in the field of cancer research, specifically the function of T cells in tumorigenesis, may yield new ideas and avenues for ADPKD research. Thus, an essential first step forward is to understand the role of T cells in ADPKD progression.
Here, we characterized T-cell subpopulations in an orthologous mouse model of ADPKD that reproduces critical features of the human disease, including a slow rate of progression. We found that T cells increase in correlation with disease severity and localize specifically to cystic lesions. Importantly, our results define a functional role for CD8+ T cells in inhibiting ADPKD progression, highlighting the potential to adapt cancer immunotherapy strategies to ADPKD.
RESULTS
Renal T-cell numbers are increased in the C57Bl/6 Pkd1RC/RC model compared with wild type
The homozygous Pkd1 p.R3277C (Pkd1RC/RC)55 model genetically and physiologically mimics human ADPKD. It harbors a knock-in mutation that mimics a hypomorphic allele identified in ADPKD families56 and presents over time in the C57Bl/6 background with slowly progressive disease with moderate increases in percent kidney weight/body weight (%KW/BW), renal cystic/fibrotic area (index), chronic inflammation (increased renal interleukin-6/decreased interleukin-10 levels), as well as mild renal function decline (Supplementary Figure S1; Supplementary Table S1). To evaluate how the cystic microenvironment (CME), specifically T cells, differ between C57Bl/6 wild type (WT) and Pkd1RC/RC mice and to correlate changes in the adaptive immune system profile with cystogenesis progression, we used flow cytometry analysis of renal single cell suspensions and analyzed mice at 3, 6, and 9 months of age. In Pkd1RC/RC C57Bl/6 mice at 3 and 6 months, when the cystic disease is mild/moderate, respectively, we detected a statistically significant increase in immune cells (CD45+) and T cells (T-cell receptor β+ [TCRβ+]) in Pkd1RC/RC compared with WT mice, but the most striking increase occurred at 9 months of age, the investigated time point at which PKD is most severe (Figure 1a and b; Supplementary Figure S1; Supplementary Table S1). The same pattern was observed for both cytotoxic T cells (CD8+) and helper T cells (CD4+, Figure 1c and d; Supplementary Table S1). Importantly, as shown by immunofluorescence, T cells (CD3+, CD4+, CD8+) specifically localized around cystic lesions even at mild stages of cystogenesis (3 months) when the global increase of T-cell number in the kidney was modest (Figure 1e and f; Supplementary Figure S2). At 9 months a more diffuse increase of T cells was notable by immunofluorescence, characterized by increased localization to noncystic areas, likely accounting for the striking increase in T-cell number at 9 months observed by flow cytometry (Figure 1b and e). This finding likely reflects the adaptive immune system’s response to increasing tubular atrophy and interstitial expansion/inflammation that can be observed in 9-month-old Pkd1RC/RC C57Bl/6 mice, despite the slowly progressive/mild disease (Supplementary Figure S1C). Importantly, the increase in T-cell numbers between C57Bl/6 WT and Pkd1RC/RC mice was specific to kidney disease, as no changes were observed in spleens (Supplementary Figure S3).
Figure 1. Autosomal dominant polycystic kidney disease (ADPKD) pathology triggers an increase of the adaptive immune system in the C57Bl/6 Pkd1RC/RC model.
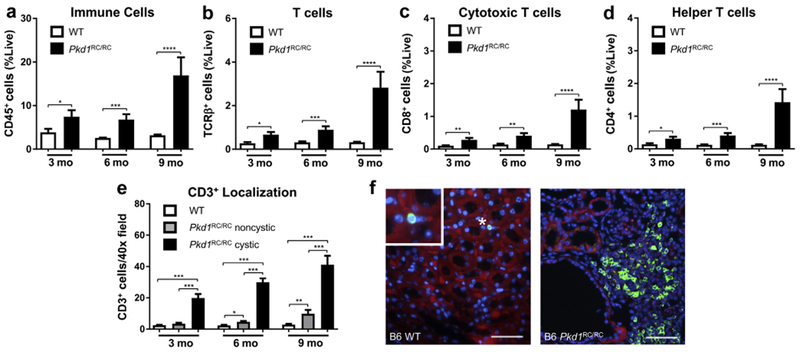
Wild type (WT) and Pkd1RC/RC C57Bl/6 mice were aged to 3, 6, and 9 months and flow cytometry of a renal single cell suspension was used to assess differences in the adaptive immune system at varying disease stages. An increase in immune cells (CD45+) (a), T cells (T-cell receptor β+ [TCRβ+]) (b), cytotoxic T cells (CD8+) (c), and helper T cells (CD4+) (d) was observed in Pkd1RC/RC mice compared with WT control subjects across all 3 time points, but the increase was most striking at 9 months. Immunofluorescence (IF) imaging of formalin-fixed paraffin embedded tissue showed specific localization of T cells (CD3+, comparable marker to TCRβ) near cystic lesions rather than normal tissue even at early disease stages where the overall increase in T-cell numbers was modest (e). (f) Representative IF images showing CD3+ localization near cystic epithelium in a 6-month-old C57Bl/6 Pkd1RC/RC mouse (4′,6-diamidino-2-phenylindole [DAPI] = blue; CD3 = green; E-cadherin = red; bar = 50 μm). Data are represented as mean ± SEM, and a nonparametric Mann-Whitney test was performed on the data. *P ≤ 0.05; **P ≤ 0.01; ***P ≤ 0.001; ****P ≤ 0.0001. N = 10 mice per group (5 females, 5 males). To optimize viewing of this image, please see the online version of this article at www.kidney-international.org.
Increases in T-cell numbers correlate with PKD severity
The Pkd1RC/RC model presents with varying disease severity in different mouse strains, being mildest in the C57Bl/6 and significantly more severe in the 129/S6 and Balb/c backgrounds as measured by percent kidney weight/body weight, renal cystic/fibrotic area (index), renal function, and cytokine levels (Supplementary Figure S1; Supplementary Table S1). Interestingly, among these strains, only renal cyst size but not cyst number varies significantly, suggesting that variances in the rate of cyst progression rather than cyst initiation drive disease severity differences, indicative of a microenvironmental role in disease pathology (Supplementary Figure S1F and G).
To evaluate whether T-cell number increases correlate to disease severity, we performed comparable experiments in 129/S6 and Balb/c Pkd1RC/RC mice as for the C57Bl/6 background. We observed similar changes in the adaptive immune system in 129/S6 and Balb/c Pkd1RC/RC mice (Figure 2; Supplementary Figure S4). However, the overall increase in CD45+ and T-cell subpopulations (TCRβ+, CD8+, and CD4+) compared with WT was much larger in the 129/S6 and Balb/c Pkd1RC/RC models than in the C57Bl/6 Pkd1RC/RC model, correlating with the more severe disease in these strains. This outcome was notable by flow cytometry (Figure 2a–d; Supplementary Figure S4; Supplementary Table S1), as well as by immunofluorescence (Figure 2e; Supplementary Figures S2 and S4; Supplementary Table S1).
Figure 2. The increase of renal adaptive immune cells is augmented in strains with more severe autosomal dominant polycystic kidney disease (ADPKD).
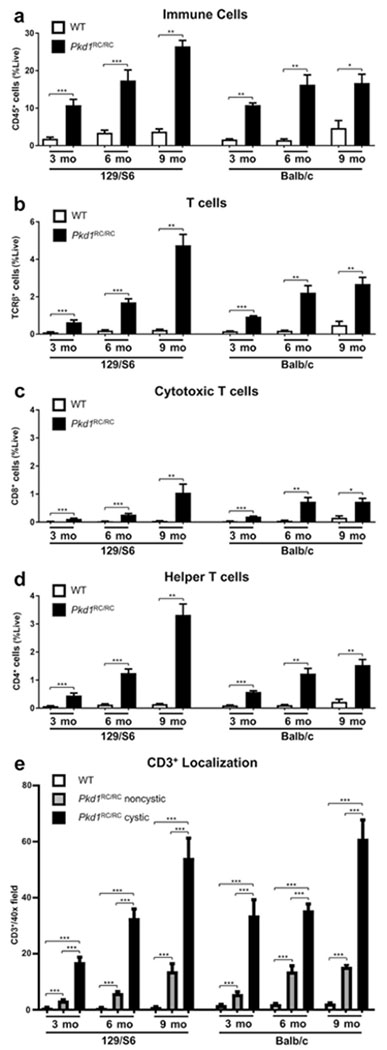
Renal single cell suspensions of wild type (WT) and Pkd1RC/RC 129/S6 and Balb/c mice were analyzed in the same manner as for the C57Bl/6 strain. A more rapid increase, notably at younger ages, of CD45+ (a), T-cell receptor β+ (TCRR+) (b), CD8+ (c), and CD4+ (d) cells was observed in the Pkd1RC/RC compared with WT mice of these strains with more rapidly progressive disease. Immunofluorescence quantification of CD3+ T cells shows a larger number of positive cells near cystic lesions from a very young age on and only a modest increase over time, correlating with the high cystic burden these animals present with at 3 months (e). Data are represented as mean ± SEM, and a nonparametric Mann-Whitney test was performed on the data. *P ≤ 0.05; **P ≤ 0.01; ***P ≤ 0.001. N ≥ 6 mice per group (one-half females, one-half males).
T-cell recruiting cytokines/chemokines are upregulated in ADPKD
To evaluate the rise in T-cell numbers mechanistically, we performed quantitative polymerase chain reaction for interferon (IFN)-γ, a cytokine produced by activated T cells,57 and T-cell recruiting chemokines (Cxcl9, Cxcl1058,59). Levels of all 3 gene products were increased in the kidney as disease progressed (Figure 3a–c; Supplementary Table S1). In cancer, CXCL9 and CXCL10 induce lymphocyte infiltration and lead to suppression of tumor growth because of the infiltration of primarily CD8+ and Th1 CD4+ T cells.60,61 Upon further investigation, in situ hybridization of Balb/c Pkd1RC/RC renal sections revealed that Cxcl9/Cxcl10 are produced primarily in cystic regions, and co-immunofluorescence staining for CD3 showed that T cells co-localize near the cystic regions that produce Cxcl9/Cxcl10 (Figure 3d). From a closer examination of these data, it is apparent that while multiple cells may be producing these chemokines, significant numbers of epithelial cells stained positive, highlighting that the cystic epithelium plays an active role in T-cell recruitment (Figure 3d, inset).
Figure 3. T-cell recruiting chemokines and T-cell secreted cytokines are increased in autosomal dominant polycystic kidney disease (ADPKD).
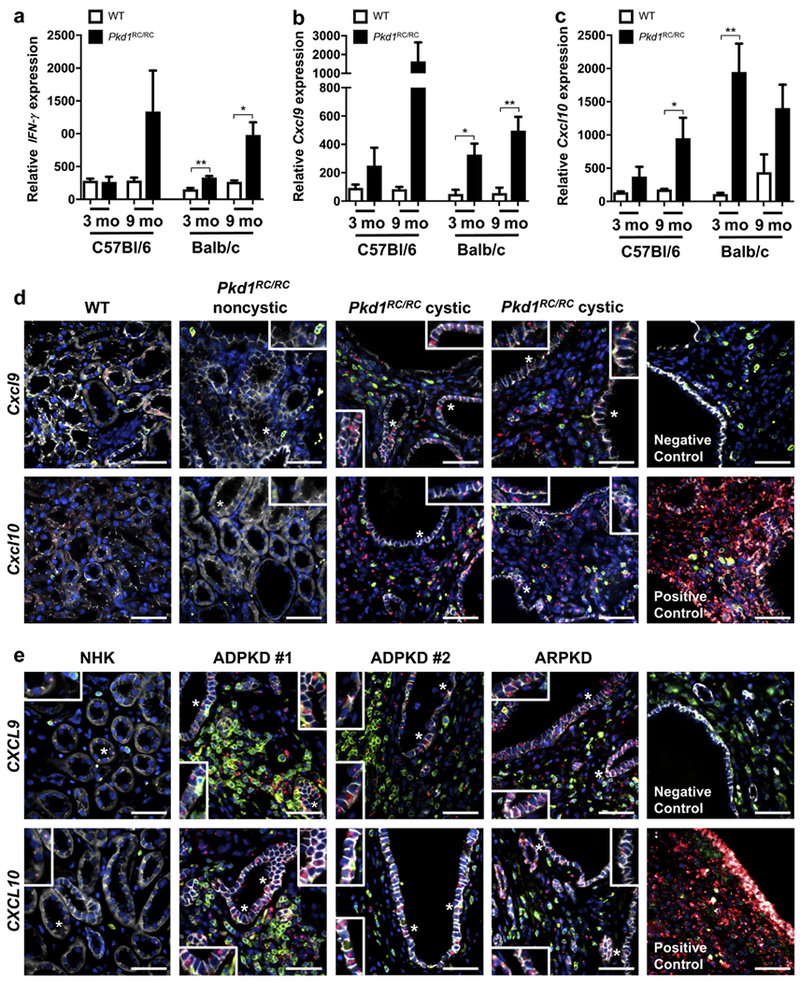
Quantitative polymerase chain reaction (qPCR) of RNA isolated from whole kidney pieces of wild type (WT) and Pkd1RC/RC mice showed increased levels of interferon (IFN)-γ, a cytokine secreted by CD8+ T cells (a) and chemokines known to recruit T cells (b, Cxcl9 and c, Cxcl10) when comparing Pkd1RC/RC with WT mice in both the mild C57Bl/6 and the severe Balb/c background (relative cytokine/chemokine levels may not correlate to disease severity because RNA was isolated from only a small kidney piece, ignoring the nonhomogeneous nature of the disease). (d) Representative in situ hybridization images of 3-month-old Balb/c mice. In WT mice, staining for Cxcl9/Cxcl10 (red) with immunofluorescent co-staining for CD3 (green) and E-cadherin (white) showed no Cxcl9/Cxcl10 expression in microenvironmental cells or renal tubules; 4’,6-diamidino-2-phenylindole [DAPI] = blue. Little Cxcl9/Cxcl10 was detected in noncystic regions of Pkd1RC/RC mice; however, much higher levels of the chemokines were observed in cystic regions where significant numbers of T cells accumulate. Interestingly, both chemokines were also produced by the cystic epithelium and not only by cells within the cystic microenvironment (insets). (e) T-cell infiltration to cystic regions and CXCL9/CXCL10 production by microenvironmental cells and tubular epithelium (insets) were confirmed in human formalin-fixed, paraffin-embedded (FFPE) tissue. Very few T cells (CD3 = green) were infiltrating normal human kidneys (NHKs), and only low levels of CXCL9/CXCL10 (in situ = red) could be detected within the microenvironment or epithelium (E-cadherin = white; 4’,6-diamidino-2-phenylindole [DAPI] = blue). As for Pkd1RC/RC mice, the number of renal T cells were significantly increased in ADPKD/ARPKD patient tissue versus NHK and located predominantly to cystic regions. Here also, significant levels of both chemokines could be detected in the microenvironment and tubular epithelium. Staining of positive and negative control probes for in situ staining are shown. Data are represented as mean ± SEM, and a nonparametric Mann-Whitney test was performed on the data. *P ≤ 0.05; **P ≤ 0.01. N ≥ 6 mice per group (one-half females, one-half males). Bar = 50 μm. ARPDK, autosomal recessive polycystic kidney disease. To optimize viewing of this image, please see the online version of this article at www.kidney-international.org.
To determine if this mechanism of T-cell recruitment is relevant to human disease, we performed in situ hybridization for CXCL9 and CXCL10 on human ESRD ADPKD and ARPKD formalin-fixed-paraffin-embedded kidneys. As in mice, CD3+ T cells co-localized to regions with high CXCL9/CXCL10 levels, and both of these chemokines were produced by the cystic epithelium (Figure 3e). In both ADPKD and ARPKD, we observed similar increases in CXCL9/CXCL10 levels and overall T-cell infiltrate to cystic regions, which were significantly higher compared with normal human kidney tissue.
Because CXCL9/CXCL10 production by cancer cells has been reported previously and predicts tumor outcome,62,63 we wanted to determine if renal epithelial cells can produce CXCL9 and CXCL10 in vitro. Using quantitative polymerase chain reaction on normal renal cortical tubular epithelial (RCTE)64 cells (WT for PKD1/PKD2) and 9-1264 cells (PKD1 null) treated with recombinant human IFN-γ for 24 hours, we were able to show an increase of CXCL9 and CXCL10 mRNA (Figure 4a and b). Interestingly, 9-12 cells had a significantly higher basal level of both cytokines compared with RCTE cells (Figure 4a and b). IFN-γ has previously been shown to have antiproliferative effects on cancer cells via a signal transducer and activator of transcription 1 mechanism.65,66 To explore whether IFN-γ has antiproliferative effects on the ADPKD cystic epithelium, RCTE and 9-12 cells were treated with IFN-γ for 72 hours and cell proliferation was assessed by cell count. The 9–12 cells showed decreased rates of proliferation, whereas there was no effect on normal RCTE cells (Figure 4c), suggesting that IFN-γ produced by T cells can inhibit cyst growth by directly acting on cystic epithelial cells.
Figure 4. Interferon (IFN)-γ stimulates chemokine production and inhibits cell proliferation in autosomal dominant polycystic kidney disease (ADPKD) epithelial cells.
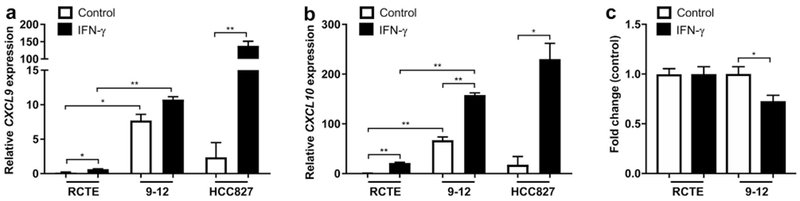
IFN-γ treatment for 24 hours of renal cortical tubular epithelial (RCTE) (PKD1+/+) and 9-12 (PKD1−/−) epithelial cells stimulated expression of CXCL9 (a) and CXCL10 (b) mRNA as shown in vivo in Pkd1RC/RC mice, confirming the ability of tubular epithelia to produce these chemokines. Interestingly, 9-12 cells produced significantly higher basal levels of the chemokines compared with RCTE control cells. The lung adenocarcinoma cell line HCC827 was used as a positive control for the induction of CXCL9/CXCL10 after IFN-γ stimulation. (c) RCTE (PKD1+/+) and 9-12 (PKD1−/−) cells were treated with IFN-γ for 72 hours followed by assessment of cell count. The 9-12 cells treated with IFN-γ had a lower cell count compared with RCTE cells, consistent with an antiproliferative role of IFN-γ. The cell count was normalized to control-treated. Data are represented as mean ± SEM, and a unpaired t-test was performed on the data.*P ≤ 0.05; **P ≤ 0.01.
CD8+ T cells are predominantly activated in Pkd1RC/RC mice
We next examined cell-surface markers of T-cell activation (CD44 [expressed after antigen exposure and a switch from naive to effector or memory T cells]67 and CD69 [expressed after antigen interaction]68) to better understand which T-cell subtype may play a predominant role in cystogenesis. We detected significant increases in activated CD8+ but not CD4+ T cells in C57Bl/6 Pkd1RC/RC mice compared with WT (Figure 5; Supplementary Table S1), suggesting a more prominent role of CD8+ T cells in ADPKD progression. Similarly, CD8+ T-cell activation also correlated with disease severity and was more pronounced in the faster progressing 129/S6 and Balb/c Pkd1RC/RC mice compared with the C56Bl/6 Pkd1RC/RC model (Figure 5; Supplementary Table S1).
Figure 5. CD8+ T cells are predominantly activated in the Pkd1RC/RC mouse model of autosomal dominant polycystic kidney disease (ADPKD).
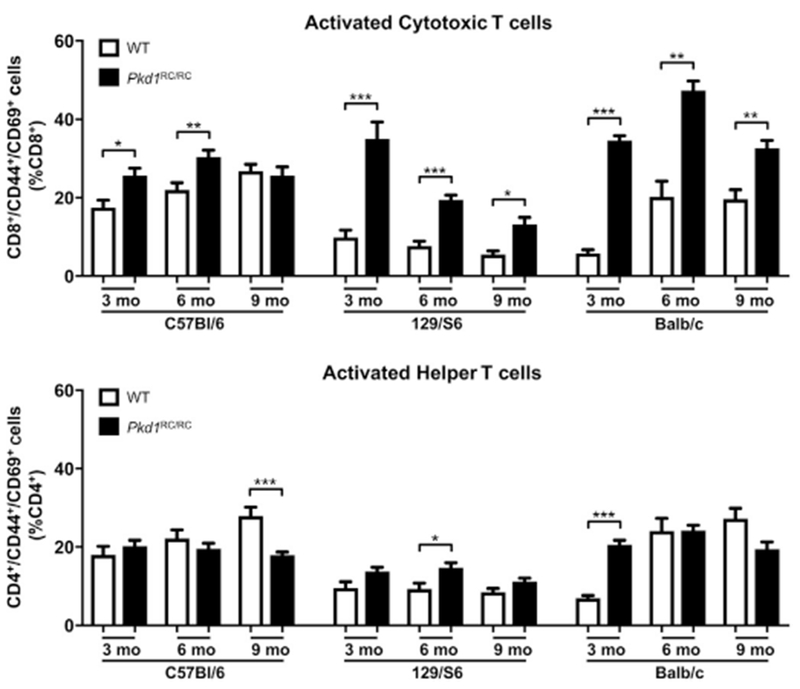
Wild type (WT) and Pkd1RC/RC mice were aged to 3,6, and 9 months and flow cytometry of a renal single cell suspension was used to assess differences in activation of CD8+ and CD4+ T cells at varying disease stages. In all 3 strains, CD8+ T cells were preferentially activated based on the T-cell activation markers CD44/CD69 at early disease stages. Comparably, CD4+ T cells did not show an increase in activation relative to WT at any disease stage. Importantly, CD8+ T cells were significantly more activated in 129/S6 and Balb/c ADPKD mice, correlative with their higher disease burden. Data are represented as mean ± SEM, and a nonparametric Mann-Whitney test was performed on the data. *P ≤ 0.05; **P ≤ 0.01; ***P ≤ 0.001. N ≥ 6 mice per group (one-half females, one-half males).
Interestingly, in WT mice, we detected fewer renal CD45+ and TCRβ+ cells in strains with more severe disease when harboring the Pkd1 p.R3277C mutation (129/S6 or Balb/c vs. C57Bl/6, Supplementary Figure S5A). Furthermore, C57Bl/6 mice had significantly higher levels of CD8+ T cells compared with the other 2 strains, whereas the numbers of CD4+ T cells were similar in all 3 strains (Supplementary Figure S5B and C). Previous studies have documented differences in the immune system profile between C57Bl/6 and Balb/c strains, and these differences partially accounted for the variable responses to infection.69,70 Hence, the difference in CD8+ T cells between WT strains may partially explain the variation in severity of ADPKD across the different strains of Pkd1RC/RC mice.
CD8+ T cells play an anticystogenic role in ADPKD
In cancer models, activated CD8+ T cells constrain tumor growth. Based on the predominant activation of CD8+ T cells, the observed increase of IFN-γ correlative with their activation, and their lower numbers in strains with more severe disease, we hypothesized that depleting this population would result in enhanced disease severity. We therefore tested this hypothesis initially in the C57Bl/6 strain, in which an increase in cystogenesis would be easier to detect compared with the more severe models, using antibody depletion. We depleted CD8+ T cells twice a week by i.p. injection of anti-CD8 antibody (control: IgG) into C57Bl/6 Pkd1RC/RC mice from 1 to 3 months. Even though CD8+ depletion was incomplete after 3 weeks of treatment (Supplementary Figure S6), 3-month-old Pkd1RC/RC anti-CD8–treated mice showed increased disease burden by gross kidney anatomy and histology, a significant increase in percent kidney weight/body weight, fibrotic index, and cyst size, but no change in cyst number (Figure 6a–f; Supplementary Table S2; blood urea nitrogen and plasma creatinine levels were not significantly altered). Interestingly, anti-CD8–treated mice presented with a significant decrease in terminal deoxynucleotidyltransferase–mediated dUTP nick end-labeling (TUNEL) positive cells and a significant increase in proliferating cell nuclear antigen (PCNA) positive cells within the dilated/cystic epithelium (Figure 6g–j), supporting our in vitro RCTE versus 9-12 IFN-γ stimulated cell counting experiment (Figure 4c). Hence these data support a functional role for CD8+ T cells in inhibiting fibrosis and ADPKD cyst progression through increasing apoptosis/decreasing proliferation, but not cyst initiation. Follow-up experiments showed that anti-CD8 depletion in the rapidly progressive 126/S6 Pkd1RC/RC model did not affect disease progression (Supplementary Table S2). This finding may be due to fundamental strain differences such as lower basal numbers in CD8+ T-cell numbers, or it may be a related consequence of more rapidly progressing cysts altering the CME composition, resulting in diminished interactions with the adaptive immune system.
Figure 6. CD8+ T-cell depletion exacerbates cystic disease in C57BI/6 Pkd1RC/RC mice.
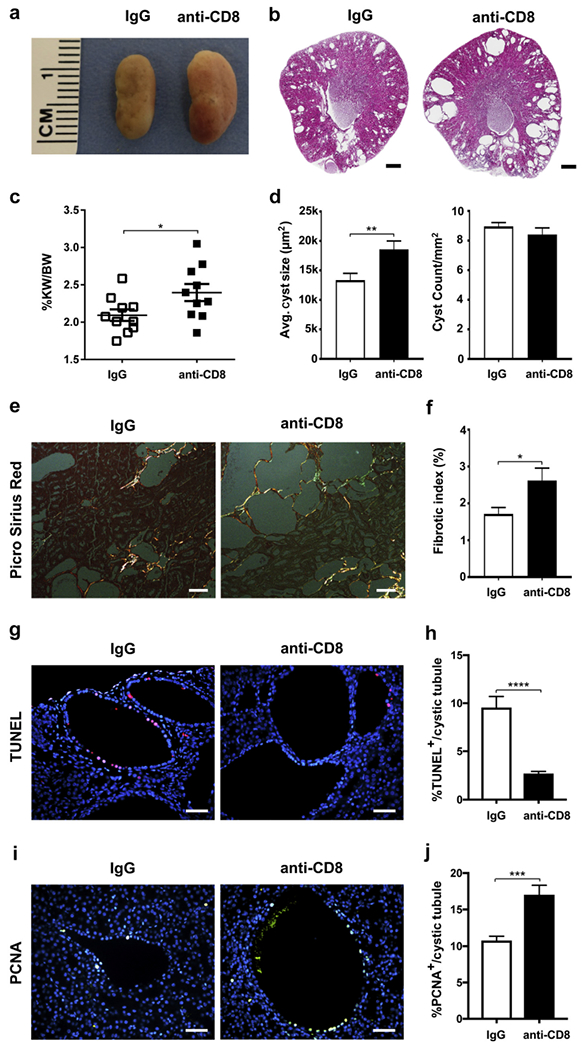
One-month-old C57Bl/6 Pkd1RC/RC mice were treated by i.p. injection weekly for 8 weeks with a CD8-depIeting antibody (10 mg/kg) or IgG control. Depletion of CD8+ T cells worsened cystic disease as apparent by gross anatomy/histology (a,b), and significantly increased percent kidney weight/body weight (%KW/BW) (c), average cyst size (d), and fibrosis (% fibrotic area/[renal area – cystic area]) (e,f). Although average cyst size increased, cyst count remained unchanged between the treated and control groups (d), indicating that CD8+ T cells are important in cyst progression but not initiation. (e) Representative images of Picro Sirius red-stained renal histology sections visualized under polarized light to highlight collagen fibers. (g,h) In line with CD8+ T-cell-mediated cytotoxicity, terminal deoxynucleotidyltransferase–mediated dUTP nick end-labeling (TUNEL) staining revealed a significant decrease in apoptotic epithelial cell numbers within dilated/cystic tubules of anti-CD8 treated animals versus IgG control, suggesting that programmed cell death is an essential mechanism through which CD8+ T cells control cyst growth (g, representative images of immunofluorescent [IF] TUNEL staining, TUNEL = red, 4’,6-diamidino-2-phenylindole [DAPI] = blue). (i,j) Concurrent with the in vitro results that interferon (IFN)-γ reduces epithelial proliferation (Figure 4), dilated/cystic tubules of anti-CD8 treated C57Bl/6 Pkd1RC/RC mice have significantly higher numbers of proliferating cell nuclear antigen (PCNA) positive epithelial cells versus IgG control. (i, Representative images of IF PCNA staining, PCNA = green, DAPI = blue.) Bars = 500 μm (b), 100 μm (e), and 50 μm (g,i). Data are represented as mean ± SEM, and a nonparametric Mann-Whitney test was performed on the data. *P ≤ 0.05; **P ≤ 0.01; ***P ≤ 0.001; ****P ≤ 0.0001. (c,d,f) N = 10 mice per group (5 females, 5 males), (h,j) N = 3 mice per group. To optimize viewing of this image, please see the online version of this article at www.kidney-international.org.
The microenvironment of early-onset compared with typical adult-onset ADPKD is predominantly characterized by an increase in macrophages
Lastly, we examined changes in immune cells in an early-onset ADPKD model. In utero or early-onset ADPKD occurs in <3% of ADPKD cases and genetically is often associated with a complex PKD1/PKD2 genotype.18 To mimic this, we used the C57Bl/6 Pkd1 p.R3277C model crossed with the C57Bl/6 Pkd1 del2 model71 (Pkd1RC/−), which presents with rapidly progressive cystogenesis leading to death at approximately postnatal day 2555 compared with the Pkd1RC/RC model, which, dependent on the strain, may die at 12 months or older. At postnatal day 20, we analyzed the adaptive immune system as previously described. We noted, as with the Pkd1RC/RC model, an overall increase in immune cells; however, this increase was 2.3-fold more pronounced, likely correlating with increased disease severity (Figure 7a). Interestingly, the CME profile was strikingly different between both models. Whereas T-cell numbers increased in both (Figure 7b), the Pkd1RC/− CME was highly inflamed, as characterized by a marked increase in macrophages (CD64+; Figure 7c). This increase predominantly drove the overall increase in CD45+ cells, as evident by the contribution of macrophages to the CD45+ cell population being significantly increased and the contribution of T cells decreased (Figure 7d and e). This striking increase in macrophages suggests a potential key role of this cell type in rapidly progressive disease, as previously reported in other rapidly progressive PKD models used for preclinical trials.41,42 It also is characteristic of a highly inflamed microenvironment, which has been associated with more severe human disease, characterized by lower renal function and higher total kidney volume compared with typical ADPKD.72,73 Correlatively, macrophage numbers have been shown to increase by histology in patients with ARPKD or advanced ADPKD42,74; however, detailed analyses at different ADPKD stages are lacking.
Figure 7. In a rapidly progressive autosomal dominant polycystic kidney disease (ADPKD) model, macrophages predominantly account for the rise in immune cells associated with disease.
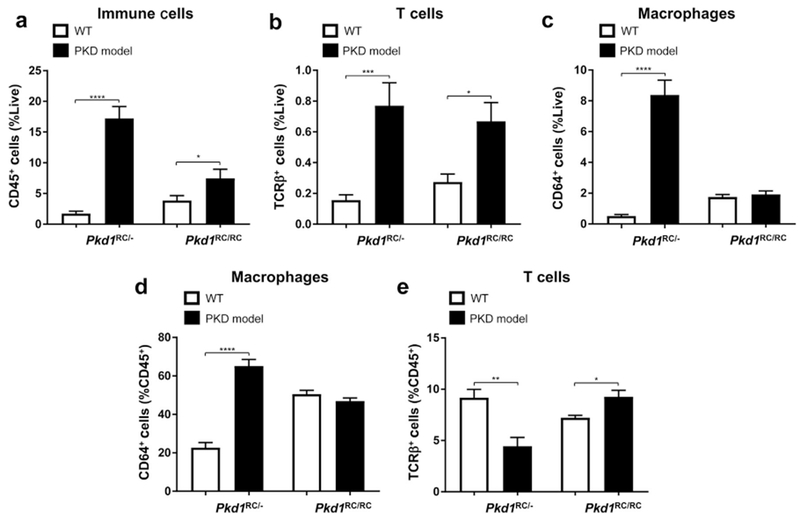
Both C57Bl/6 Pkd1RC/− mice (postnatal [P] 20) and Pkd1RC/RC mice (3 months) presented with an increase in CD45+ cells compared with wild type (WT); however, the fold increase is more pronounced in the rapidly progressive disease (a). Although T-cell numbers increase in both models (b), the increase in macrophage numbers account for the majority of the increase in CD45+ cells in the Pkd1RC/− model (c,d,e). Thus these data indicate that the microenvironment in the Pkd1RC/− model is highly inflamed, with macrophages being likely one of the key players in disease progression. Further, the adaptive and innate immune system may have a different interplay and role in cystogenesis in the rapid versus slow model of ADPKD. Data are represented as mean ± SEM, and a nonparametric Mann-Whitney test was performed on the data. *P ≤ 0.05; **P ≤ 0.01; ***P ≤ 0.001; ****P ≤ 0.0001. N ≥ 8 mice per group (one-half females, one-half males).
DISCUSSION
Therapeutic strategies in ADPKD have largely focused on targeting dysregulated growth pathways in cystic epithelial cells, which are presumably the direct consequence of mutations in the PKD1 or PKD2 genes. This is analogous to targeted therapies directed against oncogenic drivers in cancer. However, in cancer, it has become clear that progression of tumors does not only involve oncogenic signaling pathways but also entails complex interactions between the cancer cells and the surrounding tumor microenvironment. It has been suggested that similar interactions are important in ADPKD progression.30
The results of our study demonstrate, for the first time, changes in adaptive immune cell populations and a functional role for CD8+ T cells in ADPKD progression. Using an orthologous mouse model that mimics the slowly progressive disease of humans, we identified a rise in both renal CD8+ and CD4+ T cells that correlated with disease severity, with predominant activation of CD8+ T cells. Importantly, even at mild stages of disease when the observed rise in T-cell numbers, as measured by flow cytometry, were modest, T cells specifically localized to cystic lesions and only increased in the kidney, suggesting that specific interactions between the cystic epithelium and T cells results in recruitment and activation of T cells. Our data support a model where T-cell recruitment occurs as a secondary event to cyst initiation/progression, presumably as a result of neoantigen presentation caused by genomic instability within the cystic epithelium.33,34 Rapidly advancing cyst growth, as observed in the 129/S6 or Balb/c Pkd1RC/RC mice, likely is associated with an overall greater instance of genomic instability, upregulation of the neoantigen presentation pathway, and hence increased T-cell recruitment/CD8+ T-cell activation, as our data confirm. Recruited/activated T cells secrete IFN-γ, resulting in increased production of CD8+ T-cell attracting chemokines (CXCL9/10) by cells within the CME and the cystic epithelium, causing further recruitment of CD8+ T cells in a positive feedback loop. This ultimately reflects the adaptive immune system’s attempt to eliminate cystic epithelia and suggests an anticystogenic role for CD8+ T cells. We confirmed CXCL9/CXCL10 production by CME cells and the tubular epithelium in ADPKD/ARPKD patient samples and show in vivo that CD8+ T cells halt cyst progression by modulating tubular apoptosis and proliferation.
However, as has been shown in cancer,75 recruited T cells may not always be fully capable of eliminating cyst growth because of simultaneous activation of immunosuppressive pathways, which inhibit the function of anti-tumor CD8+ cells. This may explain the continuous growth of cysts even as CD8+ T-cell numbers increase. Targeting these immunosuppressive pathways can result in reactivation of T cells and immunoelimination of tumors.76,77 One such pathway is the immune checkpoint PD-1/PD-L1,76 where PD-1 is expressed on activated T cells and PD-L1 is expressed on other cell types (epithelial cells, cancer cells, and inflammatory cells).78 Binding of PD-L1 to PD-1 inactivates T-cell responses and leads to an exhausted phenotype. Treatment with blocking antibodies results in reactivation of T cells.50,79 This approach has resulted in FDA approval of checkpoint inhibitors in multiple types of cancer. While repurposing of FDA-approved checkpoint inhibitors to ADPKD may not be achievable immediately because of known renal toxicities,80 it is important to note that in multiple clinical cancer trials, checkpoint inhibitors have shown lasting tumor elimination even after stopping therapy.81,82 Thus modifications to dosage/treatment protocols using these agents may be feasible for ADPKD, where prolonged efficacy is needed.
Our data further highlight that caution is warranted when choosing an ADPKD model to study the common, slow-progressing adult-onset form. For example, we observed that CD8+ T-cell depletion did not promote cystogenesis in the rapidly progressive 129/S6 Pkd1RC/RC mice as it did in the C57/Bl6 Pkd1RC/RC model. This outcome may occur because the rapidly advancing disease leads to activation/deactivation of different pathways compared with slowly progressive disease or because differences in the CME, for example, the notably low CD8+ T-cell numbers in 129/S6 mice, blunt various therapeutic approaches. Correlatively, in rapidly progressing mouse models mimicking early-onset ADPKD, it appears that changes in inflammatory cells, for example, macrophages, are more robust than changes in T cells, whereas in the slower progressing model, T cells appear to predominate. This finding could reflect the time required to develop a mutational burden that results in neoantigens recognized by the adaptive immune system. Further, our data do not show a significant increase in renal macrophages at 3 months of age in C57Bl/6 Pkd1RC/RC mice (Figure 7), as has been published for other rapidly progressive models41,42; however, further time points and the other strains need to be studied to clearly determine whether renal macrophages rise in the Pkd1RC/RC model. Thus, when wanting to test the translatability of immunotherapeutic approaches to alleviate typical ADPKD, choice of model will be critical.
More research will need to be performed to better elucidate the significance of increased CD4+ T-cell numbers observed in our models. Currently it is difficult to predict the potential functional impact resulting from this increase because CD4+ T cells have multiple subtypes (Tregs, Th1, Th2, Th17) with opposing effects on effector CD8+ T-cell function. Specifically, Th1 cells upregulate antigen presentation and as such regulate the duration and magnitude of CD8+ T-cell response, whereas Tregs increase immunosuppressive cytokines and inhibit CD8+ T-cell function.52 Thus immunodepleting all CD4+ may not reveal the role of these distinct populations. We further appreciate that even CD8+ T cells present with varying phenotypes, which we have not addressed here and requires further studies.
In summary, our data are the first to describe an increase in renal T cells associated with disease severity, a specific activation of CD8+ T cells, and a functional role of these cells in inhibiting cystogenesis. Hence, we suggest that immunotherapies leading to reactivation of T cells may represent a novel therapeutic strategy. Because such agents, including immune checkpoint inhibitors, are FDA approved for multiple cancers and specifically act on CD8+ T-cell reactivation, it raises the possibility of repurposing these drugs for use in people with ADPKD.
CONCISE METHODS
Full methods are available in the Supplementary Methods.
Mouse models
We used the C57Bl/6, 129/S6, and Balb/c Pkd1RC/RC model and the C57Bl/6 Pkd1RC/− model, as previously published.55,71 WT control subjects were obtained from Jackson Laboratory, Bar Harbor, ME or Taconic Biosciences Inc, Rensselaer, NY.
Human samples
De-identified human ADPKD/ARPKD and normal human kidney formalin-fixed, paraffin-embedded sections were obtained from the Kansas PKD Research and Translational Core Center (P30 DK106912) at the University of Kansas Medical Center.
Kidney function analyses
Blood urea nitrogen was measured using the QuantiChrom Urea Assay Kit (BioAssay Systems, Hayward, CA) according to the manufacturer’s protocol. Plasma creatinine concentration was analyzed with high-performance liquid chromatography-tandem-mass spectrometry (HPLC-MS/MS; Applied Biosystems 3200 Q TRAP, Foster City, CA).83
Histomorphometric analysis
Cystic index, cyst size, and cyst number were analyzed using a custom-built NIS-Elements AR v4.6 macro (Nikon, Minato, Tokyo, Japan). Fibrotic area was analyzed from picrosirius red-stained kidney sections, visualized using an Olympus BX41 microscope (Olympus Corporation, Center Valley, PA) with a linear polarizer.
Cell culture
All cell lines have been previously described.64,84 Cells were grown in either DMEM/F12 +L-glutamine, 15nM HEPES (Corning Inc., Corning, NY; RCTE, 9-12) or RPMI-1640 +L-glutamine (Corning; HCC827) supplemented with 10% fetal bovine serum (VWR International, Radnor, PA) and 1% penicillin-streptomycin (Corning).
Proliferation assay
RCTE and 9-12 cells were treated for 72 hours with IFN-γ (100 ng/ml) or phosphate-buffered saline solution (control) and subsequently counted using the Cellometer Auto T4 (Nexcelom Bioscience, Lawrence, MA).
Immunofluorescence Labeling/Quantification
Tissues were prepared for IF labeling as previously described55 with the following modification: Autofluorescence quenching with 0.1% Sudan Black in 70% ethanol, 2-hour antigen retrieval at 100 °C, washes in tris-buffered saline solution and Tween 20 (TBST). Terminal deoxynucleotidyltransferase–mediated dUTP nick end-labeling staining was performed according to the manufacturer’s protocol (In Situ Cell Death Detection Kit, TMR red; Sigma-Aldrich Inc., St. Louis, MO). Quantification was performed using NIS-Elements AR v4.6 (Nikon). Antibody details can be found in the Supplementary Methods.
Quantitative polymerase chain reaction
Renal tissue RNA was isolated from a small piece of flash-frozen tissue using the RNeasy Plus Mini Kit (Qiagen, Germantown, MD) and cDNA was synthesized using the qScript XLT cDNA SuperMix (Quantabio, Beverly, MA). For human cell RNA, RCTE, 9–12, and HCC827 cells were treated with IFN-γ (100 ng/ml) or phosphate-buffered saline solution (control) for 24 hours prior to RNA isolation. Quantitative polymerase chain reaction was performed using the PowerSYBER PCR Master Mix (Applied Biosystems) on a CFX96 Real-Time System (Bio-Rad Laboratories, Hercules, CA). Primer details can be found in the Supplementary Methods.
Single cell suspension
Dissected kidney and spleen tissue were mechanically dissociated and digested in a mixture containing DMEM/F12, Liberase TL, and DNaseI at 37 °C for 30 minutes. Dissociation was completed using an 18G needle and quenched using FA3 buffer. Cells were passed through a 100 μm filter, underwent a red blood cell lysis, and then were passed through a 70-#x03BC;m filter.
Flow cytometry
T-cell panel protocol.
The single cell suspension was blocked in anti-mouse CD16/CD32 on a rocker for 15 minutes at 4 °C. Fix viability dye and conjugated antibodies were then added, and cells were incubated in the dark on a rocker at 4 °C for 45 minutes. Cells were resuspended in FA3 buffer and ran on the Gallios Flow Cytometer Machine (Beckman Coulter, Brea, CA). Antibody details can be found in the Supplementary Methods.
Confirmation of CD8+ T-cell depletion (collection/flow protocol).
Whole blood (50 μl) from a submandibular blood draw was collected in 10 μl heparin. Blood was lysed in 3 ml of red blood cell lysis buffer for 3 minutes at room temperature, quenched with FA3 buffer, and pelleted. Pellets were stained/analyzed as previously described.
Data analysis.
Data were analyzed using the Kaluza Analysis v1.5 software (Beckman Coulter). A gating workflow is shown in Supplementary Figure 7A.
CD8+ T-cell depletion
One-month-old C57Bl/6 or 129/S6 Pkd1RC/RC mice were treated twice a week for 8 weeks by i.p. injection with 10 mg/kg anti-CD8+ depleting antibody or 10 mg/kg IgG2a control (BioXCell, West Lebanon, NH). After 8 weeks of treatment, the animals were killed and evaluated as previously described.
In situ hybridization
In situ hybridization was performed using the RNAscope RED assay kit (ACDBio, Newark, CA) combined with immunofluorescence. Probe information can be found in the Supplementary Methods.
Statistical analysis
All analyses were performed using PRISM7 (GraphPad Software, La Jolla, CA). Data were analyzed by a nonparametric Mann-Whitney test to determine statistical significance unless otherwise noted and presented as the mean and standard error of the mean (SEM). P values are denoted by *(P ≤ 0.05), **(P ≤ 0.01), ***(P ≤ 0.001), and ****(P ≤ 0.0001).
Supplementary Material
Figure S1. Pkd1RC/RC mice in different murine strains present with varying disease severity. Autosomal dominant polycystic kidney disease (ADPKD) severity of the Pkd1RC/RC model in C57Bl/6, 129/S6, and Balb/C strains was characterized by (A) hematoxylin and eosin (H&E) staining, (B) percent kidney weight/body weight (%KW/BW), (E) cystic index (percent cystic area/renal area), (F) cyst count, (G) cyst size, (H) fibrotic index (percent fibrotic area/[renal area-cystic area]), (I) plasma blood urea nitrogen (BUN) levels, and (J) plasma creatinine levels, and compared with wild type (WT) mice at 3, 6, and 9 months of age. C57Bl/6 Pkd1RC/RC mice presented with the least severe disease, whereas 129/S6 and Balb/c Pkd1RC/RC mice presented with much more rapidly progressive disease. Despite only moderate increases in %KW/BW over time, C57Bl/6 Pkd1RC/RC mice exhibit interstitial expansion, interstitial inflammation, and tubular atrophy over time as shown in panel C, representative H&E photomicrographs of kidneys from 3-, 6-, and 9-month-old C57Bl/6 Pkd1RC/RC mice. In Balb/c Pkd1RC/RC mice %KW/BW significantly decreased at 6 and 9 months of age, likely because of an increasingly ischemic kidney with renal atrophy, which can be attributed to the rapidly progressive disease in this strain as shown in panel D, representative H&E photomicrographs of kidneys from 3-, 6-, and 9-month-old Balb/c Pkd1RC/RC mice. Kidneys from 6- and 9-month-old Balb/c Pkd1RC/RC mice show significant interstitial expansion, tubular atrophy, and tubular cast formation. Concordantly, a significant decrease in cystic index and size can be noted. Similar characteristics start to appear in the 129/S6 model at 9 months of age, and renal atrophy likely would be noticeable if aged longer. Interestingly, cyst count does not vary significantly between mild (C57Bl/6) and severe (129/S6, Balb/c) Pkd1RC/RC strains at 3 months; however, cysts size does differ significantly (3 months, C57Bl/6 vs. 129/S6 or Balb/c: ****), suggesting that the difference in disease severity among these strains is largely driven by differences in cyst progression versus initiation, which is indicative of the role of the microenvironment in disease severity. Renal function decline, as measured by BUN (I), can be observed in all Pkd1RC/RC strains starting at 6 months of age, whereas the more severe models (129/S6 and Balb/c) present with elevated BUN already at 3 months of age. Interestingly, plasma creatinine levels (J) only rise significantly in the rapidly progressive Pkd1RC/RC models compared with WT, suggesting that BUN may be a more sensitive measurement of renal function decline in these mice. Bar = (A) 1 mm, (C,D) 50 μm. Data are represented as mean ± SEM, and a nonparametric Mann-Whitney test was performed on the data. *P ≤ 0.05; **P ≤ 0.01; ***P ≤ 0.001; ****P ≤ 0.0001. N ≥ 6 mice per group (one-half females, one-half males). Significance asterisks above Pkd1RC/RC values represent Mann-Whitney test performed against WT values.
Figure S2. CD4+ and CD8+ T cells localize specifically to cystic lesions in Pkd1RC/RC mice. Immunofluorescence staining of formalin-fixed paraffin-embedded (FFPE) mouse kidney tissues showed specific localization of CD4+ and CD8+ T cells to cystic lesions ([A], CD4, CD8 = green, tubular staining mirrors autofluorescence). Quantification confirmed an overall increase of both populations in the Pkd1RC/RC model compared with wild type (WT), as seen by flow cytometry, and underlined their specific recruitment to the cystic epithelium. (B) C57Bl/6, (C) 129/S6, (D) Balb/c backgrounds. Data are represented as mean ± SEM, and a nonparametric Mann-Whitney test was performed on the data. *P ≤ 0.05. N ≥ 6 mice per group (one-half females, one-half males).
Figure S3. Renal pathology of the Pkd1RC/RC model does not affect immune and T-cell distribution in the spleen. Flow cytometry of spleen single cell suspensions comparing 3-, 6-, and 9-month-old wild type (WT) and Pkd1RC/RC mice showed no consistent differences in numbers of immune cells (CD45+; A), T cells (T-cell receptor β+ [TCRβ+]; B), cytotoxic T cells (CD8+; C), and helper T cells (CD4+; D) across the 3 different strains. Data are represented as mean ± SEM, and a nonparametric Mann-Whitney test was performed on the data. *P ≤ 0.05; **P ≤ 0.01; ***P ≤ 0.001. N ≥ 6 mice per group (one-half females, one-half males).
Figure S4. Changes in renal adaptive immunity correlate with disease severity in the Pkd1RC/RC model. This supplementary figure is a combined representation of the data depicted in Figure 1, Figure 2, and Supplementary Figure S2 of this article. Renal single cell suspensions of wild type (WT) and Pkd1RC/RC C57Bl/6, 129/S6, and Balb/c mice were analyzed for CD45+ (A), T-cell receptor β+ (TCRβ+) (B), CD8+ (C), and CD4+ (D) cell numbers. Further, CD3+ (E), CD8+ (F), and CD4+ (G) T-cell localization was quantified based on proximity localization to cystic regions using immunofluorescence (IF). The fold difference of immune-/T-cell numbers within the kidney and localized to cysts is larger in the more rapidly progressing polycystic kidney disease (PKD) models (129/S6, Balb/C) than in the more slowly progressing PKD model (C57Bl/6) compared with WT (see also Supplementary Table S1). Data are represented as mean ± SEM, and a nonparametric Mann-Whitney test was performed on the data. *P ≤ 0.05; **P ≤ 0.01; ***P #≤ 0.001; ****P ≤ 0.0001. N ≥ 6 mice per group (one-half females, one-half males).
Figure S5. Numbers and distribution of immune and T cells differs between strains of wild-type (WT) mice. Flow cytometry of renal single-cell suspensions was performed on the kidneys of 3-, 6-, and 9-month-old C57Bl/6, 129/S6, and Balb/c WT mice to quantify strain differences in the number of immune (CD45+) and T cells (T-cell receptor β+ [TCRβ+]) (A) with higher numbers in the strain that presented with the mildest polycystic kidney disease (PKD) (C57Bl/6 vs. 129/S6 or Balb/c) in the presence of the Pkd1 p.R3277C mutation. (B) The graph shows the number of CD4+ and CD8+ cells (%Live) in WT mice of the different strains, with the table showing the average CD4+:CD8+ ratio. CD4+:CD8+ T-cell ratio differed between the 3 strains of WT mice. The strain with the most balanced CD4+:CD8+ ratio presented with the least severe disease when harboring the PKD mutation. (C) Representative flow diagrams of the CD4+ and CD8+ T-cell sorting. Data in panels A to C represent the 3-month time point, although the trend holds true for the 6- and 9-month time points (not shown). Data are represented as mean ± SEM, and a nonparametric Mann-Whitney test was performed on the data. *P ≤ 0.05; **P ≤ 0.01; ***P ≤ 0.001. N ≥ 6 mice per group (one-half females, one-half males).
Figure S6. CD8+ T-cell depletion efficacy diminishes over time. The efficacy of the anti-CD8 depletion antibody was monitored by performing flow cytometry on blood collected from a submandibular cheek bleed. (A) Representative flow images showing successful CD8+ T-cell depletion 2 weeks after treatment initiation in a C57Bl/6 Pkd1RC/RC mouse. (B) Quantification of CD8+ T-cell numbers over time. By 3 weeks of treatment, CD8+ expression began to re-emerge in treated mice, indicating that from this point forward CD8+ T-cell depletion was incomplete, likely as a result of the animals generating antibodies against the depleting antibody used in this study.
Figure S7. Gating strategy for flow cytometry analysis of all analyzed cellular subtypes of the adaptive immune system. Representative flow images are from a 9-month-old Balb/c Pkd1RC/RC mouse.
Table S1. Histological and adaptive immune parameters of the Pkd1RC/RC model.
Table S2. CD8+ T-cell depletion parameters.
ACKNOWLEDGMENTS
The work was partially supported by a Pilot & Feasibility Grant from the Consortium for Fibrosis Research and Translation, University of Colorado Anschutz Medical Campus, Aurora, Colorado, USA. EK and LT were supported by a T32 (NIDDK 5T32DK007135 [EK], NIGMS 5T32GM007635 [LT]). The Pkd1RC/RC mouse model was graciously provided by the Mayo Clinic Robert M. and Billie Kelley Pirnie Translational Polycystic Kidney Disease Research Center (NIDDK P30 DK090728). ADPKD/ARPKD and normal human kidney tissues were provided by the PKD Biomarkers and Biomaterials Core in the Kansas PKD Research and Translational Core Center (P30 DK106912) at the University of Kansas Medical Center. Human tissues were obtained with the assistance of the KU Cancer Center’s Biospecimen Repository (P30 CA168524) and hospitals participating in the PKD Foundation’s tissue donation program. George S. DeBeck (Nikon Instruments Inc.) aided in the development of the histomorphometric analysis macro for the cystic kidney.
Footnotes
DISCLOSURE
All the authors declared no competing interests.
Supplementary methods.
Supplementary material is linked to the online version of the paper at www.kidney-international.org.
REFERENCES
- 1.Grantham JJ. Mechanisms of progression in autosomal dominant polycystic kidney disease. Kidney Int Suppl. 1997;63:S93–S97. [PubMed] [Google Scholar]
- 2.Grantham JJ, Chapman AB, Torres VE. Volume progression in autosomal dominant polycystic kidney disease: the major factor determining clinical outcomes. Clin J Am Soc Nephrol. 2006;1:148–157. [DOI] [PubMed] [Google Scholar]
- 3.Heyer CM, Sundsbak JL, Abebe KZ, et al. Predicted mutation strength of nontruncating PKD1 mutations aids genotype-phenotype correlations in autosomal dominant polycystic kidney disease. J Am Soc Nephrol. 2016;27:2872–2884. [DOI] [PMC free article] [PubMed] [Google Scholar]
- 4.Porath B, Gainullin VG, Cornec-Le Gall E, et al. Mutations in GANAB, encoding the glucosidase IIalpha subunit, cause autosomal-dominant polycystic kidney and liver disease. Am J Hum Genet. 2016;98:1193–1207. [DOI] [PMC free article] [PubMed] [Google Scholar]
- 5.Grantham JJ. Clinical practice. Autosomal dominant polycystic kidney disease. N Engl J Med. 2008;359:1477–1485. [DOI] [PubMed] [Google Scholar]
- 6.Iglesias CG, Torres VE, Offord KP, et al. Epidemiology of adult polycystic kidney disease, Olmsted County, Minnesota: 1935-1980. Am J Kidney Dis. 1983;2:630–639. [DOI] [PubMed] [Google Scholar]
- 7.Peters DJ, Sandkuijl LA. Genetic heterogeneity of polycystic kidney disease in Europe. Contrib Nephrol. 1992;97:128–139. [DOI] [PubMed] [Google Scholar]
- 8.Torres VE, Harris PC, Pirson Y. Autosomal dominant polycystic kidney disease. Lancet. 2007;369:1287–1301. [DOI] [PubMed] [Google Scholar]
- 9.Grantham JJ, Torres VE, Chapman AB, et al. Volume progression in polycystic kidney disease. N Engl J Med. 2006;354:2122–2130. [DOI] [PubMed] [Google Scholar]
- 10.Rahman E, Niaz FA, Al-Suwaida A, et al. Analysis of causes of mortality in patients with autosomal dominant polycystic kidney disease: a single center study. Saudi J Kidney Dis Transpl. 2009;20:806–810. [PubMed] [Google Scholar]
- 11.Perrone RD, Ruthazer R, Terrin NC. Survival after end-stage renal disease in autosomal dominant polycystic kidney disease: contribution of extrarenal complications to mortality. Am J Kidney Dis. 2001;38:777–784. [DOI] [PubMed] [Google Scholar]
- 12.Harris PC, Torres VE. Genetic mechanisms and signaling pathways in autosomal dominant polycystic kidney disease. J Clin Invest. 2014;124:2315–2324. [DOI] [PMC free article] [PubMed] [Google Scholar]
- 13.Walz G, Budde K, Mannaa M, et al. Everolimus in patients with autosomal dominant polycystic kidney disease. N Engl J Med. 2010;363:830–840. [DOI] [PubMed] [Google Scholar]
- 14.Serra AL, Poster D, Kistler AD, et al. Sirolimus and kidney growth in autosomal dominant polycystic kidney disease. N Engl J Med. 2010;363:820–829. [DOI] [PubMed] [Google Scholar]
- 15.Torres VE, Chapman AB, Devuyst O, et al. Tolvaptan in patients with autosomal dominant polycystic kidney disease. N Engl J Med. 2012;367:2407–2418. [DOI] [PMC free article] [PubMed] [Google Scholar]
- 16.Caroli A, Perico N, Perna A, et al. Effect of longacting somatostatin analogue on kidney and cyst growth in autosomal dominant polycystic kidney disease (ALADIN): a randomised, placebo-controlled, multicenter trial. Lancet. 2013;382:1485–1495. [DOI] [PubMed] [Google Scholar]
- 17.Irazabal MV, Torres VE. Experimental therapies and ongoing clinical trials to slow down progression of ADPKD. Curr Hypertens Rev. 2013;9:44–59. [DOI] [PMC free article] [PubMed] [Google Scholar]
- 18.Harris PC, Torres VE. Polycystic kidney disease, autosomal dominant. GeneReviews. Available at: https://www.ncbi.nlm.nih.gov/books/NBK1246/. Published January 10, 2002; updated July 19, 2018 Accessed July 20, 2018.
- 19.Mochizuki T,Wu G, Hayashi T, et al. PKD2, a gene for polycystic kidney disease that encodes an integral membrane protein. Science. 1996;272:1339–1342. [DOI] [PubMed] [Google Scholar]
- 20.The polycystic kidney disease 1 gene encodes a 14 kb transcript and lies within a duplicated region on chromosome 16. The European Polycystic Kidney Disease Consortium. Cell. 1994;77:881–894. [DOI] [PubMed] [Google Scholar]
- 21.Zerres K, Rudnik-Schoneborn S, Deget F. Childhood onset autosomal dominant polycystic kidney disease in sibs: clinical picture and recurrence risk. German Working Group on Paediatric Nephrology (Arbeitsgemeinschaft fuer Padiatrische Nephrologie). J Med Genet. 1993;30:583–588. [DOI] [PMC free article] [PubMed] [Google Scholar]
- 22.Bergmann C, Bruchle NO, Frank V, et al. Perinatal deaths in a family with autosomal dominant polycystic kidney disease and a PKD2 mutation. N Engl J Med. 2008;359:318–319. [DOI] [PubMed] [Google Scholar]
- 23.Hateboer N, v Dijk MA, Bogdanova N, et al. Comparison of phenotypes of polycystic kidney disease types 1 and 2. European PKD1-PKD2 Study Group. Lancet. 1999;353:103–107. [DOI] [PubMed] [Google Scholar]
- 24.Harris PC, Rossetti S. Determinants of renal disease variability in ADPKD. Adv Chronic Kidney Dis. 2010;17:131–139. [DOI] [PMC free article] [PubMed] [Google Scholar]
- 25.Torres VE, Harris PC. Autosomal dominant polycystic kidney disease: the last 3 years. Kidney Int. 2009;76:149–168. [DOI] [PMC free article] [PubMed] [Google Scholar]
- 26.Nauli SM, Alenghat FJ, Luo Y, et al. Polycystins 1 and 2 mediate mechanosensation in the primary cilium of kidney cells. Nat Genet. 2003;33:129–137. [DOI] [PubMed] [Google Scholar]
- 27.Delling M, Indzhykulian AA, Liu X, et al. Primary cilia are not calcium-responsive mechanosensors. Nature. 2016;531:656–660. [DOI] [PMC free article] [PubMed] [Google Scholar]
- 28.Delling M, DeCaen PG, Doerner JF, et al. Primary cilia are specialized calcium signalling organelles. Nature. 2013;504:311–314. [DOI] [PMC free article] [PubMed] [Google Scholar]
- 29.Grantham JJ. Polycystic kidney disease: neoplasia in disguise. Am J Kidney Dis. 1990;15:110–116. [DOI] [PubMed] [Google Scholar]
- 30.Seeger-Nukpezah T, Geynisman DM, Nikonova AS, et al. The hallmarks of cancer: relevance to the pathogenesis of polycystic kidney disease. Nat Rev Nephrol. 2015;11:515–534. [DOI] [PMC free article] [PubMed] [Google Scholar]
- 31.Hanahan D, Weinberg RA. Hallmarks of cancer: the next generation. Cell. 2011;144:646–674. [DOI] [PubMed] [Google Scholar]
- 32.Nadasdy T, Laszik Z, Lajoie G, et al. Proliferative activity of cyst epithelium in human renal cystic diseases. J Am Soc Nephrol. 1995;5:1462–1468. [DOI] [PubMed] [Google Scholar]
- 33.Battini L, Macip S, Fedorova E, et al. Loss of polycystin-1 causes centrosome amplification and genomic instability. Hum Mol Genet. 2008;17:2819–2833. [DOI] [PMC free article] [PubMed] [Google Scholar]
- 34.Li M, Qin S, Wang L, et al. Genomic instability in patients with autosomal-dominant polycystic kidney disease. J Int Med Res. 2013;41:169–175. [DOI] [PubMed] [Google Scholar]
- 35.Brasier JL, Henske EP. Loss of the polycystic kidney disease (PKD1) region of chromosome 16p13 in renal cyst cells supports a loss-of-function model for cyst pathogenesis. J Clin Invest. 1997;99:194–199. [DOI] [PMC free article] [PubMed] [Google Scholar]
- 36.Rowe I, Chiaravalli M, Mannella V, et al. Defective glucose metabolism in polycystic kidney disease identifies a new therapeutic strategy. Nat Med. 2013;19:488–493. [DOI] [PMC free article] [PubMed] [Google Scholar]
- 37.Warner G, Hein KZ, Nin V, et al. Food restriction ameliorates the development of polycystic kidney disease. J Am Soc Nephrol. 2016;27:1437–1447. [DOI] [PMC free article] [PubMed] [Google Scholar]
- 38.Zheng D, Wolfe M, Cowley BD Jr., et al. Urinary excretion of monocyte chemoattractant protein-1 in autosomal dominant polycystic kidney disease. J Am Soc Nephrol. 2003;14:2588–2595. [DOI] [PubMed] [Google Scholar]
- 39.Li X, Magenheimer BS, Xia S, et al. A tumor necrosis factor-alpha-mediated pathway promoting autosomal dominant polycystic kidney disease. Nat Med. 2008;14:863–868. [DOI] [PMC free article] [PubMed] [Google Scholar]
- 40.Ta MH, Harris DC, Rangan GK. Role of interstitial inflammation in the pathogenesis of polycystic kidney disease. Nephrology (Carlton). 2013;18:317–330. [DOI] [PubMed] [Google Scholar]
- 41.Karihaloo A, Koraishy F, Huen SC, et al. Macrophages promote cyst growth in polycystic kidney disease. J Am Soc Nephrol. 2011;22:1809–1814. [DOI] [PMC free article] [PubMed] [Google Scholar]
- 42.Swenson-Fields KI, Vivian CJ, Salah SM, et al. Macrophages promote polycystic kidney disease progression. Kidney Int. 2013;83:855–864. [DOI] [PMC free article] [PubMed] [Google Scholar]
- 43.Vogler C, Homan S, Pung A, et al. Clinical and pathologic findings in two new allelic murine models of polycystic kidney disease. J Am Soc Nephrol. 1999;10:2534–2539. [DOI] [PubMed] [Google Scholar]
- 44.Zeier M, Fehrenbach P, Geberth S, et al. Renal histology in polycystic kidney disease with incipient and advanced renal failure. Kidney Int. 1992;42:1259–1265. [DOI] [PubMed] [Google Scholar]
- 45.McPherson EA, Luo Z, Brown RA, et al. Chymase-like angiotensin II-generating activity in end-stage human autosomal dominant polycystic kidney disease. J Am Soc Nephrol. 2004;15:493–500. [DOI] [PubMed] [Google Scholar]
- 46.Bernhardt WM, Wiesener MS, Weidemann A, et al. Involvement of hypoxia-inducible transcription factors in polycystic kidney disease. Am J Pathol. 2007;170:830–842. [DOI] [PMC free article] [PubMed] [Google Scholar]
- 47.Werder AA, Amos MA, Nielsen AH, et al. Comparative effects of germfree and ambient environments on the development of cystic kidney disease in CFWwd mice. J Lab Clin Med. 1984;103:399–407. [PubMed] [Google Scholar]
- 48.Locatelli L, Cadamuro M, Spirli C, et al. Macrophage recruitment by fibrocystin-defective biliary epithelial cells promotes portal fibrosis in congenital hepatic fibrosis. Hepatology. 2016;63:965–982. [DOI] [PMC free article] [PubMed] [Google Scholar]
- 49.Callahan MK, Wolchok JD. At the bedside: CTLA-4- and PD-1-blocking antibodies in cancer immunotherapy. J Leukoc Biol. 2013;94:41–53. [DOI] [PMC free article] [PubMed] [Google Scholar]
- 50.Topalian SL, Drake CG, Pardoll DM. Immune checkpoint blockade: a common denominator approach to cancer therapy. Cancer Cell. 2015;27:450–461. [DOI] [PMC free article] [PubMed] [Google Scholar]
- 51.Restifo NP, Dudley ME, Rosenberg SA. Adoptive immunotherapy for cancer: harnessing the T cell response. Nat Rev Immunol. 2012;12:269–281. [DOI] [PMC free article] [PubMed] [Google Scholar]
- 52.DeNardo DG, Andreu P, Coussens LM. Interactions between lymphocytes and myeloid cells regulate pro- versus anti-tumor immunity. Cancer Metastasis Rev. 2010;29:309–316. [DOI] [PMC free article] [PubMed] [Google Scholar]
- 53.Ribas A, Hamid O, Daud A, et al. Association of pembrolizumab with tumor response and survival among patients with advanced melanoma. JAMA. 2016;315:1600–1609. [DOI] [PubMed] [Google Scholar]
- 54.Long GV, Weber JS, Larkin J, et al. Nivolumab for patients with advanced melanoma treated beyond progression: analysis of 2 phase 3 clinical trials. JAMA Oncol. 2017;3:1511–1519. [DOI] [PMC free article] [PubMed] [Google Scholar]
- 55.Hopp K, Ward CJ, Hommerding CJ, et al. Functional polycystin-1 dosage governs autosomal dominant polycystic kidney disease severity. J Clin Invest. 2012;122:4257–4273. [DOI] [PMC free article] [PubMed] [Google Scholar]
- 56.Rossetti S, Kubly VJ, Consugar MB, et al. Incompletely penetrant PKD1 alleles suggest a role for gene dosage in cyst initiation in polycystic kidney disease. Kidney Int. 2009;75:848–855. [DOI] [PMC free article] [PubMed] [Google Scholar]
- 57.Nakajima C, Uekusa Y, Iwasaki M, et al. A role of interferon-gamma (IFN-gamma) in tumor immunity: T cells with the capacity to reject tumor cells are generated but fail to migrate to tumor sites in IFN-gamma-deficient mice. Cancer Res. 2001;61:3399–3405. [PubMed] [Google Scholar]
- 58.Marshall A, Celentano A, Cirillo N, et al. Tissue-specific regulation of CXCL9/10/11 chemokines in keratinocytes: implications for oral inflammatory disease. PLoS One. 2017;12:e0172821. [DOI] [PMC free article] [PubMed] [Google Scholar]
- 59.Lucca LE, Hafler DA. Resisting fatal attraction: a glioma oncometabolite prevents CD8+ T cell recruitment. J Clin Invest. 2017;127:1218–1220. [DOI] [PMC free article] [PubMed] [Google Scholar]
- 60.Tokunaga R, Zhang W, Naseem M, et al. CXCL9, CXCL10, CXCL11/CXCR3 axis for immune activation—a target for novel cancer therapy. Cancer Treat Rev. 2017;63:40–47. [DOI] [PMC free article] [PubMed] [Google Scholar]
- 61.Bronger H, Singer J, Windmuller C, et al. CXCL9 and CXCL10 predict survival and are regulated by cyclooxygenase inhibition in advanced serous ovarian cancer. Br J Cancer. 2016;115:553–563. [DOI] [PMC free article] [PubMed] [Google Scholar]
- 62.Kistner L, Doll D, Holtorf A, et al. Interferon-inducible CXC-chemokines are crucial immune modulators and survival predictors in colorectal cancer. Oncotarget. 2017;8:89998–90012. [DOI] [PMC free article] [PubMed] [Google Scholar]
- 63.Ding Q, Lu P, Xia Y, et al. CXCL9: evidence and contradictions for its role in tumor progression. Cancer Med. 2016;5:3246–3259. [DOI] [PMC free article] [PubMed] [Google Scholar]
- 64.Loghman-Adham M, Nauli SM, Soto CE, et al. Immortalized epithelial cells from human autosomal dominant polycystic kidney cysts. Am J Physiol Renal Physiol. 2003;285:F397–F412. [DOI] [PubMed] [Google Scholar]
- 65.Buszello H Antiproliferative effects of four different cytokines on renal carcinoma cell lines. Anticancer Res. 1995;15:735–738. [PubMed] [Google Scholar]
- 66.Bromberg JF, Horvath CM, Wen Z, et al. Transcriptionally active Stat1 is required for the antiproliferative effects of both interferon alpha and interferon gamma. Proc Natl Acad Sci U S A. 1996;93:7673–7678. [DOI] [PMC free article] [PubMed] [Google Scholar]
- 67.Fazekas de St Groth B, Smith AL, Higgins CA. T cell activation: in vivo veritas. Immunol Cell Biol. 2004;82:260–268. [DOI] [PubMed] [Google Scholar]
- 68.Borrego F, Robertson MJ, Ritz J, et al. CD69 is a stimulatory receptor for natural killer cell and its cytotoxic effect is blocked by CD94 inhibitory receptor. Immunology. 1999;97:159–165. [DOI] [PMC free article] [PubMed] [Google Scholar]
- 69.Huang XR, Tipping PG, Shuo L, et al. Th1 responsiveness to nephritogenic antigens determines susceptibility to crescentic glomerulonephritis in mice. Kidney Int. 1997;51:94–103. [DOI] [PubMed] [Google Scholar]
- 70.Sadick MD, Heinzel FP, Shigekane VM, et al. Cellular and humoral immunity to Leishmania major in genetically susceptible mice after in vivo depletion of L3T4+ T cells. J Immunol. 1987;139:1303–1309. [PubMed] [Google Scholar]
- 71.Muto S, Aiba A, Saito Y, et al. Pioglitazone improves the phenotype and molecular defects of a targeted Pkd1 mutant. Hum Mol Genet. 2002;11:1731–1742. [DOI] [PubMed] [Google Scholar]
- 72.Klawitter J, Klawitter J, McFann K, et al. Bioactive lipid mediators in polycystic kidney disease. J Lipid Res. 2014;55:1139–1149. [DOI] [PMC free article] [PubMed] [Google Scholar]
- 73.Menon V, Rudym D, Chandra P, et al. Inflammation, oxidative stress, and insulin resistance in polycystic kidney disease. Clin J Am Soc Nephrol. 2011;6:7–13. [DOI] [PMC free article] [PubMed] [Google Scholar]
- 74. Mrug M, Zhou J, Guay-Woodford LM, et al. Renal macrophages in autosomal recessive polycystic kidney disease. Nephrology (Carlton). 2013;18:746. [DOI] [PubMed] [Google Scholar]
- 75.Schreiber RD, Old LJ, Smyth MJ. Cancer immunoediting: integrating immunity’s roles in cancer suppression and promotion. Science. 2011;331:1565–1570. [DOI] [PubMed] [Google Scholar]
- 76.Gong J, Chehrazi-Raffle A, Reddi S, et al. Development of PD-1 and PD-L1 inhibitors as a form of cancer immunotherapy: a comprehensive review of registration trials and future considerations. J Immunother Cancer. 2018;6:8. [DOI] [PMC free article] [PubMed] [Google Scholar]
- 77.Wilson RAM, Evans TRJ, Fraser AR, et al. Immune checkpoint inhibitors: new strategies to checkmate cancer. Clin Exp Immunol. 2018;191:133–148. [DOI] [PMC free article] [PubMed] [Google Scholar]
- 78.Spranger S, Sivan A, Corrales L, et al. Tumor and host factors controlling antitumor immunity and efficacy of cancer immunotherapy. Adv Immunol. 2016;130:75–93. [DOI] [PMC free article] [PubMed] [Google Scholar]
- 79.Pardoll DM. The blockade of immune checkpoints in cancer immunotherapy. Nat Rev Cancer. 2012;12:252–264. [DOI] [PMC free article] [PubMed] [Google Scholar]
- 80.Wanchoo R, Karam S, Uppal NN, et al. Adverse renal effects of immune checkpoint inhibitors: a narrative review. Am J Nephrol. 2017;45:160–169. [DOI] [PubMed] [Google Scholar]
- 81.Martini DJ, Hamieh L, McKay RR, et al. Durable Clinical benefit in metastatic renal cell carcinoma patients who discontinue PD-1/PD-L1 therapy for immune-related adverse events. Cancer Immunol Res. 2018;6:402–408. [DOI] [PubMed] [Google Scholar]
- 82.Lipson EJ, Sharfman WH, Drake CG, et al. Durable cancer regression off-treatment and effective reinduction therapy with an anti-PD-1 antibody. Clin Cancer Res. 2013;19:462–468. [DOI] [PMC free article] [PubMed] [Google Scholar]
- 83.Masuda M, Miyazaki-Anzai S, Keenan AL, et al. Activating transcription factor-4 promotes mineralization in vascular smooth muscle cells. JCI Insight. 2016;1:e88646. [DOI] [PMC free article] [PubMed] [Google Scholar]
- 84.Coldren CD, Helfrich BA, Witta SE, et al. Baseline gene expression predicts sensitivity to gefitinib in non-small cell lung cancer cell lines. Mol Cancer Res. 2006;4:521–528. [DOI] [PubMed] [Google Scholar]
Associated Data
This section collects any data citations, data availability statements, or supplementary materials included in this article.
Supplementary Materials
Figure S1. Pkd1RC/RC mice in different murine strains present with varying disease severity. Autosomal dominant polycystic kidney disease (ADPKD) severity of the Pkd1RC/RC model in C57Bl/6, 129/S6, and Balb/C strains was characterized by (A) hematoxylin and eosin (H&E) staining, (B) percent kidney weight/body weight (%KW/BW), (E) cystic index (percent cystic area/renal area), (F) cyst count, (G) cyst size, (H) fibrotic index (percent fibrotic area/[renal area-cystic area]), (I) plasma blood urea nitrogen (BUN) levels, and (J) plasma creatinine levels, and compared with wild type (WT) mice at 3, 6, and 9 months of age. C57Bl/6 Pkd1RC/RC mice presented with the least severe disease, whereas 129/S6 and Balb/c Pkd1RC/RC mice presented with much more rapidly progressive disease. Despite only moderate increases in %KW/BW over time, C57Bl/6 Pkd1RC/RC mice exhibit interstitial expansion, interstitial inflammation, and tubular atrophy over time as shown in panel C, representative H&E photomicrographs of kidneys from 3-, 6-, and 9-month-old C57Bl/6 Pkd1RC/RC mice. In Balb/c Pkd1RC/RC mice %KW/BW significantly decreased at 6 and 9 months of age, likely because of an increasingly ischemic kidney with renal atrophy, which can be attributed to the rapidly progressive disease in this strain as shown in panel D, representative H&E photomicrographs of kidneys from 3-, 6-, and 9-month-old Balb/c Pkd1RC/RC mice. Kidneys from 6- and 9-month-old Balb/c Pkd1RC/RC mice show significant interstitial expansion, tubular atrophy, and tubular cast formation. Concordantly, a significant decrease in cystic index and size can be noted. Similar characteristics start to appear in the 129/S6 model at 9 months of age, and renal atrophy likely would be noticeable if aged longer. Interestingly, cyst count does not vary significantly between mild (C57Bl/6) and severe (129/S6, Balb/c) Pkd1RC/RC strains at 3 months; however, cysts size does differ significantly (3 months, C57Bl/6 vs. 129/S6 or Balb/c: ****), suggesting that the difference in disease severity among these strains is largely driven by differences in cyst progression versus initiation, which is indicative of the role of the microenvironment in disease severity. Renal function decline, as measured by BUN (I), can be observed in all Pkd1RC/RC strains starting at 6 months of age, whereas the more severe models (129/S6 and Balb/c) present with elevated BUN already at 3 months of age. Interestingly, plasma creatinine levels (J) only rise significantly in the rapidly progressive Pkd1RC/RC models compared with WT, suggesting that BUN may be a more sensitive measurement of renal function decline in these mice. Bar = (A) 1 mm, (C,D) 50 μm. Data are represented as mean ± SEM, and a nonparametric Mann-Whitney test was performed on the data. *P ≤ 0.05; **P ≤ 0.01; ***P ≤ 0.001; ****P ≤ 0.0001. N ≥ 6 mice per group (one-half females, one-half males). Significance asterisks above Pkd1RC/RC values represent Mann-Whitney test performed against WT values.
Figure S2. CD4+ and CD8+ T cells localize specifically to cystic lesions in Pkd1RC/RC mice. Immunofluorescence staining of formalin-fixed paraffin-embedded (FFPE) mouse kidney tissues showed specific localization of CD4+ and CD8+ T cells to cystic lesions ([A], CD4, CD8 = green, tubular staining mirrors autofluorescence). Quantification confirmed an overall increase of both populations in the Pkd1RC/RC model compared with wild type (WT), as seen by flow cytometry, and underlined their specific recruitment to the cystic epithelium. (B) C57Bl/6, (C) 129/S6, (D) Balb/c backgrounds. Data are represented as mean ± SEM, and a nonparametric Mann-Whitney test was performed on the data. *P ≤ 0.05. N ≥ 6 mice per group (one-half females, one-half males).
Figure S3. Renal pathology of the Pkd1RC/RC model does not affect immune and T-cell distribution in the spleen. Flow cytometry of spleen single cell suspensions comparing 3-, 6-, and 9-month-old wild type (WT) and Pkd1RC/RC mice showed no consistent differences in numbers of immune cells (CD45+; A), T cells (T-cell receptor β+ [TCRβ+]; B), cytotoxic T cells (CD8+; C), and helper T cells (CD4+; D) across the 3 different strains. Data are represented as mean ± SEM, and a nonparametric Mann-Whitney test was performed on the data. *P ≤ 0.05; **P ≤ 0.01; ***P ≤ 0.001. N ≥ 6 mice per group (one-half females, one-half males).
Figure S4. Changes in renal adaptive immunity correlate with disease severity in the Pkd1RC/RC model. This supplementary figure is a combined representation of the data depicted in Figure 1, Figure 2, and Supplementary Figure S2 of this article. Renal single cell suspensions of wild type (WT) and Pkd1RC/RC C57Bl/6, 129/S6, and Balb/c mice were analyzed for CD45+ (A), T-cell receptor β+ (TCRβ+) (B), CD8+ (C), and CD4+ (D) cell numbers. Further, CD3+ (E), CD8+ (F), and CD4+ (G) T-cell localization was quantified based on proximity localization to cystic regions using immunofluorescence (IF). The fold difference of immune-/T-cell numbers within the kidney and localized to cysts is larger in the more rapidly progressing polycystic kidney disease (PKD) models (129/S6, Balb/C) than in the more slowly progressing PKD model (C57Bl/6) compared with WT (see also Supplementary Table S1). Data are represented as mean ± SEM, and a nonparametric Mann-Whitney test was performed on the data. *P ≤ 0.05; **P ≤ 0.01; ***P #≤ 0.001; ****P ≤ 0.0001. N ≥ 6 mice per group (one-half females, one-half males).
Figure S5. Numbers and distribution of immune and T cells differs between strains of wild-type (WT) mice. Flow cytometry of renal single-cell suspensions was performed on the kidneys of 3-, 6-, and 9-month-old C57Bl/6, 129/S6, and Balb/c WT mice to quantify strain differences in the number of immune (CD45+) and T cells (T-cell receptor β+ [TCRβ+]) (A) with higher numbers in the strain that presented with the mildest polycystic kidney disease (PKD) (C57Bl/6 vs. 129/S6 or Balb/c) in the presence of the Pkd1 p.R3277C mutation. (B) The graph shows the number of CD4+ and CD8+ cells (%Live) in WT mice of the different strains, with the table showing the average CD4+:CD8+ ratio. CD4+:CD8+ T-cell ratio differed between the 3 strains of WT mice. The strain with the most balanced CD4+:CD8+ ratio presented with the least severe disease when harboring the PKD mutation. (C) Representative flow diagrams of the CD4+ and CD8+ T-cell sorting. Data in panels A to C represent the 3-month time point, although the trend holds true for the 6- and 9-month time points (not shown). Data are represented as mean ± SEM, and a nonparametric Mann-Whitney test was performed on the data. *P ≤ 0.05; **P ≤ 0.01; ***P ≤ 0.001. N ≥ 6 mice per group (one-half females, one-half males).
Figure S6. CD8+ T-cell depletion efficacy diminishes over time. The efficacy of the anti-CD8 depletion antibody was monitored by performing flow cytometry on blood collected from a submandibular cheek bleed. (A) Representative flow images showing successful CD8+ T-cell depletion 2 weeks after treatment initiation in a C57Bl/6 Pkd1RC/RC mouse. (B) Quantification of CD8+ T-cell numbers over time. By 3 weeks of treatment, CD8+ expression began to re-emerge in treated mice, indicating that from this point forward CD8+ T-cell depletion was incomplete, likely as a result of the animals generating antibodies against the depleting antibody used in this study.
Figure S7. Gating strategy for flow cytometry analysis of all analyzed cellular subtypes of the adaptive immune system. Representative flow images are from a 9-month-old Balb/c Pkd1RC/RC mouse.
Table S1. Histological and adaptive immune parameters of the Pkd1RC/RC model.
Table S2. CD8+ T-cell depletion parameters.