Abstract
The inside of a cell is highly crowded with a large number of macromolecules together with solvents and metabolites. To know the molecular-level behaviour of biomolecules in such dense crowding environment, we constructed full atomistic model of the cytoplasm of bacteria, and performed massive all-atom molecular dynamics (MD) simulations. On the other hand, to analyse such big MD data, we need significant computational power and efficient calculation methodology. Here, we introduce what and how we analyse the biomolecule properties from the big trajectory data produced by cellular scale all-atom MD simulations.
1. Introduction
Molecular dynamics (MD) simulations are widely used to investigate the microscopic behaviour of biomolecules. Recently, the scale of the MD simulation has rapidly expanded both spatially and temporally. One of the largest targets is the cellular environments in which various kinds of proteins, RNAs, metabolites are interacting under significantly crowded conditions (in fact, 20~40% of the volume is occupied by biomolecules in the cell1–4). How variable interactions within dense cellular environments may affect the structure and dynamics of biomolecules, and ultimately their function, is one of the most exciting questions in life science5–10. Recently, we constructed a full atomistic model of the cytoplasm of a minimal bacterium11. Using the model, we performed massive all-atom molecular dynamics (MD) simulation, and succeeded in reproducing the molecular-level behaviour of biomolecules in the cell12. On the other hand, the extraction of dynamic features and insight into the interactions of biomolecules from extremely big and complex data was another challenging issue. Conventional analysis tools for MD trajectories cannot easily handle a trajectory of such a big system13–15. In this paper, we introduce the kind of physicochemical properties of biomolecules that we typically analyse from the big MD data of cellular crowding systems and describe how to calculate them using high-performance computer based on spatial decomposition techniques.
2. Models of crowded systems
By integrating data from a variety of experimental sources, we constructed a full atomistic model of the cytoplasm of a bacterium (Mycoplasma genitalium) including all of the molecular components, i.e., proteins, RNA, metabolites, ions, and solvent, that are mapped on the complete biochemical pathways11. The size of the system is 100 nm x 100 nm x 100 nm, which greatly exceeds the size of typical molecular dynamics (MD) simulations, covering about 10% of the volume of an entire cell (MGh in Figure 1 A). Model cytoplasms at middle (MGm) and small (MGs) sizes were additionally constructed. These models were subjected to MD simulation using the highly parallelized MD program GENESIS16 on the supercomputer K12. The resulting data sizes of the MD simulations generated for each model are in the 5–20 TB range as shown in Table 1.
Figure 1.
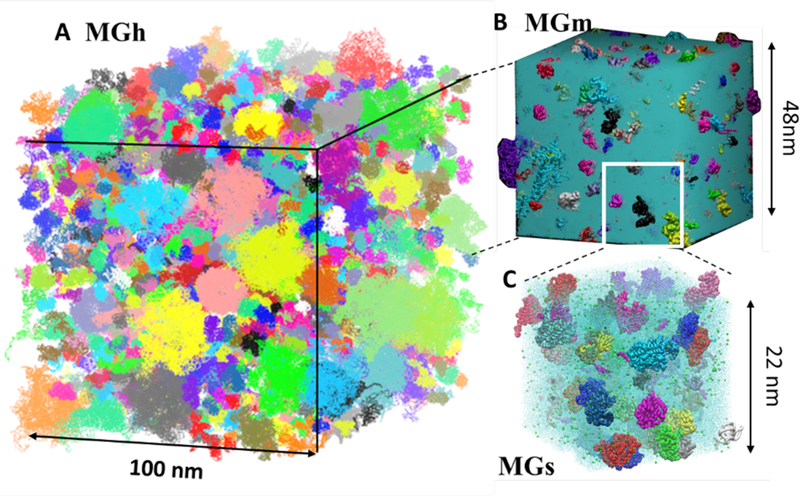
All atom models of the cytoplasm of Mycoplasma genitalium. A: The largest model contains about 100 million atoms (MGh). B: A middle size model containing about 10 million atoms (MGm). C: A small size model containing about 1 million atoms (MGs). Each macromolecules is shown with randomly assigned colours. The interspace of macromolecules are filled with water (blue) and metabolites and ions (for MGh, only the macromolecules are shown).
Table 1.
Data sizes of MD simulations for different bacterial cytoplasm models. For MGh and MGm, atomic coordinates were stored every 1 ps. For MGs, atomic coordinates were stored every 10 ps.
| System | Total number of atoms | Total length of MD sim. (ns). | Data size of total frame (TB) |
|---|---|---|---|
| MGh | 103,708,785 | 20 | 22 |
| MGm | 11,737,298 | 140 | 17 |
| MGs | 1,082,358 | 1,000 × 4 | 5.2 |
3. Results and Discussions
3.1. Analysis of the kinetic properties of macromolecules
How fast do macromolecules (proteins, RNAs, and huge complex, such as ribosomes or GroEL) move through the crowded environment in a cell? This is one of the most fundamental questions in life science. Here, we focus on the translational and rotational diffusive motion of macromolecules. The influence of crowding on these kinetic properties is also discussed.
3.1.1. Translational diffusion coefficient of macromolecules
The translational diffusion coefficient Dtr is one of the most fundamental kinetic properties, quantifying the mobility of macromolecules. Dtr is usually calculated from the square displacement (SD) of target molecules. The time evolution of the SD of a macromolecule α is obtained by tracking the center of mass of α. Multiple profiles of SD for α can be obtained by sliding windows with certain intervals. These profiles are then averaged to obtain mean square displacements (MSD). To obtain translational diffusion coefficient Dtr, a linear function is fitted to the MSD curve and Dtr is subsequently computed from the slope of the fitted line according to the Einstein relation,
| (1) |
where r2(α,τ) denotes the SD of the macromolecule α at time τ from the beginning of one of the windows i. Further details of this analysis are explained elsewhere12.
As an example, Dtr of each macromolecule in MGm was calculated and is compared with experimentally measured diffusion coefficients for green fluorescence proteins (GFPs)17(Figure 2 A). The resulting values are correlated with the size of the different proteins (i.e., their Stokes radii Rs). From this analysis, the agreement with the experimental data or the dependency of Dtr on the molecular size under crowded conditions can be evaluated.
Figure 2.
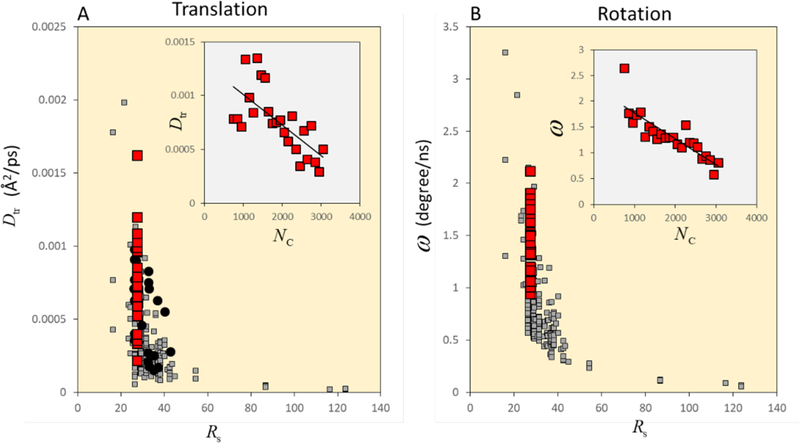
A: Translational diffusion coefficients Dtr of macromolecules in a model bacterial cytoplasm (MGm) as a function of their Stokes radii Rs (grey squares). The MSD was obtained using multiple 10 ns windows. Dtr for the multiple (25) copies of tRNA are highlighted with red squares. The correlation between Dtr and the local extent of crowding Nc for tRNAs is inserted at the top right. The experimental values of Dtr for GFPs (Green Fluorescence Protein) are shown as black filled circles. B: Angular velocity of macromolecules in MGm as a function of Rs. The averaged rotation angle θ was calculated using multiple 10 ns windows. ω was obtained as θ /10.0ns. ω for the multiple (25) copies of tRNA are highlighted as red squares. The correlation between ω and the local extent of crowding Nc for tRNAs is inserted at the top right.
3.1.2. Rotation of macromolecules
The rotation of macromolecules is strongly influenced by protein-protein interactions (PPI) with the surrounding molecules. In addition, the rotational dynamics (such as the rotational relaxation time, the rotational diffusion coefficient, and the axis of rotation) can be directly compared with NMR data. Thus, the properties of rotation can be a useful reference for the elucidation of the PPI or to tune the interaction parameters in MD simulation18. To analyze the overall tumbling motion of a macromolecule α, the rotation matrix R that defines the rotation of α at t= ti to the target orientation at t= ti +τ is used. Then, the rotational correlation function (RCF) in a given time window i as a function of τ (c(α,i,τ)) is obtained by applying the rotation matrix R on the principal axis of inertia or the NH vector of protein backbone or randomly distributed unit vectors attached to the protein structure19. Time-averaged RCF, are then obtained using sliding windows as in the calculation of the translational diffusion coefficients.
The isotropic rotational relaxation timeτrel was obtained by fitting a single (or multiple) exponential
| (2) |
Finally, the isotropic rotational diffusion coefficient of α is obtained as(2)
| (3) |
The instantaneous rotation angle θ and the rotation axis v (vx, vy, vz) can be obtained by converting the rotation matrix R to the quaternion q. The relation between four elements of q and θ, v is as follows,
| (4) |
Figure 2B shows the time-averaged angular velocity of each macromolecule in MGm as a function of their size, Rs. The rotation of macromolecules also displayed a strong molecular size dependency as for translational motion.
3.1.3. Influence of local crowding on the translation and rotation of macromolecules
Because different macromolecules are exposed to different local crowding environments, their dynamics is influenced differently even though they have the same size and structure. For example, there are 25 copies of tRNA in MGm. Each tRNA has different values of Dtr and ω (see red squares in Figure 2). To measure the local degree of crowding around a given target molecule α, we used the number of backbone Cα and P atoms in other macromolecules within the cutoff distance Rcut = 50 Å from the closest Cα and P atoms of α at a given time t as the instantaneous coordination number of crowder atoms, Nc(α,t). Time averages of Nc(α,t) were then calculated over 10 ns windows. The obtained values of Nc are correlated with Dtr or ω in the corresponding 10 ns windows, and histogram-averaged values of Dtr and ω are shown in 100 interval of Nc (see small figures inserted in Figures 2 A and 2B). These analysis show how the degree of local crowding retards the dynamics of macromolecules.
3.2. Analysis of the spatial distribution of solvent and metabolites
In section 3.1, the analysis of kinetic properties (translational and rotational diffusion) of macromolecules is discussed. As the data size is greatly reduced (e.g., instead of all-atom coordinates only the centres of mass are considered), these analyses do not require very large computational resources. On the other hand, properties related to inter-molecular distances, or spatial distributions can involve significant computational costs. One typical application that presents significant challenges is the calculation of the density distribution of solvent molecules around the macromolecules (see Fig. 3). To analyse the number density of solvent as a function of the distance from the closest macromolecule ρ(r), one has to calculate i), the volume of the hypothetical layer at a distance r (with a certain thickness Δr) from the macromolecule (we refer to this volume as the available volume V(r); see red layers in Figure 3), and ii), the number of water molecule that are present in a given layer at distance r, N(r).
Figure 3.
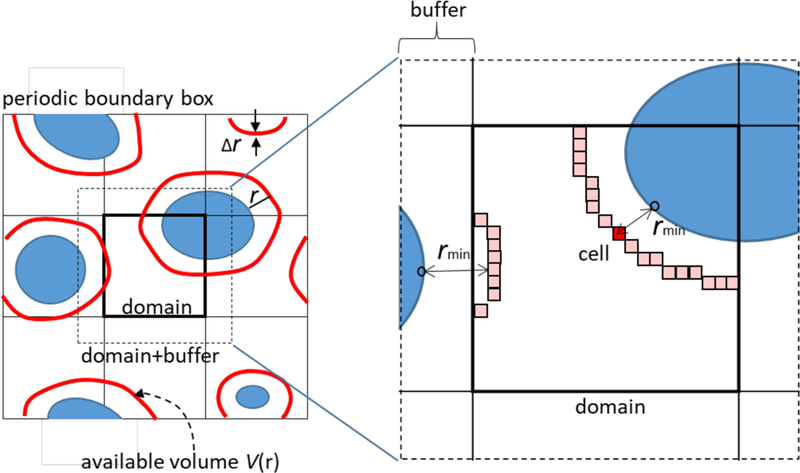
Schematic representation of the analysis of solvent density around macromolecules (blue objects) based on spatial decomposition techniques. The available volume V(r) at a distance r from the closest macromolecule is represented as red layers. The system is equally divided into domains having enough buffer region. Each domain is further divided into smaller cells. The profile of V(r) is approximated by taking the histogram of the number of cells with the minimum distance to the macromolecules rmin.
Because one needs to calculate the distance between vast numbers of sites and macromolecular atoms, the calculation of V(r) needs significant CPU power and large amounts of memory. To overcome these difficulties, we developed a hybrid (MPI/OpenMP) parallelization scheme based on the spatial decomposition technique. The whole system (usually corresponding to a box under periodic boundary conditions) is decomposed into smaller domains. Each domain has a buffer region with enough thickness to obtain the profile of ρ(r) up to a given target distance. A domain is further decomposed into smaller cells. Each MPI process then assigns atoms inside the domain + buffer region to cells. The calculation for each domain is done by each MPI process, and the calculation for cells is decomposed into Open MP threads. For each time step (t), the minimum distance (rmin) from a given cell in a given domain to any atoms of macromolecules in the domain + buffer region is determined. Such a calculation is repeated for all cells in a given domain. Then, the histogram of the number of cells as a function of the rmin at time t (Ncell(r, t)) is obtained with a certain bin size Δr by accumulating the results from different domains. The total number of target solvent atoms in the cells assigned to each bin (Natom(r, t)) is also counted. Finally, ρ(r) is calculated as follows,
| (5) |
where Vcell is the volume of a cell.
In Figure 4. the example of the (normalized) density distribution ρ(r) obtained by this scheme. (r) is shown for several small molecules (such as water, phosphates and amino acids) around macromolecules in MGm. From these profiles, it is possible to understand how strongly these molecules associate with macromolecular surfaces.
Figure 4.
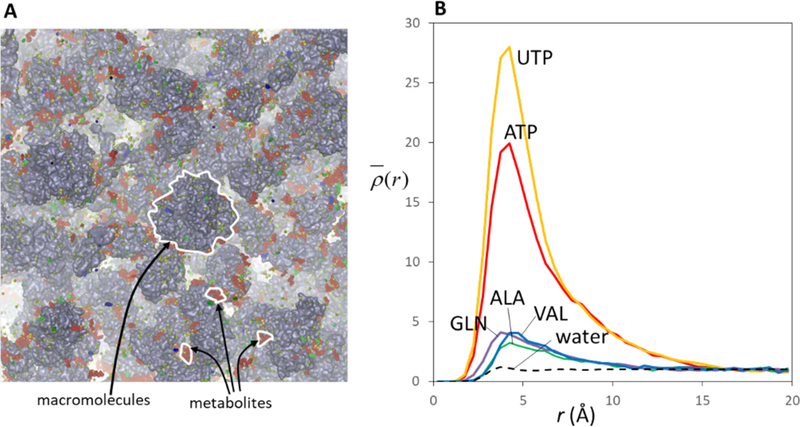
A: Snapshot of metabolites around macromolecules in MGm. red: phosphates (such as ATP: adenosine triphosphate, UTP: uracil triphosphate), green: amino acids (such as ALA: alanine, VAL: valine, and GLN: glutamine), and blue: other types of metabolites (such as NAD: nicotinamide adenine dinucleotide). B: heavy atom number density of five types of metabolites as a function of the distance to the closest macromolecule heavy atom ρ(r). Each profile is normalized (denoted as (r) ) by the density at the most distant region (r=20.0 Å). For the calculation of V(r), the resolution (i.e., a cell size)is set to the 1.0 Å3. (r) of water oxygen atoms is also shown for comparison with a dashed line.
Figure 5 shows benchmark timing results for the calculation of (r) for water oxygen (dashed line in Figure 4B). The performance numbers of the calculation were obtained on RIKEN’s supercomputer system HOKUSAI GreatWave (CPU: SPARC64, performance: 1Pflops). As Figure 5 shows, the calculation is linearly accelerated with an increasing number of CPU cores.
Figure 5.
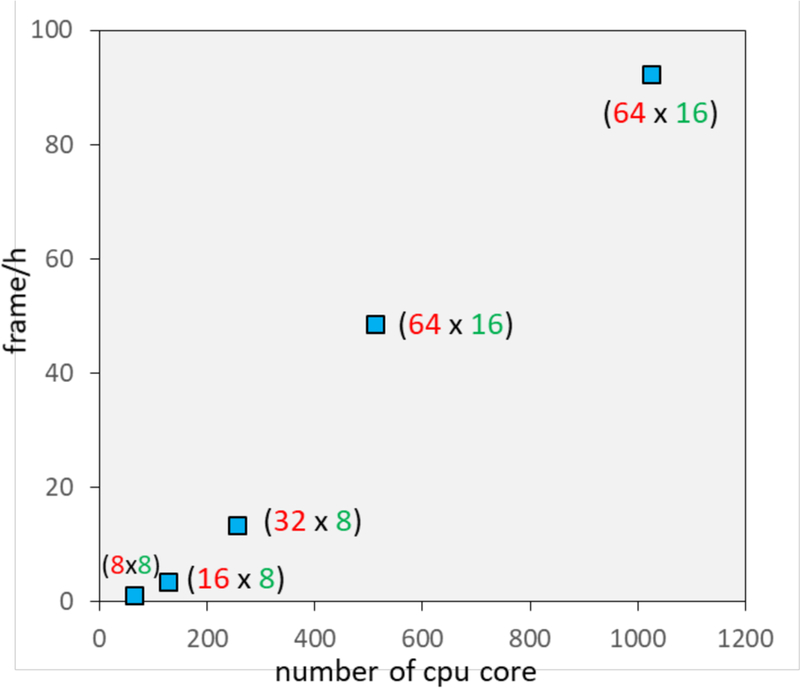
Benchmark calculation of ρ (r) for water (dashed line in Figure 4B). The number of frames (snapshots) processed per hour is shown vs. the number of CPU cores that were used. The number of MPI processes (red) and OpenMP threads (green) are shown beside each marker (blue).
4. Conclusions
We have presented analysis techniques for large all-atom MD trajectories of cellular crowding systems. In addition to the calculation of kinetic properties of macromolecules, we discuss the analysis of the spatial density distribution of solvents and metabolites which requires significant computer power. To accelerate the calculation of such a time-consuming analysis, we developed a hybrid (MPI/OpenMP) parallelization framework based on the spatial decomposition technique. This method exhibits good scalability to more than 1,000 CPU cores on a suitable supercomputer system.
The developed framework can be applicable not only the calculation of solvent density analysis, but also to the analysis of many physicochemical property related to local quantities of a given target molecule or local spatial properties in the system. For example we applied the same framework for the calculation of solvent accessible surface areas (SASA) of macromolecules, protein-protein interactions, and the extraction of hydrogen bonds in the large crowded systems. The analysis methods described here are implemented in one of the analysis modules (SPANA: SPatial decomposition ANAlysis) of the MD software GENESIS16.
ACKNOWLEDGMENTS
The simulations and analysis were carried out using the RIKEN Integrated Cluster of Clusters (RICC) and RIKEN HOKUSAI supercomputer systems, and HPCI strategic research project (hp140229, hp150233) and HPCI general trial use project (hp150145, hp160120) and FLAGSHIP 2020 project focused area 1 “Innovative drug discovery infrastructure through functional control of biomolecular systems (hp160207)”. This work was supported in part by RIKEN QBiC, iTHES and pioneering project “Dynamic structural biology”(to YS), a Grant- in-Aid for Scientific Research on Innovative Area “Novel measurement techniques for visualizing ‘live’ protein molecules at work” (No. 26119006) (to YS), a grant from JST CREST on “Structural Life Science and Advanced Core Technologies for Innovative Life Science Research” (to YS), a Grant-in-Aid for Scientific Research (C) from MEXT (No. 25410025) and Incentive Research Projects from RIKEN (to IY), and support from the U.S. National Institutes of Health (NIH, GM092949, GM084943) and the U.S. National Science Foundation (NSF, MCB 1330560) (to MF).
References
- [1].Minton AP The influence of macromolecular crowding and macromolecular confinement on biochemical reactions in physiological media. J. Biol. Chem (2001), 276, 10577–10580. [DOI] [PubMed] [Google Scholar]
- [2].Ellis RJ; Minton AP Cell biology: join the crowd. Nature (2003), 425, 27–28. [DOI] [PubMed] [Google Scholar]
- [3].Wang Y; Li C; Pielak GJ Effects of proteins on protein diffusion. J. Am. Chem. Soc (2010), 132, 9392–9397. [DOI] [PMC free article] [PubMed] [Google Scholar]
- [4].Monteith WB; Pielak GJ Residue level quantification of protein stability in living cells. Proc. Natl Acad. Sci. USA (2014), 111, 11335–11340. [DOI] [PMC free article] [PubMed] [Google Scholar]
- [5].Inomata K; Ohno A; Tochio H; Isogai S; Tenno T; Nakase I; Takeuchi T; Futaki S; Ito Y; Hiroaki H; Shirakawa M High-resolution multi-dimensional NMR spectroscopy of proteins in human cells. Nature (2009), 458, 106–109. [DOI] [PubMed] [Google Scholar]
- [6].Feig M; Sugita Y Variable interactions between protein crowders and biomolecular solutes are important in understanding cellular crowding. J. Phys. Chem. B (2012), 116, 599–605. [DOI] [PMC free article] [PubMed] [Google Scholar]
- [7].Harada R; Sugita Y; Feig M Protein crowding affects hydration structure and dynamics. J. Am. Chem. Soc (2012), 134, 4842–4849. [DOI] [PMC free article] [PubMed] [Google Scholar]
- [8].Feig M; Sugita Y Reaching new levels of realism in modeling biological macromolecules in cellular environments. J. Mol. Graph. Model (2013), 45, 144–156. [DOI] [PMC free article] [PubMed] [Google Scholar]
- [9].Harada R; Tochio N; Kigawa T; Sugita Y; Feig M Reduced native state stability in crowded cellular environment due to protein-protein interactions. J. Am. Chem. Soc (2013), 135, 3696–3701. [DOI] [PMC free article] [PubMed] [Google Scholar]
- [10].Monteith WB; Cohen RD; Smith AE; Guzman-Cisneros E; Pielak GJ Quinary structure modulates protein stability in cells. Proc. Natl Acad. Sci. USA (2015), 112, 1739–1742. [DOI] [PMC free article] [PubMed] [Google Scholar]
- [11].Feig M; Harada R; Mori T; Yu I; Takahashi K; Sugita Y Complete atomistic model of a bacterial cytoplasm for integrating physics, biochemistry, and systems biology. J. Mol. Graph. Model (2015), 58, 1–9. [DOI] [PMC free article] [PubMed] [Google Scholar]
- [12].Yu I; Mori T; Ando T; Harada R; Jung J; Sugita Y; Feig M Biomolecular interactions modulate macromolecular structure and dynamics in atomistic model of a bacterial cytoplasm. eLife (2016), 5:e19274. [DOI] [PMC free article] [PubMed] [Google Scholar]
- [13].Feig M; Karanicolas J; Brooks CL MMTSB Tool Set: enhanced sampling and multiscale modeling methods for applications in structural biology. J. Mol. Graph. Model (2004), 22, 377–395. [DOI] [PubMed] [Google Scholar]
- [14].Humphrey W; Dalke A; Schulten K VMD: Visual molecular dynamics. Journal of Molecular Graphics (1996), 14, 33–38. [DOI] [PubMed] [Google Scholar]
- [15].Roe DR; Cheatham TE PTRAJ and CPPTRAJ: Software for Processing and Analysis of Molecular Dynamics Trajectory Data. J. Chem. Theory Comput (2013), 9, 3084–3095. [DOI] [PubMed] [Google Scholar]
- [16].Jung J; Mori T; Kobayashi C; Matsunaga Y; Yoda T; Feig M; Sugita Y GENESIS: a hybrid-parallel and multi-scale molecular dynamics simulator with enhanced sampling algorithms for biomolecular and cellular simulations. Wiley Interdiscip. Rev. Comput. Mol. Sci (2015), 5, 310–323. [DOI] [PMC free article] [PubMed] [Google Scholar]
- [17].Nenninger A; Mastroianni G; Mullineaux CW Size dependence of protein diffusion in the cytoplasm of Escherichia coli. J. Bacteriol (2010), 192, 4535–4540. [DOI] [PMC free article] [PubMed] [Google Scholar]
- [18].Michael Feig G. N., Isseki Yu, Po-hung Wang, Yuji Sugita. Challenges and opportunities in connecting simulations with experiments via molecular dynamics of cellular environments. Proceedings of the international meeting on “High-Dimensional Data-Driven Science” (2017).
- [19].Wong V; Case DA Evaluating rotational diffusion from protein MD simulations. J. Phys. Chem. B (2008), 112, 6013–6024. [DOI] [PubMed] [Google Scholar]


