

Abstract
Purpose:
Cancer/testis antigens have emerged as attractive targets for cancer immunotherapy. Clinical studies have targeted MAGE-A3, a prototype antigen that is a member of the MAGE-A family of antigens, in melanoma and lung carcinoma. However, these studies have not yet had a significant impact due to poor CD8+ T cell immunogenicity, platform toxicity, or perhaps limited target antigen availability. In this study we develop an improved MAGE-A immunogen with cross-reactivity to multiple family members.
Experimental Design:
In this study we analyzed MAGE-A expression in The Cancer Genome Atlas and observed that many patients express multiple MAGE-A isoforms, not limited to MAGE-A3, simultaneously in diverse tumors. Based on this, we designed an optimized consensus MAGE-A DNA vaccine capable of cross-reacting with many MAGE-A isoforms, and tested immunogenicity and anti-tumor activity of this vaccine in a relevant autochthonous melanoma model.
Results:
Immunization of this MAGE-A vaccine by electroporation in C57Bl/6 mice generated robust IFN-γ and TNF-α CD8+ T cell responses as well as cytotoxic CD107a/IFN-γ/T-bet triple-positive responses against multiple isoforms. Furthermore, this MAGE-A DNA immunogen generated a cross-reactive immune response in 14 out of 15 genetically diverse, outbred mice. We tested the anti-tumor activity of this MAGE-A DNA vaccine in Tyr::CreER;BRAFCa/+;Ptenlox/lox transgenic mice that develop melanoma upon tamoxifen induction. The MAGE-A DNA therapeutic vaccine significantly slowed tumor growth and doubled median mouse survival.
Conclusions:
These results support the clinical use of consensus MAGE-A immunogens with the capacity to target multiple MAGE-A family members to prevent tumor immune escape.
Keywords: DNA vaccine, MAGE, melanoma, cancer testis antigen
Introduction
Therapeutic cancer vaccines are receiving increasing interest for treatment of various types of cancer, in particular for patients who do not have naturally occurring anti-tumor immunity, or who do not benefit from immune checkpoint blockade (ICB) therapy. However, identifying appropriate antigens with tumor-restricted expression, high potential for immunogenicity in humans, and high expression in multiple tumor types has remained challenging.
In the early 1990’s, the MAGE-1, melanoma antigen-1 (now re-named MAGE-A1), protein was the first cancer antigen discovered to be recognized by cytolytic T lymphocytes in a human melanoma patient (1). Subsequently, 10 additional MAGE-A family members were identified in various human cancers, all of which have no or low expression in normal human tissues, with the exception of the placenta and non-MHC presenting germ cells of the testis (2–4). Due to this restricted expression, the MAGE-A family represents an ideal immune therapy target. Furthermore, because of this restricted expression it may less subject to tissue-specific immune tolerance, making it easier to generate a robust immune response against this family of antigens. In support of this concept, T lymphocytes specific for both class I and II epitopes of various MAGE-A family members have been identified in cancer patients (1,5–10).
The attractiveness of the MAGE family for cancer immune therapy has resulted in the initiation of several clinical trials for vaccines targeting a common family member MAGE-A3. This specific isoform was chosen for clinical study because it was thought at the time to have the highest expression compared to other isoforms in various solid tumors (11). Efforts to target MAGE-A3 have utilized vaccination with a recMAGE-A3 recombinant protein formulation or cellular therapies using CD8+ T cells engineered to express a high-affinity MAGE-A3-targeted TCR. While the recMAGE-A3 vaccine was capable of inducing clear humoral responses in cancer patients, the vaccine produced poor CD8+ T cell responses and ultimately failed to demonstrate efficacy in a Phase III clinical trial of non-small cell lung cancer (12–14). In contrast, the MAGE-A3 TCR cellular therapy demonstrated anti-tumor activity in several patients; however, this therapy exhibited unexpected off-tumor toxicity resulting in several patient deaths in early-stage clinical trials (15–17). Thus, development of therapies targeting antigens in the MAGE-A family driving a more robust T cell response, but exhibiting a better safety profile, is of high priority.
Peptide or DNA vaccination approaches for targeting the MAGE-A family members may represent important tools in this regard (18,19). Several peptides targeting various shared MAGE-A epitopes have been tested in a pre-clinical or clinical setting, and have shown some induction of limited T cell responses as well as patient specific clinical responses (7,20). However, these peptides are HLA-restricted and accordingly this strategy is limited to a subset of patients. Clinical trials utilizing optimized synthetic DNA with improved electroporation technology have shown clinical responses and promise for targeting infectious disease and virally driven cancers (21,22). Synthetic DNA vaccines also have the advantage of encoding entire antigens, instead of individual peptides, in order to generate a broader HLA response. Another important advantage of this platform is the ability to design consensus immunogens to induce cross-reactive immune responses against similar, conserved strains of viruses (23). In the cancer setting, this consensus design strategy can be adapted here to help break tolerance against self-antigens (24,25).
In this study, we thoroughly examined expression of the MAGE-A family members in the Cancer Genome Atlas and discovered that all MAGE-A isoforms, not just MAGE-A3 as previously thought, are highly expressed in human cancers. Additionally, a high proportion of patients, particularly those with melanoma, exhibit simultaneous expression of multiple isoforms within the same tumor sample. We took advantage of the unique genetic relationships within the MAGE-A family of proteins and designed an optimized consensus DNA vaccine capable of targeting multiple MAGE-A family members simultaneously. We show that this vaccine is effective at inducing a robust immune response against multiple MAGE-A family members, and at reducing tumor burden and driving CD8+ T cells to tumors in an autochthonous mouse melanoma model. This optimized, cross-reactive MAGE-A immunogen likely has a significant advantage compared to previously designed MAGE-A3 specific immunotherapies.
Materials and Methods
Cell Culture and Transfection
293T cells were purchased from ATCC and YUMM1.7 cells were a gift from Dr. Ashani Weeraratna. These cells were maintained in Dulbecco’s Modified Eagle Medium (DMEM) supplemented with 10% fetal bovine serum (FBS). These cell lines were routinely tested for Mycoplasma contamination, and were maintained at low passage (<20 passages) in cell culture. 293T cells were transfected with the indicated constructs using the GeneJammer transfection reagent according to the manufacturer’s guidelines (Agilent). Cells were harvested using RIPA lysis buffer (Cell Signaling Technology) supplemented with EDTA-free protease inhibitor (Roche) for analysis by western blot, or were harvested using the RNeasy Plus Mini Kit (QIAGEN) for RNA extraction.
DNA plasmids
The synthetic mouse consensus MAGE-A sequence was generated by aligning mouse MAGE-A1, mouse MAGE-A2, mouse MAGE-A3, mouse MAGE-A5, mouse MAGE-A6 and mouse MAGE-A8 amino acid sequences using ClustalX2. The synthetic human MAGE-A consensus #1 sequence was generated by aligning human MAGE-A2, human MAGE-A3, human MAGE-A6 and human MAGE-A12 amino acid sequences using ClustalX2. The synthetic human MAGE-A consensus #2 sequence was generated by aligning human MAGE-A1, human MAGE-A4, and human MAGE-A5 amino acid sequences using Clustal X2. All sequences were RNA and codon optimized, with a Kozak sequence and an IgE leader sequence added at the N terminus. All plasmids were cloned into the modified pVax1 vector by GenScript. The percentage homology between sequences was calculated using Mega6. Comparative models of the defined MAGE-A consensus sequences were built using the MODELLER algorithm (26), implemented in Discovery Studio (Biovia, San Diego, CA). Sequences were analyzed using the PONDR algorithm to predict potential intrinsically disordered regions prior to model building (27).
Western Blot
4–12% Bis-Tris NuPAGE gels (ThermoFisher Scientific) and PVDF membranes (Millipore) were used for western blot analysis. Odyssey blocking buffer reagents were used for blocking, primary and secondary antibody incubations. The following primary antibodies were used: Anti-Actin AC-15 (Sigma, 1:1000), anti-MAGE-A (6C1, Santa Cruz, 1: 200), and anti-FLAG (M2, Sigma, 1:500). The following secondary antibodies were used: IRDye 680RD goat anti-mouse and IRDye 800CW goat anti-rabbit (LiCor). The membrane was imaged using the LiCor Odyssey CLx.
RNA extraction and qPCR
RNA extraction was performed using a QIAGEN RNeasy Plus Mini Kit. RNA was converted to cDNA using the Applied Biosystems High Capacity RNA to cDNA kit. qPCR was performed using Power SYBR Green on an ABI 7900 Fast RT PCR machine. Expression levels are expressed in terms of 2^-ΔCt (ΔCt is compared to the GAPDH control). The following qPCR primers were used for these studies: Pan-mouse MAGE: CCACCTCAAATAAAGTGTATGGCA (F), ACCAGAAAGTCCACCAAGTCA (R), Mouse MAGE-A consensus: GCCACCATGGATTGGACTTG (F), TGGCCATTGTCTCCTGATCG (R), Human MAGE-A consensus #1: GTTTGCACACCCCAGAAAGC (F), GGGTGGGTAGCTGATGTGAG (R), Human MAGE-A consensus #2: TGGCAGATCTGGTGCACTTT (F), TTCACGTCGATGCCGAAGAT (R), and GAPDH: CCTGCACCACCAACTGCTTA (F), AGTGATGGCATGGACTGTGGT (R).
Mice and Immunization
C57Bl/6 and CD-1 outbred mice were acquired from Jackson Laboratories and housed at the Wistar Institute. The Tyr::CreER;BrafCa/+; Ptenlox/lox transgenic mice were generated by Drs. Bosenberg and McMahon and housed at the University of Pennsylvania (28). Genotyping of the mice was performed as previously described (29). For tumor induction, 6–8 week old mice were treated topically with a 5mM 4-hydroxytamoxifen (4-HT, Sigma) solution on the flank to initiate tumor formation (28). For tumor measurements, the following formula was used: volume= a*b*c/2, where a= maximum of length, b= maximum of width and c= thickness (30). Mice were euthanized when they achieved the standard body condition score (multiple tumor spots with maximum length of 30mm). For immunization, mice were injected with 30μL of DNA (25μg per mouse) into the tibialis anterior (TA) muscle, followed by electroporation using the CELLECTRA®−3P device (Inovio Pharmaceuticals). Mice were delivered two 0.1 Amp electric constant current square-wave pulses for each immunization. The vaccine schedule is indicated in each figure legend. For subcutaneous YUMM1.7 implantation studies, 200,000 cells were implanted into the flank of each mouse. For in vivo depletion experiments, mice were given 200μg of either isotype control antibody (rat IgG2b, anti-keyhole limpet hemocyanin) or CD8 depletion antibody (clone YTS 169.4, BioXCell) intraperitoneally. Tumor volume for subcutaneous tumors was calculated using the formula: Volume=(π/6)*(height)*(width2). Mice were euthanized when tumor diameters exceeded 1.5cm. All animal procedures were done under approval from either the Wistar or University of Pennsylvania Institute Animal Care and Use Committee (IACUC) and the NIH.
Splenocyte and tumor infiltrating lymphocyte (TIL) isolation
After mice were euthanized, spleens and tumor tissues (if applicable) were collected in Roswell Park Memorial Institute (RPMI) medium supplemented with 10% FBS. Spleens were processed using a stomacher, red blood cells were lysed using ACK lysis buffer (LifeTechnologies), and the remaining cells were filtered through a 40μm filter. Tumors were minced using a scalpel, and incubated in a tumor dissociation enzyme mix consisting of: 170mg/L Collagenase I, II and IV (ThermoFisher), 12.5mg/L DNAse I (Roche), 25mg/L Elastase (Worthington) in 50% RPMI + 10% FBS and 50% Hyclone L-15 Leibowitz medium (ThermoFisher). Tumors were incubated in this mixture with end-over-end mixing for 1 hour at 37°C, and then filtered twice through a 40μm filter prior to plating for staining.
ELISpot assay
MABTECH Mouse IFNγ ELISpotPLUS plates were used for ELISpot analysis. 200,000 splenocytes were plated per well and stimulated for 18–24 hours with 5μg/mL of peptides (15mer peptides overlapping by 9 amino acids) in RPMI + 10% FBS. Spots were developed according to the manufacturer’s instructions, and quantified using an ImmunoSpot CTL reader. Spot forming units (SFU) were calculated by subtracting media alone wells from the peptide stimulated wells. Concanavalin A stimulation was used as a positive control to ensure proper spot development.
Intracellular Cytokine Staining and Flow Cytometry
Splenocytes were stimulated in the presence of 5μg/mL peptide, Protein Transport Inhibitor Cocktail (eBioscience) and FITC α-mouse CD107a (clone 1D4B, Biolegend) for 5–6 hours. Cell stimulation cocktail was used as a positive control for stimulation instead of peptide. TILs were stained directly without stimulation. After stimulation, cells were washed and incubated with LIVE/DEAD violet. Cells were then incubated with surface stain (in 1% FBS in PBS) for 30 minutes at room temperature, followed by fixation and permeabilization (BD Biosciences) for 15 minutes at 4°C. After permeabilization, cells were washed and incubated in intracellular stain (in fixation/permeabilization wash buffer) for 1 hour at 4°C. The following antibodies were used for analysis: PECy5 αCD3 (clone 145–2C11, BD Pharmingen), BV510 αCD4 (clone RM4–5, Biolegend), BV605 αTNFα (clone MP6-XT22), PE αT-bet (clone 4B10, Biolegend), APCCy7 αCD8 (clone 53–6.7, Biolegend), AF700 αCD44 (clone IM7, Biolegend), APC αIFNγ (clone XMG1.2, Biolegend), FITC αCD45 (30-F11, Biolegend), BV711 αPD-1 (clone 29F.1A12, Biolegend), PECy7 αCD25 (PC61.5, eBioscience), APC αFoxP3 (clone FJK-16s, eBioscience). All data was collected on an LSR18 flow cytometer (BD Biosciences) and analyzed using FlowJo software (TreeStar). For analysis, media alone control wells were subtracted from peptide containing wells for antigen-specific immune responses.
Immunofluorescence/immunohistochemistry staining
Hematoxylin and Eosin staining was performed according to standard protocols from tissue that was fixed in 10% neutral-buffered formalin and paraffin-embedded. For immunofluorescence staining, tissues were collected in O.C.T. (Tissue-Tek) on dry ice and stored at −80°C. For CD8, CD31 and Ly6G staining, frozen tissue was fixed on slides with 4% paraformaldehyde (in PBS) for 15 minutes at room temperature, and then permeabilized with 0.5% Triton X-100 for 15 minutes at room temperature. The tissue was blocked for 1 hour at room temperature with 2.5% BSA and 5% horse serum in PBS. The Avidin/Biotin Blocking Kit (Vector Labs) was also used to reduce background staining. Primary antibody (CD8α-biotin, 53–6.7 abcam, 1:2000; CD31, ab124432, 1:800; Ly6G-biotin, RB6–8C5 abcam, 1:2000) in 1% horse serum in PBS was incubated overnight at 4°C in a humidified chamber. The next day, the TSA-Biotin kit (Perkin Elmer) was used for signal amplification for the biotinylated primary antibodies, and slides were incubated in secondary antibody (Streptavidin AF488, 1:500, or goat anti-rabbit AF594 1:300) for 30 minutes at room temperature. Slides were mounted with Prolong Gold Antifade with DAPI. Staining of paraffin-embedded tissues was performed by the Wistar Histotechnology Facility. Slides were imaged with a Nikon 80i upright microscope at the Wistar Institue or a Zeiss LSM Confocal microscope at the University of Pennsylvania Cell and Developmental Biology Microscopy Core. Image analysis was performed using Photoshop or Fiji/ImageJ software.
The Cancer Genome Atlas data analysis
RNA-seq data (RSEM values) from The Cancer Genome Atlas (TCGA) was downloaded through the GDAC data portal (https://gdac.broadinstitute.org/). All samples marked as matched normal were filtered and included in the normal tissue control group (n=754). The following human tumor types were analyzed: ACC (n=79), BLCA (n=408), BRCA (n=1100), CESC (n=306), COADREAD (n=382), DLBC (n=48), ESCA (n=185), GBM (n=166), GBMLGG (n=696), HNSC (n=522), KIPAN (n=891), LAML (n=173), LGG (n=530), LIHC (n=372), LUAD (n=518), LUSC (n=501), MESO (n=87), OV (n=307), PAAD (n=179), PCPG (n=184), PRAD (n=498), READ (n=72), SARC (n=263), SKCM (n=472), STAD (n=415), STES (n=600), TGCT (n=156), THCA (n=509), THYM (n=120), UCEC (n=370), UCS (n=57), and UVM (n=80). We set the threshold for expression to be greater than 2 standard deviations above the mean for the normal tissue for each MAGE-A isoform.
Statistical Analysis
All statistical analysis was done using GraphPad Prism software. All error bars represent the mean ± the standard error of the mean (SEM). Statistical significance was determined by a two-tailed t-test for experiments with only 2 experimental groups, or a one-way ANOVA followed by Tukey’s post-hoc HSD test for experiments with more than 2 experimental groups. For tumor growth over time, multiple t-tests were performed for each time point. For mouse survival analysis, significance was determined using a Gehan-Brelow-Wilcoxon test.
Results
MAGE-A isoform expression in human tumors
Various MAGE-A family members have shown to be up-regulated in many different human cancers at the protein level, including non-small cell lung cancer, melanoma, breast cancer, ovarian cancer, colon cancer, multiple myeloma, hepatocellular carcinoma, and others(3,31,32). However, currently available anti-human MAGE-A antibodies cross-react with many different isoforms, making it difficult to evaluate isoform specific expression in patient samples (33). To achieve a more global picture of MAGE-A isoform expression in human cancers, we analyzed human patient RNA-seq data from the Cancer Genome Atlas (TCGA). We downloaded normalized RSEM counts through the GDAC data portal for all human tumors and matched normal samples available (https://gdac.broadinstitute.org/). We used log-transformed data for our analysis. We set the threshold for expression to be greater than 2 standard deviations above the mean for the normal tissue control group for each isoform individually. We found that, despite the fact that most immune therapies target the MAGE-A3 isoform, the other 10 isoforms are also highly expressed in a variety of human cancers (Figure 1A). When examining all human cancer samples available from the GDAC data portal, tumors that express each isoform range from 9.5% (MAGE-A8) to 29.5% (MAGE-A12) (Figure 1B). Expression of MAGE-A isoforms were particularly high for patients with bladder cancer, esophageal cancer, glioblastoma, head and neck cancer, lung squamous cell carcinoma, rectum adenocarcinoma, skin cutaneous melanoma, testicular germ center tumors, and uterine carcinosarcoma (Figure 1A). Importantly, over 80% of patients with these tumor types show expression of one or more MAGE-A isoforms. We also found that it was common for patients to express multiple MAGE-A isoforms simultaneously (Figure 1C). For instance, over half of patients with lung squamous cell carcinoma (LUSC), skin cutaneous melanoma (SKCM) or testicular germ center tumors (TGCT) show expression of more than 5 MAGE-A isoforms simultaneously (Figure 1C). This analysis indicates that an immune therapy targeting multiple MAGE-A isoforms, not just MAGE-A3, would likely be beneficial for a large proportion of patients.
Figure 1. Expression of MAGE-A isoforms in human tumors:
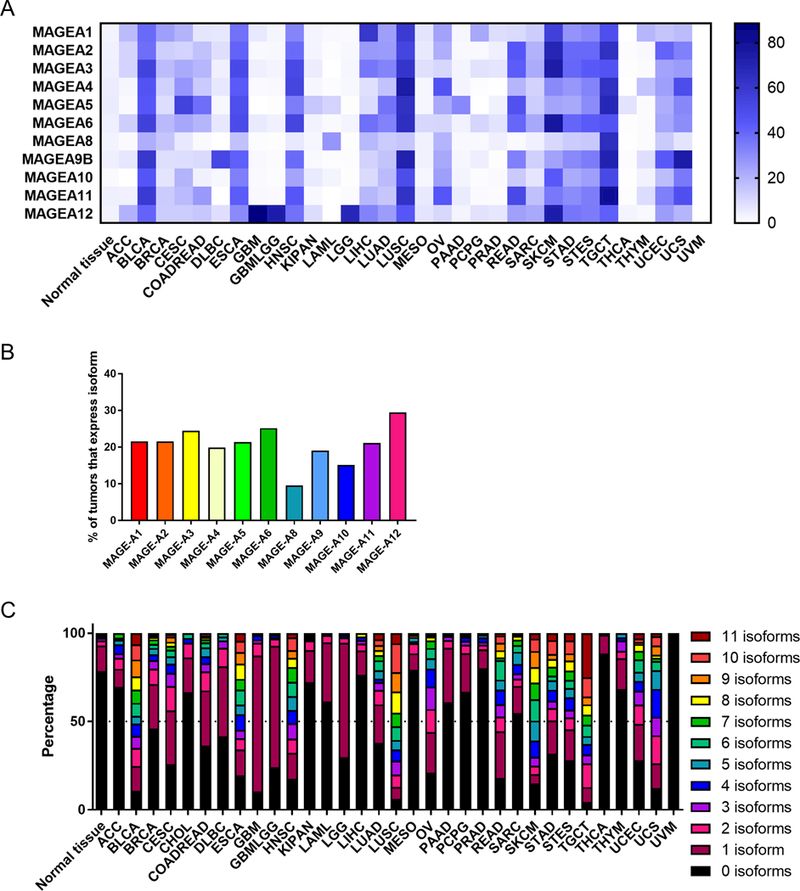
(A) Percentage of tumors expressing indicated MAGE-A isoform, based on RSEM RNAseq expression data. (B) Overall percentage of all tumor samples available from GDAC that express the indicated isoform. (C) Percentage of tumors expressing multiple MAGE-A isoforms simultaneously.
MAGE-A vaccine design and expression
The MAGE-A family does exist in lower vertebrates, and the general domain structure of this antigen family is conserved between mouse and human, with an unstructured N-terminal domain and a MAGE homology domain (Figure 2A). However, the sequence is poorly conserved. The mouse and human MAGE-A genes share between 25.3% (MAGE-A2) to 38.4% (MAGE-A10) identity at the protein level (calculated using sequence alignment with ClustalX2). Furthermore, the MAGE-A9, MAGE-A11 and MAGE-A12 isoforms have not been identified in mice. We therefore designed separate vaccines for testing in mice and for pre-clinical development for humans. We generated a synthetic consensus MAGE-A vaccine for proof-of-concept experiments in mice that shares 94.1% identity with MAGE-A1, 95.1% identity with MAGE-A2, 94.5% identity with MAGE-A3, 96.8% identity with MAGE-A5, 91% identity with MAGE-A6 and 94.8% identity with MAGE-A8 (Figure 2B,D). For pre-clinical development for humans, we generated two consensus MAGE-A vaccines. The human MAGE-A consensus #1 shares 91.4% identity to human MAGE-A2, 92.7% identity to MAGE-A3, 92.4% identity to MAGE-A6 and 92% identity to MAGE-A12. The human MAGE-A consensus #2 shares 84.6% identity to MAGE-A1, 84.6% identity to MAGE-A4, and 86.3% identity to MAGE-A5 (Figure 2C,E,F). These homologies were chosen as they would allow for theoretical T cell cross-reactivity for the majority of possible MAGE-A T cell epitopes. All of these vaccines were RNA and codon optimized for efficient translation and include the IgE leader sequence which promotes protein production and secretion.
Figure 2. Design of mouse and human consensus MAGE-A vaccines:
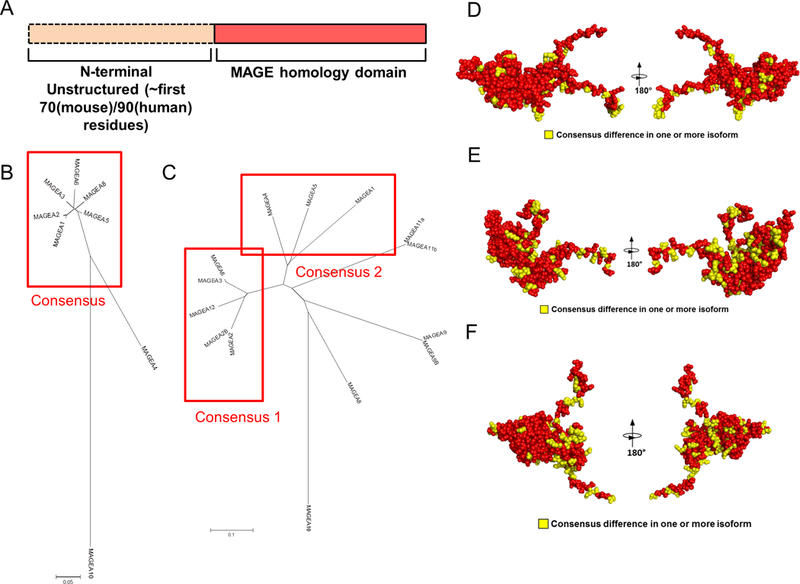
(A) General domain structure of the MAGE-A proteins. The N terminal is predicted to be unstructured using methods for detecting putative intrinsically disordered regions in proteins. (B,C) Phylogenetic trees for murine (B) and human (C) MAGE-A families. Sequences were aligned using ClustalX2. Indicated are the sequences used for each consensus vaccine. (D-F) Comparative models, shown in cpk format, for the MHD region of the murine consensus vaccine (D) or the human consensus 1 (E) and consensus 2 (F) vaccines. Red residues indicate identity in the consensus with all sequences and yellow indicates residues that differ in one or more of the MAGE-A native isoforms.
We next tested for plasmid vaccine expression in vitro. We transfected 293T cells with the mouse consensus MAGE-A vaccine or a GFP expressing plasmid as a control. Because there are no commercially available antibodies that recognize mouse MAGE-A isoforms, we probed for expression using qPCR. We detected robust expression of the consensus mouse MAGE-A vaccine in 293T cells in vitro (Supplementary Figure 1A). We next tested expression of the human MAGE-A consensus #1 and consensus #2 plasmids. We were able to detect robust expression of these plasmids by qPCR (Supplementary Figure 1B). We were also able to detect expression of these plasmids by western blot, using either a Pan-MAGE-A antibody or a FLAG antibody that recognizes FLAG-tagged constructs (Supplementary Figure 1C). The Pan-MAGE-A antibody was able to recognize the MAGE-A Consensus #2 vaccine construct, but not the Consensus #1 construct. As a control, we included 293T cells that were transfected with a human MAGE-A6 plasmid, which is slightly smaller than the MAGE-A consensus #1 or consensus #2 plasmids by western blot (Supplementary Figure 1C). This size shift is likely due to the addition of the IgE leader sequence.
Consensus mouse MAGE-A vaccine breaks tolerance to multiple MAGE-A isoforms in C57Bl/6 mice
To test the capacity of the mouse MAGE-A vaccine to break tolerance to multiple MAGE-A isoforms, we immunized C57Bl/6 mice with 25μg of the mouse consensus MAGE-A vaccine three times at two-week intervals and assessed cellular immune responses one week following the final vaccination (Figure 3A). We show, via IFN-γ ELISpot assay as well as intracellular cytokine staining of splenocytes that were stimulated with mouse native isoform-specific peptides, that our optimized designer vaccine is capable of inducing robust CD8+ IFN-γ responses to all 6 isoforms predicted to cross-react with this vaccine (Figure 3B-I). Furthermore, nearly all of these antigen-specific CD8+ splenocytes co-expressed the degranulation marker CD107a and the transcription factor T-bet, in addition to IFN-γ, indicating that these CD8+ T cells have high cytolytic potential (Figure 3J). High levels of TNF-α are also induced in CD8+ T cells upon stimulation of splenocytes with isoform-specific peptides (Figure 3K). The immune response detected in C57Bl/6 mice was largely driven by CD8+ T cells, as evidenced by the lower level of CD4+ T cell response for the individual MAGE-A isoforms (Supplementary Figure 2). These data demonstrate that this optimized, synthetic MAGE-A vaccine is capable of breaking tolerance to multiple MAGE-A isoforms simultaneously in mice.
Figure 3. Consensus mouse MAGE-A vaccine breaks tolerance to multiple MAGE-A family members in C57Bl/6 mice:
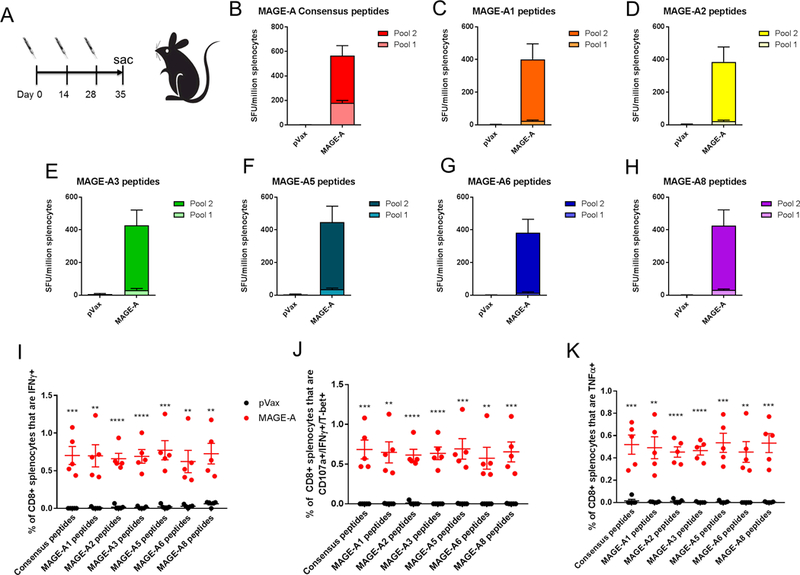
(A) C57Bl/6 mice were immunized 3 times at 2 week intervals and sacrificed 1 week following final vaccination. Mice were immunized with 25μg of DNA followed by electroporation. (B-H) Frequency of mouse MAGE-A isoform-specific IFNγ spot-forming units (SFU) per million splenocytes isolated from vaccinated mice. Splenocytes were stimulated with consensus peptides matching the vaccine sequence (consensus peptides, B), mouse MAGE-A1 specific peptides (C), mouse MAGE-A2 specific peptides (D), mouse MAGE-A3 specific peptides (E), mouse MAGE-A5 specific peptides (F), mouse MAGE-A6 specific peptides (G), mouse MAGE-A8 specific peptides (H). (I-K) Intracellular cytokine staining of splenocytes isolated from control (pVax) or immunized (MAGE-A) mice, stimulated with the indicated peptides. Shown is the frequency of IFNγ+ CD8 T cells (I), CD107a+/IFNγ+/T-bet+ CD8 T cells (J) or TNFα+ CD8 T cells (K). Significance was determined by a student’s t-test. *p<0.05, **p<0.01, ***p<0.001, ****p<0.0001. n=5 mice per group. A representative of two independent experiments is shown. Error bars indicate ± SEM.
Because most of the immune responses observed were in peptide Pool 2, we ran IFN-γ ELISpots using the individual peptides that make up Pool 2. By running the individual peptides, we determined that the response in C57Bl/6 mice was dominated by a single epitope: MKVLQFFASINKTHP (Supplementary Figure 3). This epitope contains both an 8-mer (VLQFFASI) and 9-mer (KVLQFFASI) that are predicted to have the highest MHC class I binding affinity (36.8nM and 20.5nM IC50, respectively) of all possible mouse MAGE-A epitopes, according to the IEDB NetMHCPan prediction program.
We next evaluated memory responses to the MAGE-A vaccine in C57Bl/6 mice. We immunized mice two times, and sacrificed the mice either one week post-final dose or 50 days post-final dose of vaccine (Supplementary Figure 4A). The immune responses decreased over time, but were maintained into memory 50 days after the final immunization (Supplementary Figure 4B). Importantly, we were able to detect T cells that expressed IFNγ, TNFα and co-expressed IFNγ/T-bet/CD107a in response to antigen stimulation in the mice sacrificed 50 days post-final dose (Supplementary Figure 4C-E).
Due to potential toxicity concerns related to MAGE-A3 targeted TCR gene therapy, we closely examined MAGE-A DNA vaccine immunized mice for adverse events. We immunized 5 mice three times at two week intervals, and monitored mice for a total of 9 months after the first immunization. We did not observe any apparent toxicity in these mice upon observation. Upon euthanization and dissection of these mice, we also did not observe any gross organ abnormalities. Upon closer pathologic examination of organs, we noted mild inflammation in the kidney, liver, pancreas and spleen (Supplementary Figure 5A,B). A similar degree of inflammation was noted in age-matched control immunized mice, indicating that this pathology was likely not due to the MAGE-A vaccine itself. Importantly, no pathologic abnormalities were noted in the brain or heart.
Consensus MAGE-A vaccine breaks tolerance to multiple MAGE-A isoforms in CD-1 outbred mice
Because the inbred C57Bl/6 mice responded primarily to one immunodominant epitope, we next tested this consensus mouse MAGE-A vaccine in CD-1 outbred mice to determine if it would generate cross-reactive immune responses in genetically diverse mice. We immunized 15 CD-1 outbred mice with 25μg of the mouse consensus MAGE-A vaccine three times at two-week intervals and assessed cellular immune responses one week following the final vaccination. We determined, by IFNγ ELISpot, that the consensus mouse MAGE-A vaccine is immunogenic in CD-1 mice against peptides matched to the consensus vaccine sequence, and is capable of breaking tolerance to multiple MAGE-A isoforms simultaneously in the majority of the mice (Figure 4A,B). Despite the genetic diversity of these mice, the majority of animals generated immune responses against all 6 individual MAGE-A isoforms (Figure 4B).
Figure 4. Consensus mouse MAGE-A vaccine breaks tolerance to multiple MAGE-A isoforms in CD-1 outbred mice:
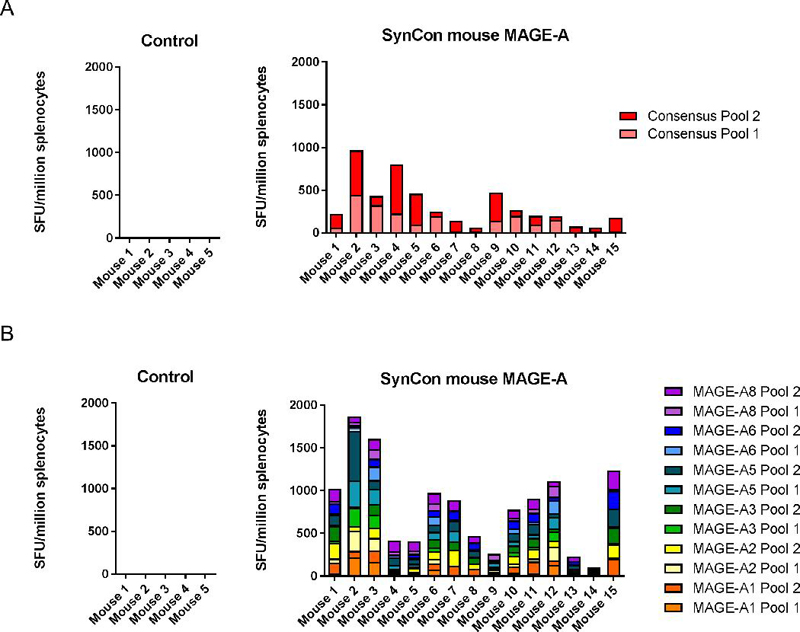
CD-1 outbred mice were immunized 3 times at 2 week intervals and sacrificed 1 week following final vaccination. Mice were immunized with 25μg of DNA followed by electroporation. (A,B) IFNγ ELISpot responses to consensus vaccine-matched peptides (A) or individual MAGE-A isoform matched peptides (B). 5 mice were used in the control group, and 15 mice were used in the consensus MAGE-A immunized group. Error bars indicate ± SEM.
Anti-tumor activity of MAGE-A vaccine in melanoma tumor models
To identify an appropriate model for a tumor challenge, we evaluated MAGE-A expression in a panel of mouse cell lines syngeneic to either C57Bl/6 or Balb/c strains of mice. We used Pan-MAGE-A qPCR primers that recognize MAGE-A isoforms A1, A2, A3, A5, A6 and A8 simultaneously. This analysis showed high expression of MAGE-A isoforms in the B16F10 and YUMM1.7 melanoma cell lines and the LLC and TC-1 lung cancer cell lines (Supplementary Figure 6A). The highest expression was observed in the YUMM1.7 cell line, which is derived from a transgenic melanoma model expressing BrafV600E, and has both Pten and Cdkn2 knockout (34). Therefore, we chose to test the MAGE-A in a similar autochthonous tumor model in which Braf V600E expression and PTEN loss are driven by Cre activation in melanocytes of the skin by tamoxifen induction (Tyr::CreER; BrafCA/+;Ptenlox/lox mice) (28). We verified that autochthonous tumors from these mice express MAGE-A isoforms at the RNA level (Supplementary Figure 6B). Upon induction with topical 4-OHT (tamoxifen), these mice develop melanoma with 100% penetrance. One week after 4-OHT induction, we began immunization with either a modified pVax control plasmid or the consensus mouse MAGE-A plasmid (Figure 5A). We observed that the mouse consensus MAGE-A vaccine was effective at significantly slowing tumor growth in this model, and prolonged mouse survival by a median of 50 days compared to the modified pVax control group (2-fold prolongation in survival, Figure 5B,C). We sacrificed half of the mice in the study at day 50 to evaluate appearance and immune infiltration in melanoma tumors, as well as examine the immune response in the spleen. We found that the MAGE-A vaccine was able to decrease melanoma invasion depth in the skin (Figure 5D,E), as well as drive CD8+ T cells to the tumor (Figure 5F,G). Furthermore, the CD4+ and CD8+ T cells in tumor tissues exhibited higher expression of CD44 and PD-1, markers of immune activation (Figure 5H,I). Tumor-bearing mice immunized with the MAGE-A vaccine also exhibited robust antigen-specific CD8+ T cell responses in the spleen, which persisted at least 22 days after the final immunization (Supplementary Figure 7A). Additional aspects of the tumor microenvironment, such as blood vessel size and density, myeloid derived suppressor cell infiltration and regulatory T cell infiltration, were not impacted by the MAGE-A vaccine (Supplementary Figure 7B-F).
Figure 5. Anti-tumor activity of MAGE-A vaccine in autochthonous melanoma model:
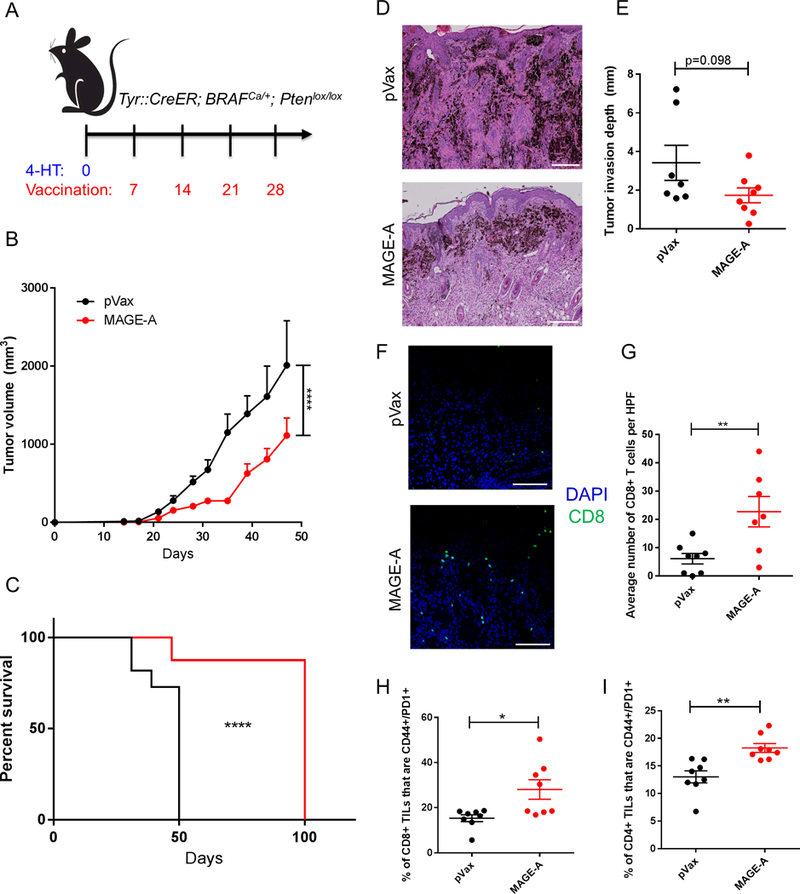
(A) Tumor study outline. Tyr::CreER; BRAFCa/+; Ptenlox/lox transgenic mice were administered topical tamoxifen on their backs on day 0 to initiate melanoma formation. Mice were immunized with either control (pVax) or MAGE-A vaccine once weekly starting on day 7 for a total of 4 immunizations. Mice were monitored for tumor growth and survival. (B) Tumor volume measurements over time for pVax control mice or MAGE-A immunized mice. (C) Mouse survival over time for pVax control mice or MAGE-A immunized mice. Mice were euthanized according to the standard body condition score. (D) Representative H&E images of tumors harvested from pVax control and MAGE-A immunized mice that were sacrificed on day 50. (E) Quantification of invasion depth in mm from H&E images of tumor tissue harvested from pVax or MAGE-A immunized mice at day 50. (F) Representative images of immunofluorescence staining of melanomas for CD8 (green) T cells and DAPI (blue). (G) Quantification of images in (F), in terms of CD8+ T cells per image. Image quantification was performed for 3 representative images per mouse. (H,I) Surface staining of tumor infiltrating CD8+ (H) and CD4+ (I) T cells for CD44 and PD1 expression. For (B), N= 11 mice for pVax control group and 16 mice for MAGE-A immunized group. 8 mice from the MAGE-A group were sacrificed for immune analysis on day 50, and the remaining mice were followed for survival (C). Significance for tumor volume measurements over time was determined by multiple t-tests for each time point. Significance for mouse survival was determined by the Gehan-Breslow-Wilcoxon test. *p<0.05, **p<0.01, ***p<0.001, ****p<0.0001. Error bars indicate ± SEM. Scale bar= 100μm for panel D, scale bar= 50μm for panel F.
We next tested the efficacy of our vaccine in the more aggressive, faster-growing subcutaneous YUMM1.7 tumor model (Supplementary Figure 8). We set up a tumor challenge study to evaluate the efficacy of the MAGE-A vaccine in this tumor model as well as to assess the dependence of any anti-tumor activity on CD8 T mediated immunity. We implanted mice with YUMM1.7 tumor cells, began immunization after palpable tumors formed on day 7, and treated mice with either an isotype control antibody or a CD8 depletion antibody (Supplementary Figure 8A). We found that the MAGE-A vaccine had a significant anti-tumor impact in this model, which was lost upon depletion of CD8 T cells in the mice (Supplementary Figure 8B). These results strongly support the potency of this MAGE-A vaccine for melanoma therapy.
Immunogenicity and cross-reactivity of human MAGE-A consensus DNA vaccines in mice
We next tested the ability of the human versions of our MAGE-A DNA vaccines to generate cross-reactive immune responses in C57Bl/6 mice (Figure 6A). We immunized C57Bl/6 mice with 25μg of the Human MAGE-A Consensus #1 vaccine or the Human MAGE-A Consensus #2 vaccine three times at two-week intervals, and assessed cellular immune responses one week following the final immunization (Figure 6A). We observed that both vaccines are immunogenic and generate robust IFNγ ELISpot responses to the vaccine-matched, consensus MAGE-A peptides (Figure 6B, D). We also show that both vaccines generate cross-reactive responses towards all predicted human MAGE-A isoforms by IFNγ ELISpot (Figure 6C,E). The MAGE-A Consensus #1 vaccine generates cross-reactive immune responses against MAGE-A2, MAGE-A3, MAGE-A6 and MAGE-A12. The MAGE-A Consensus #2 vaccine generates cross-reactive immune responses against MAGE-A1, MAGE-A4 and MAGE-A5.
Figure 6. Immunogenicity and cross-reactivity of human MAGE-A consensus vaccines in mice:
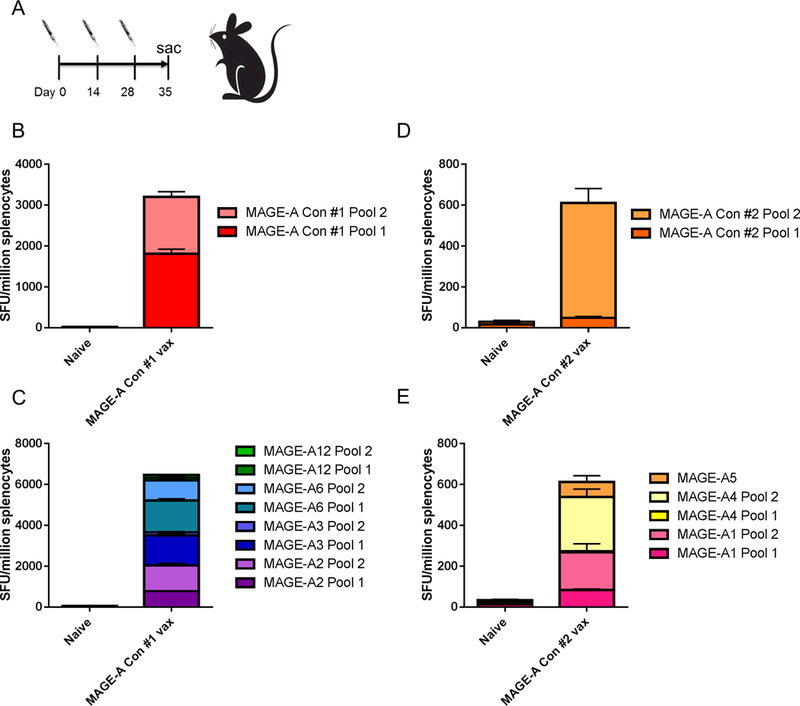
(A) C57Bl/6 mice were immunized 3 times at 2 week intervals and sacrificed 1 week following final vaccination. Mice were immunized with 25μg of DNA followed by electroporation. (B,C) Frequency of human MAGE-A isoform-specific IFNγ spot-forming units (SFU) per million splenocytes isolated from mice immunized with the human MAGE-A consensus #1 vaccine. Mouse splenocytes were stimulated with human MAGE-A consensus #1 peptides matching the vaccine sequence (B), or with isoform specific peptides matching human MAGE-A2, MAGE-A3, MAGE-A6 or MAGE-A12 (C). (D,E) Frequency of human MAGE-A isoform-specific IFNγ spot-forming units (SFU) per million splenocytes isolated from mice immunized with the human MAGE-A consensus #2 vaccine. Mouse splenocytes were stimulated with human MAGE-A consensus #2 peptides matching the vaccine sequence (D), or with isoform specific peptides matching human MAGE-A1, MAGE-A4 or MAGE-A5. n=5 mice per group. Error bars indicate ± SEM.
Discussion
Previous clinical efforts to target the MAGE-A family member with immunization have focused on MAGE-A3 specifically, based on limited gene expression data showing high expression for this particular isoform in various solid tumors (11). Here, we report data from TCGA showing that each member of the MAGE-A family, not just MAGE-A3, is highly expressed in human tumors (approximately 10–30% of all human tumors for each isoform). In fact, based on TCGA data, 84% of melanoma patients express 1 or more isoforms that are targeted by the two Human MAGE-A consensus vaccines that we developed, indicating important clinical applicability for melanoma patients. Furthermore, multiple MAGE-A family members are expressed within the same tumor, particularly so in melanoma patients. These data provide further support for the development of a cross-reactive vaccine that can target multiple MAGE-A family members simultaneously.
The entire MAGE-A family is clustered on the X-chromosome; however, each family member is under independent transcriptional control (35). The reason for this independent regulation is not clear, nor is our understanding of the individual regulation; however, this family of antigens is thought to be silenced by promoter methylation in normal human tissues (4,36,37). This methylation is removed in tumor cells due to epigenetic re-programming. While certain MAGE-A isoforms are suggested to have roles in cancer-promoting signaling pathways, it is not clear whether these isoforms are necessary for tumor progression (38–41). This suggests that tumors could escape immune pressure from a MAGE-targeted vaccine through down-regulation of a particular MAGE isoform. However, this immune evasion becomes less probable when multiple MAGE-A family members are targeted simultaneously. Thus, a cross-reactive MAGE-A vaccine has a significant advantage over vaccines that target individual MAGE-A isoforms in preventing tumor immune escape.
The MAGE-A family of proteins may be unique in its ability to generate spontaneous T cell responses in patients, indicating a potential lack of tolerance or more limited tolerance to this family of antigens (1,5–10). While naturally occurring responses to MAGE-A family members do exist, they are still relatively rare, making the role of tolerance to this antigen unclear (42,43). In a small cohort of patients (5 patients), it was shown that there is expression of MAGE-A isoforms in medullary thymic epithelial cells, but that expression of each isoform was variable (44). MAGE-A1 isoform expression was only detected in 1/5 patients, while MAGE-A3 and MAGE-A4 expression was detected in 4/5 patients (44). These data indicate that targeting multiple MAGE-A isoforms may be advantageous for eliciting an immune response against select isoforms that may not be subject to central tolerance. More study needs to be performed in this regard in humans to better understand factors that affect tolerance to this family of antigens. One advantage of this design is that, by including diversity into the design of these antigens, these hot spots of dissimilarity are quite similar to neoepitopes. They would be expected to drive cross-reactive class II responses to these hotspots, generating improved ability to break tolerance. Indeed, using the mouse MAGE-A immunogen we demonstrate that the consensus vaccine design strategy is effective at breaking tolerance to many mouse MAGE-A isoforms.
There are some toxicity concerns regarding MAGE-A3 targeted TCR gene therapy. Two cellular CD8-based MAGE-A3 TCR therapies have been tested in the clinic. Unfortunately, in both clinical trials patients experienced unexpected toxicity which precluded further clinical development of these therapies. An affinity-enhanced HLA-A*01 specific MAGE-A3 TCR therapy showed unexpected cardiovascular toxicity in the first 2 patients treated due to cross-reactivity of the TCR with peptide from the muscle-specific titin protein (15,16). A separate study used a high-avidity HLA-A*0201 specific MAGE-A3 TCR, which showed unexpected neurological toxicity in 3/9 patients, resulting in 2 unexpected deaths (45,17). This was likely due to cross-reactivity of the TCR with low levels of MAGE-A9/12 expression in neuronal cells of these patients. The toxicity correlated with the number of engineered T cells that were adoptively transferred, suggesting that lower levels of T cells or a lower affinity TCR may avoid this type of toxicity (45,17). Patients in this study received between 28–79 billion MAGE-specific T cells, in addition to one or more doses of IL-2 (17). Despite the fact that there was unprecedented toxicity, 5/9 patients did show clinical regression of their lesions after treatment, suggesting that CD8+ T cell therapy can be effective in generating an anti-tumor response against this antigen that can have clinical impact (45,17).
Despite this toxicity shown with the MAGE-A3 TCR therapy, MAGE-A4 TCR therapy was successfully performed in patients with esophageal cancer without significant toxicity (10). Furthermore, MAGE-A3 targeted vaccine immunotherapy was safe in patients, despite induction of MAGE-A3 specific CD4+ T cells and antibodies (12,13). One advantage of the DNA vaccine platform is that we were able to examine mice immunized with the cross-reactive mouse MAGE-A immunogen long-term, which is not possible with TCR based gene therapy. We did not observe any apparent off-tumor toxicity in these mice. Further studies in larger organisms, such as non-human primates, can further address this important issue. The DNA vaccine targeting MAGE-A antigens described here elicits anti-tumor immunity while generating fewer MAGE-specific CD8+ T cells compared to TCR based gene therapy, decreasing the likelihood of off-tumor toxicity. In addition, because DNA vaccines induce natural antigen-specific immunity (not ex vivo affinity-enhanced), there is likely in vivo regulation of the immune response to prevent this type of autoimmune attack. Because MAGE-A antigens are also induced in inflammatory conditions such as wound healing, as well as in the placenta during pregnancy (46,47), careful consideration will be required when selecting patient populations to exclude from receiving this therapy (for instance, patients who intend to become pregnant or patients with the potential to develop chronic wounds).
Because of the evolving cancer immunotherapy landscape, it will be important to evaluate any new cancer vaccine strategies in the context of immune checkpoint blockade. It has been recently reported that MAGE-A expression correlates with resistance to CTLA-4 blockade in melanoma patients (48), indicating that this MAGE-A vaccine may be an effective therapy for patients who do not respond to ICB, or may be able to sensitize patients who are resistant to ICB. We reported that a DNA vaccine targeting the tumor associated antigen TERT synergized with ICB in a mouse tumor model that is resistant to ICB alone (49). In addition, this MAGE-A vaccine may synergize with epigenetic modifiers, which are known to up-regulate expression of cancer germline antigens such as the MAGE family (50). These combination strategies will be important to consider for future clinical applications.
Supplementary Material
Translational Relevance:
Clinical efforts to target the MAGE-A family of cancer/testis antigens, which are over-expressed in tumors and have low expression in normal tissues, thus far have focused on the MAGE-A3 family member. In this study we show, using data from The Cancer Genome Atlas, that expression of all MAGE-A family members is high in a variety of different tumor types. Importantly, multiple MAGE-A isoforms are often expressed within the same tumor. We generated a cross-reactive consensus MAGE-A immunogen that was capable to targeting most MAGE-A family members, and demonstrate robust immunogenicity and anti-tumor activity of this immunogen in a transgenic melanoma model. This unique vaccine design may have important clinical benefit for patients expressing multiple MAGE-A family members in preventing tumor progression.
Acknowledgments:
This work was supported by an NIH/NCI NRSA Individual Fellowship (F32 CA213795 to E.K. Duperret), a Penn/Wistar Institute NIH SPORE (P50CA174523 to D.B. Weiner), the Wistar National Cancer Institute Cancer Center (P30 CA010815), the W.W. Smith Family Trust (to D.B. Weiner), funding from the Basser Foundation (to D.B. Weiner) and a grant from Inovio Pharmaceuticals (to D.B. Weiner). We would like to thank Jeffrey Faust at the Wistar Flow Cytometry Facility for technical assistance with flow cytometry, and James Hayden at the Wistar Imaging Facility for assistance with microscopy. We would also like to thank Dr. David Garlick from Histo-Scientific Research Laboratories for pathologic evaluation of mouse organs.
Footnotes
Conflicts of Interest:
J. Yan (associate director of antigen design) and C. Reed (fellow in protein engineering) are employees of Inovio Pharmaceuticals and as such receive salary and benefits, including ownership of stock and stock options. D.B. Weiner receives a commercial research grant from Inovio Pharmaceuticals, has received speakers bureau honoraria from Inovio Pharmaceuticals, GeneOne, Astrazeneca, has ownership interest (including patents) in Inovio Pharmaceuticals and is a consultant/advisory board member for Inovio Pharmaceuticals. The other authors declare no competing financial interests.
References:
- 1.van der Bruggen P, Traversari C, Chomez P, Lurquin C, De Plaen E, Van den Eynde B, et al. A gene encoding an antigen recognized by cytolytic T lymphocytes on a human melanoma. Science. American Association for the Advancement of Science; 1991;254:1643–7. [DOI] [PubMed] [Google Scholar]
- 2.Thompson JF, Santinami M, Jouary T, Levchenko E, Smithers BM, Mortier L, et al. MAGE-A3 expression in patients screened for the DERMA trial: A phase III trial testing MAGE-A3 immunotherapeutic in the adjuvant setting for stage IIIB-C-Tx melanoma. Am Soc Clin Oncol 2012. [Google Scholar]
- 3.Roeder C, Schuler-Thurner B, Berchtold S, Vieth G, Driesch P von den, Schuler G, et al. MAGE-A3 is a frequent tumor antigen of metastasized melanoma. Arch Dermatol Res 2005;296:314–9. [DOI] [PubMed] [Google Scholar]
- 4.De Smet C, Lurquin C, Lethé B, Martelange V, Boon T. DNA Methylation Is the Primary Silencing Mechanism for a Set of Germ Line- and Tumor-Specific Genes with a CpG-Rich Promoter. Mol Cell Biol American Society for Microbiology; 1999;19:7327–35. [DOI] [PMC free article] [PubMed] [Google Scholar]
- 5.Gaugler B, Van den Eynde B, van der Bruggen P, Romero P, Gaforio JJ, De Plaen E, et al. Human gene MAGE-3 codes for an antigen recognized on a melanoma by autologous cytolytic T lymphocytes. J Exp Med 1994;179:921–30. [DOI] [PMC free article] [PubMed] [Google Scholar]
- 6.Chaux P, Vantomme V, Stroobant V, Thielemans K, Corthals J, Luiten R, et al. Identification of MAGE-3 Epitopes Presented by HLA-DR Molecules to CD4 + T Lymphocytes. J Exp Med Rockefeller University Press; 1999;189:767–78. [DOI] [PMC free article] [PubMed] [Google Scholar]
- 7.Graff-Dubois S, Faure O, Gross D-A, Alves P, Scardino A, Chouaib S, et al. Generation of CTL Recognizing an HLA-A*0201-Restricted Epitope Shared by MAGE-A1, -A2, -A3, -A4, -A6, -A10, and -A12 Tumor Antigens: Implication in a Broad-Spectrum Tumor Immunotherapy. J Immunol American Association of Immunologists; 2002;169:575–80. [DOI] [PubMed] [Google Scholar]
- 8.Huang L-Q, Brasseur F, Serrano A, De Plaen E, van der Bruggen P, Boon T, et al. Cytolytic T Lymphocytes Recognize an Antigen Encoded by MAGE-A10 on a Human Melanoma. J Immunol 1999;162. [PubMed] [Google Scholar]
- 9.Zhu S, Van den Eynde BJ, Coulie PG, Li YF, El-Gamil M, Rosenberg SA, et al. Characterization of T-cell receptors directed against HLA-A*01-restricted and C*07-restricted epitopes of MAGE-A3 and MAGE-A12. J Immunother. NIH Public Access; 2012;35:680–8. [DOI] [PMC free article] [PubMed] [Google Scholar]
- 10.Kageyama S, Ikeda H, Miyahara Y, Imai N, Ishihara M, Saito K, et al. Adoptive Transfer of MAGE-A4 T-cell Receptor Gene-Transduced Lymphocytes in Patients with Recurrent Esophageal Cancer. Clin Cancer Res 2015;21. [DOI] [PubMed] [Google Scholar]
- 11.Vantomme V, Dantinne C, Amrani N, Permanne P, Gheysen D, Bruck C, et al. Immunologic analysis of a phase I/II study of vaccination with MAGE-3 protein combined with the AS02B adjuvant in patients with MAGE-3-positive tumors. J Immunother 27:124–35. [DOI] [PubMed] [Google Scholar]
- 12.Vansteenkiste J, Zielinski M, Linder A. Adjuvant MAGE-A3 immunotherapy in resected non–small-cell lung cancer: Phase II randomized study results. J Clin 2013; [DOI] [PubMed] [Google Scholar]
- 13.Kruit WHJ, Suciu S, Dreno B, Mortier L, Robert C, Chiarion-Sileni V, et al. Selection of immunostimulant AS15 for active immunization with MAGE-A3 protein: results of a randomized phase II study of the European Organisation for Research and Treatment of Cancer Melanoma Group in Metastatic Melanoma. J Clin Oncol 2013;31:2413–20. [DOI] [PubMed] [Google Scholar]
- 14.Atanackovic D, Altorki NK, Cao Y, Ritter E, Ferrara CA, Ritter G, et al. Booster vaccination of cancer patients with MAGE-A3 protein reveals long-term immunological memory or tolerance depending on priming. Proc Natl Acad Sci National Acad Sciences; 2008;105:1650–5. [DOI] [PMC free article] [PubMed] [Google Scholar]
- 15.Cameron BJ, Gerry AB, Dukes J, Harper J V, Kannan V, Bianchi FC, et al. Identification of a Titin-derived HLA-A1-presented peptide as a cross-reactive target for engineered MAGE A3-directed T cells. Sci Transl Med 2013;5:197ra103. [DOI] [PMC free article] [PubMed] [Google Scholar]
- 16.Linette GP, Stadtmauer EA, Maus M V, Rapoport AP, Levine BL, Emery L, et al. Cardiovascular toxicity and titin cross-reactivity of affinity-enhanced T cells in myeloma and melanoma. Blood 2013;122:863–71. [DOI] [PMC free article] [PubMed] [Google Scholar]
- 17.Morgan RA, Chinnasamy N, Abate-Daga D, Gros A, Robbins PF, Zheng Z, et al. Cancer regression and neurological toxicity following anti-MAGE-A3 TCR gene therapy. J Immunother. 2013;36:133–51. [DOI] [PMC free article] [PubMed] [Google Scholar]
- 18.Wang L, Rollins L, Gu Q, Chen S-Y, Huang XF. A Mage3/Heat Shock Protein70 DNA vaccine induces both innate and adaptive immune responses for the antitumor activity. Vaccine 2009;28:561–70. [DOI] [PMC free article] [PubMed] [Google Scholar]
- 19.You Z, Hester J, Rollins L, Spagnoli GC, van der Bruggen P, Chen S-Y. A Retrogen Strategy for Presentation of an Intracellular Tumor Antigen as an Exogenous Antigen by Dendritic Cells Induces Potent Antitumor T Helper and CTL Responses. Cancer Res 2001;61. [PubMed] [Google Scholar]
- 20.Marchand M, van Baren N, Weynants P, Brichard V, Dréno B, Tessier MH, et al. Tumor regressions observed in patients with metastatic melanoma treated with an antigenic peptide encoded by gene MAGE-3 and presented by HLA-A1. Int J cancer 1999;80:219–30. [DOI] [PubMed] [Google Scholar]
- 21.Trimble CL, Morrow MP, Kraynyak KA, Shen X, Dallas M, Yan J, et al. Safety, efficacy, and immunogenicity of VGX-3100, a therapeutic synthetic DNA vaccine targeting human papillomavirus 16 and 18 E6 and E7 proteins for cervical intraepithelial neoplasia 2/3: a randomised, double-blind, placebo-controlled phase 2b trial. Lancet (London, England). 2015; [DOI] [PMC free article] [PubMed] [Google Scholar]
- 22.Tebas P, Roberts CC, Muthumani K, Reuschel EL, Kudchodkar SB, Zaidi FI, et al. Safety and Immunogenicity of an Anti-Zika Virus DNA Vaccine - Preliminary Report. N Engl J Med 2017;NEJMoa1708120. [DOI] [PMC free article] [PubMed] [Google Scholar]
- 23.Yan J, Morrow MP, Chu JS, Racine T, Reed CC, Khan AS, et al. Broad cross-protective anti-hemagglutination responses elicited by influenza microconsensus DNA vaccine. Vaccine 2017; [DOI] [PubMed] [Google Scholar]
- 24.Walters JN, Ferraro B, Duperret EK, Kraynyak KA, Chu J, Saint-Fleur A, et al. A Novel DNA Vaccine Platform Enhances Neo-antigen-like T Cell Responses against WT1 to Break Tolerance and Induce Anti-tumor Immunity. Mol Ther 2017; [DOI] [PMC free article] [PubMed] [Google Scholar]
- 25.Duperret EK, Trautz A, Ammons D, Perales-Puchalt A, Wise MC, Yan J, et al. Alteration of the tumor stroma using a consensus DNA vaccine targeting Fibroblast Activation Protein (FAP) synergizes with anti-tumor vaccine therapy in mice. Clin Cancer Res 2017;clincanres.2033.2017. [DOI] [PMC free article] [PubMed] [Google Scholar]
- 26.Webb B, Sali A. Comparative Protein Structure Modeling Using MODELLER. Curr Protoc protein Sci. Hoboken, NJ, USA: John Wiley & Sons, Inc.; 2016;86:2.9.1–2.9.37. [DOI] [PubMed] [Google Scholar]
- 27.Dunker AK, Lawson JD, Brown CJ, Williams RM, Romero P, Oh JS, et al. Intrinsically disordered protein. J Mol Graph Model 2001;19:26–59. [DOI] [PubMed] [Google Scholar]
- 28.Dankort D, Curley DP, Cartlidge R a, Nelson B, Karnezis AN, Damsky WE, et al. Braf(V600E) cooperates with Pten loss to induce metastatic melanoma. Nat Genet 2009;41:544–52. [DOI] [PMC free article] [PubMed] [Google Scholar]
- 29.Liu S, Yu H, Kumar SM, Martin JS, Bing Z, Sheng W, et al. Norcantharidin induces melanoma cell apoptosis through activation of TR3 dependent pathway. Cancer Biol Ther 2011;12:1005–14. [DOI] [PMC free article] [PubMed] [Google Scholar]
- 30.Sreenivasan S, Madhugiri V, Sasidharan G, Kumar RR. Measuring glioma volumes: A comparison of linear measurement based formulae with the manual image segmentation technique. J Cancer Res Ther 2016;12:161. [DOI] [PubMed] [Google Scholar]
- 31.Tajima K, Obata Y, Tamaki H, Yoshida M, Chen Y. Expression of cancer/testis (CT) antigens in lung cancer. Lung cancer 2003; [DOI] [PubMed] [Google Scholar]
- 32.Jungbluth AA, Ely S, DiLiberto M, Niesvizky R, Williamson B, Frosina D, et al. The cancer-testis antigens CT7 (MAGE-C1) and MAGE-A3/6 are commonly expressed in multiple myeloma and correlate with plasma-cell proliferation. Blood. American Society of Hematology; 2005;106:167–74. [DOI] [PubMed] [Google Scholar]
- 33.Jungbluth AA, Busam KJ, Kolb D, Iversen K, Coplan K, Chen Y-T, et al. Expression of MAGE-antigens in normal tissues and cancer. Int J Cancer. Wiley-Blackwell; 2000;85:460–5. [PubMed] [Google Scholar]
- 34.Meeth K, Wang JX, Micevic G, Damsky W, Bosenberg MW. The YUMM lines: a series of congenic mouse melanoma cell lines with defined genetic alterations. Pigment Cell Melanoma Res 2016;29:590–7. [DOI] [PMC free article] [PubMed] [Google Scholar]
- 35.Barker PA, Salehi A. The MAGE proteins: Emerging roles in cell cycle progression, apoptosis, and neurogenetic disease. J Neurosci Res Wiley Subscription Services, Inc., A Wiley Company; 2002;67:705–12. [DOI] [PubMed] [Google Scholar]
- 36.Wischnewski F, Pantel K, Schwarzenbach H. Promoter demethylation and histone acetylation mediate gene expression of MAGE-A1, -A2, -A3, and -A12 in human cancer cells. Mol Cancer Res 2006;4:339–49. [DOI] [PubMed] [Google Scholar]
- 37.Weber J, Salgaller M, Samid D, Johnson B, Herlyn M, Lassam N, et al. Expression of the MAGE-1 tumor antigen is up-regulated by the demethylating agent 5-aza-2’-deoxycytidine. Cancer Res 1994;54:1766–71. [PubMed] [Google Scholar]
- 38.Pineda CT, Ramanathan S, Fon Tacer K, Weon JL, Potts MB, Ou Y-H, et al. Degradation of AMPK by a Cancer-Specific Ubiquitin Ligase. Cell. 2015;160:715–28. [DOI] [PMC free article] [PubMed] [Google Scholar]
- 39.Doyle JM, Gao J, Wang J, Yang M, Potts PR. MAGE-RING protein complexes comprise a family of E3 ubiquitin ligases. Mol Cell. NIH Public Access; 2010;39:963–74. [DOI] [PMC free article] [PubMed] [Google Scholar]
- 40.Yang B, O’Herrin SM, Wu J, Reagan-Shaw S, Ma Y, Bhat KMR, et al. MAGE-A, mMage-b, and MAGE-C Proteins Form Complexes with KAP1 and Suppress p53-Dependent Apoptosis in MAGE-Positive Cell Lines. Cancer Res 2007;67. [DOI] [PubMed] [Google Scholar]
- 41.Liu W, Cheng S, Asa SL, Ezzat S. The melanoma-associated antigen A3 mediates fibronectin-controlled cancer progression and metastasis. Cancer Res American Association for Cancer Research; 2008;68:8104–12. [DOI] [PubMed] [Google Scholar]
- 42.Stockert E, Jäger E, Chen YT, Scanlan MJ, Gout I, Karbach J, et al. A survey of the humoral immune response of cancer patients to a panel of human tumor antigens. J Exp Med 1998;187:1349–54. [DOI] [PMC free article] [PubMed] [Google Scholar]
- 43.Dhodapkar M V, Young JW, Chapman PB, Cox WI, Fonteneau JF, Amigorena S, et al. Paucity of functional T-cell memory to melanoma antigens in healthy donors and melanoma patients. Clin Cancer Res 2000;6:4831–8. [PubMed] [Google Scholar]
- 44.Gotter J, Brors B, Hergenhahn M, Kyewski B. Medullary epithelial cells of the human thymus express a highly diverse selection of tissue-specific genes colocalized in chromosomal clusters. J Exp Med The Rockefeller University Press; 2004;199:155–66. [DOI] [PMC free article] [PubMed] [Google Scholar]
- 45.Chinnasamy N, Wargo JA, Yu Z, Rao M, Frankel TL, Riley JP, et al. A TCR Targeting the HLA-A*0201-Restricted Epitope of MAGE-A3 Recognizes Multiple Epitopes of the MAGE-A Antigen Superfamily in Several Types of Cancer . J Immunol American Association of Immunologists; 2011;186:685–96. [DOI] [PMC free article] [PubMed] [Google Scholar]
- 46.Jungbluth AA, Silva WA Jr., Iversen K, Frosina D, Zaidi B, et al. Expression of cancer-testis(CT) antigens in placenta. Cancer Immun a J Acad Cancer Immunol Academy of Cancer Immunology; 2007;7. [PMC free article] [PubMed] [Google Scholar]
- 47.Becker JC, Gillitzer R, Bröcker E-B. A member of the melanoma antigen-encoding gene (MAGE) family is expressed in human skin during wound healing. Int J Cancer Wiley-Blackwell; 1994;58:346–8. [DOI] [PubMed] [Google Scholar]
- 48.Shukla SA, Bachireddy P, Schilling B, Galonska C, Zhan Q, Bango C, et al. Cancer-Germline Antigen Expression Discriminates Clinical Outcome to CTLA-4 Blockade. Cell. 2018;173:624–633.e8. [DOI] [PMC free article] [PubMed] [Google Scholar]
- 49.Duperret EK, Wise MC, Trautz A, Villarreal DO, Ferraro B, Walters J, et al. Synergy of Immune Checkpoint Blockade with a Novel Synthetic Consensus DNA Vaccine Targeting TERT. 2017; [DOI] [PMC free article] [PubMed] [Google Scholar]
- 50.Karpf AR. A potential role for epigenetic modulatory drugs in the enhancement of cancer/germ-line antigen vaccine efficacy. Epigenetics. NIH Public Access; 2006;1:116–20. [DOI] [PMC free article] [PubMed] [Google Scholar]
Associated Data
This section collects any data citations, data availability statements, or supplementary materials included in this article.