

Abstract
Background
The fasting-state serum bile acid profile in nonalcoholic-fatty-liver-disease (NAFLD) has been reported to differ when nonalcoholic-steatohepatitis is compared to nonalcoholic-fatty-liver. However, there are few data comparing changes in NAFLD versus non-NAFLD or whether the bile acid profile differs according to the degree of fibrosis.
Aim
To examine the serum bile acid profile across the entire spectrum of NAFLD.
Methods
We performed a cross-sectional analysis of 2 complementary cohorts: a Twin and Family cohort of 156 participants, and a biopsy-proven-NAFLD cohort of 156 participants with fasting bile acid profiling using liquid-chromatography/mass-spectrometry.
Results
In the Twin and Family cohort (mean age 46.3 years and body-mass-index (BMI) 26.6 kg/m2), 36 (23%) participants had NAFLD (magnetic-resonance-imaging-proton-density-fat-fraction≥5%). Higher chenodeoxycholyl-conjugates (6.5% versus 9.0%,p=0.019) and lower glycohycholate (1.2% versus 3.6%,p<0.001) was observed in NAFLD compared to non-NAFLD-controls. In the biopsy-proven-NAFLD cohort (mean age 49.8 years, BMI 32.0 kg/m2), no differences in total bile acid were seen between nonalcoholic-fatty-liver versus nonalcoholic-steatohepatitis. The total unconjugated-bile acid significantly decreased across nonalcoholic-steatohepatitis categories (p=0.044). The distribution of stage of fibrosis was F0: 42.3%, F1: 32.7%, F2: 10.3%, F3: 8.3%, and F4: 6.4%. The total serum bile acid increased with increase in fibrosis-stage (p< 0.001). The primary-conjugated-bile-acid proportion increased (p< 0.001) whereas unconjugated-bile-acid (p=0.006), unconjugated-cholyl (p<0.001) and chenodeoxycholyl-conjugates (p<0.002) significantly decreased with increase in liver fibrosis stage.
Conclusions
Fasting-state serum bile acid profile alterations are seen across the entire spectrum of NAFLD. The total serum bile acids did not differ significantly between NAFLD versus non-NAFLD and nonalcoholic-fatty-liver versus nonalcoholic-steatohepatitis but were significantly perturbed progressively as liver fibrosis increases.
Keywords: Bile acids, fibrosis, steatosis, non-alcoholic fatty liver
INTRODUCTION
Nonalcoholic fatty liver disease (NAFLD) is now the most common cause of chronic liver disease worldwide 1–3. NAFLD affects approximately one-third of American adult population and it is strongly associated with obesity and insulin resistance4. NAFLD encompasses a spectrum of liver disease ranging from nonalcoholic fatty liver (NAFL), which is thought to have a minimal risk of progression to cirrhosis, and nonalcoholic steatohepatitis (NASH), the more progressive form of NAFLD, which is considered to have a significantly increased risk of progression to cirrhosis and hepatocellular carcinoma 5. However, the pathogenesis of NASH and its progression towards advanced fibrosis and cirrhosis remains poorly understood.
In recent years, impaired bile acid metabolism has been shown to potentially contribute to the pathophysiology of metabolic diseases including NAFLD 6. Bile acids are synthetized from cholesterol in the liver and secreted into the bile. Chenodeoxycholic acid (CDCA) and cholic acid (CA) are the major primary bile acids in humans. Before secretion into the bile, primary bile acids are conjugated in the hepatocytes (mainly to glycine and less to taurine in humans). Upon release into the small intestine, bile acids facilitate dietary lipids solubilization and absorption. The intestinal microbiota also converts primary bile acids into secondary bile acid, deoxycholic acid (DCA), ursodeoxycholic acid (UDCA) and hyodeoxycholic acid (HDCA). Bile acids are further reabsorbed from the ileum and undergo several cycles of enterohepatic circulation. Due to their detergent properties, accumulation of bile acids induces hepatotoxicity by activation of inflammation, apoptosis and liver cell necrosis 7,8. Hence, the bile acids secretion is tightly regulated especially through a negative feedback mechanism by bile acid activating nuclear receptors such as the farnesoid X receptor (FXR) and thereby decreasing bile acid synthesis 9–11.
Over the last decade, bile acids have emerged as important modulators of metabolic homeostasis including insulin sensitivity, the principal risk factor of NAFLD 12,13. Indeed, bile acids act as specific signalling molecules regulating multiple metabolic pathways through interactions with bile acid receptors, Takeda G-protein-coupled receptor 5 and FXR 12. Finally, bile acid related pathways are currently actively being evaluated as a potential therapy for improving NASH 14 and NASH-related fibrosis 15.
In health, the concentration of bile acids in the systemic circulation is relatively low and corresponds to the small proportion of bile acids which escapes hepatic uptake and thereby target peripheral tissues 6. However, elevation of the total bile acids concentration has been reported in patients with type 2 diabetes 6,16 and in patients with insulin resistance 17. A few studies have investigated circulating bile acid profile in NAFLD 18–23. Increase of total serum bile acids has been reported in patients with NASH compared to healthy controls 18,22,23. Likewise, increases in individual bile acid concentration and alteration of the composition of bile acids have also been reported in NASH 18,20–22. Recently, Puri et al. have reported alteration in serum bile acid composition in patients with NAFL versus NASH. 22 However, these studies included a relative small number of participants with NASH (n=37) participants and therefore were not able to examine the bile acid alterations with well-defined stages of fibrosis over the entire spectrum from stage 0, 1, 2, 3 and 4 NAFLD.
Therefore the characterisation of fasting serum bile acids profile across the entire spectrum of NAFLD is needed to provide a comprehensive insight into the association between serum bile acid profiles and to determine whether these alterations are reflective of changes from NAFL to NASH or whether there are consistent alterations as fibrosis progresses. These important data should enable the generation of hypotheses and studies to better understand the potential role of bile acids in the pathogenesis and progression of NAFLD. Here we report fasting-state serum bile acid profiles in two complementary well-characterized cohorts encompassing the entire spectrum of NAFLD. We assessed the fasting serum bile acids profile in twins with and without NAFLD, and then examined the relationship between bile acid profile and individual stages of fibrosis in a large prospective cohort of participant with biopsy-proven NAFLD.
MATERIAL AND METHODS
Study participants of the Twin and Family cohort
This cross-sectional analysis included 156 participants (100 twins (50 twin pairs) including 37 pairs of monozygotic (MZ), 13 pairs of dizygotic (DZ) and 56 participants who were either siblings or parents-offspring) residing in Southern California from the Twin and Family Study (ClinicalTrials.gov:NCT01643512). All participants underwent a standardized clinical research visit that included detailed medical history, alcohol intake quantification using the Skinner and Audit questionnaire, anthropometric exam, physical exam, and biochemical testing at the University of California at San Diego (UCSD) NAFLD Research Center 24–32 between December 2011 and January 2014. NAFLD was assessed clinically and quantified by magnetic-resonance-imaging proton-density-fat-fraction (MRI-PDFF) at the MR3T Research Laboratory. Research visits and imaging procedures were performed the same day for each pair of twins, parent-offspring or siblings. This study was Health Insurance Portability and Accountability Act (HIPAA) compliant and was approved by the UCSD Institutional Review Board approval number: 111282. Informed written consent was obtained from each participant before enrolling in the study.
Inclusion and exclusion criteria of the Twin and Family cohort
Patients were included if they were twins, siblings or parent-offspring at least 18 years old, willing and able to complete all research procedures and observations. Please see Supplementary Material for details.
Participants were excluded from the study if they met any of the following criteria: significant alcohol intake (>10 g/day in females or >20 g/day in males) for at least 3 consecutive months over the previous 12 months or if the quantity of alcohol consumed could not be reliably ascertained; clinical or biochemical evidence of liver diseases other than NAFLD please see Supplementary Material for details.
Study participants of the biopsy-proven NAFLD cohort
The biopsy-proven NAFLD cohort included 156 participants prospectively recruited between October 2011 and May 2014 at the University of California at San Diego (UCSD) NAFLD Research Center 26–29,33,34. All patients with suspected NAFLD with a clinical indication for liver biopsy underwent a careful evaluation for other causes of hepatic steatosis and liver disease. This study was compliant with Health Insurance Portability and Accountability Act (HIPAA) and was approved by the UCSD Institutional Review Board. Informed written consent was obtained from each participant before enrolling in the study Please see Supplementary material for additional details.
Inclusion criteria and exclusion criteria of the biopsy-proven NAFLD cohort
Participants were included in the study if they were 18 years or older with suspected NAFLD and were willing and able to provide informed consent.
Participants were excluded if they met any of the following criteria: history of regular and excessive alcohol consumption within 2 years of recruitment (≥14 drinks/week for men or ≥7 drinks/week for women); use of hepatotoxic drugs or drugs known to cause hepatic steatosis; any evidence of secondary causes of hepatic steatosis; use of ursodeoxycholic acid. See Supplementary Material for further details.
Histologic Evaluation in UCSD NAFLD cohort
All liver biopsy interpretations were performed by an experienced liver pathologist who was blinded to the patient’s clinical and radiological data. Histologic scoring was done using the Nonalcoholic Steatohepatitis Clinical Research Network Histologic Scoring System 35.
Definition of NAFLD
NAFLD was defined as a MRI-PDFF ≥5% without any secondary causes of hepatic steatosis (see exclusion criteria listed above for details)
MRI assessment
MRI was performed at the UCSD MR3T Research Laboratory using the 3T research scanner (GE Signa EXCITE HDxt; GE Healthcare, Waukesha, WI) with all participants in the supine position. The details of the MRI protocol have been previously described in references 25,36 and are detailed in Supplementary material.
Outcomes
The primary outcome in the Twin and Family cohort was the presence of NAFLD as defined as MRI-PDFF ≥ 5%. The primary outcome in the biopsy-proven NAFLD cohort was the stage of liver fibrosis (0, 1, 2, 3 and 4) as defined by the NASH CRN Histologic Scoring System 35. The secondary outcome was the category of NASH (NAFL, borderline NASH and definite NASH as defined by the NASH CRN Histologic Scoring System 35.
Bile Acid profiling
Serum bile acids assessment was performed by Metabolon, Inc (Durham, NC, USA) using liquid chromatography tandem-mass spectrometry (LC/MS/MS) platforms37. All subjects were fasting when serum was obtained. Software was used to match ions to an in-house library of standards for bile acids s identification and relative quantitation by peak area integration 38. A number of internal standards were added to each experimental and process standard sample just prior to injection into the mass spectrometer. A measure of the platform variability was determined by calculating the median relative standard deviation (RSD) for these internal standards. For further details regarding serum bile acid data acquisition, please see Supplementary Material.
Statistical analysis
Data preparation
Serum bile acid raw data in origin scale was normalized in scaled intensity obtained by re-scaling raw data to have median equal to 1. Bile acids for which there were more than 50% missing values were excluded from the analysis. Please see Supplemental Material for additional details.
Data analysis
Patients’ demographic, anthropometric, clinical, and biochemical characteristics were summarized. Categorical variables were shown as counts and percentages, and associations were tested using a chi-squared test or Fisher’s exact test. Normally distributed continuous variables were shown as mean (± standard deviation), and differences between groups were analyzed using a two-independent samples t test or Wilcoxon-Mann-Whitney test.
Statistical comparison of serum bile acids and proportion of individual and categories of bile acids between NAFLD and non-NAFLD groups were assessed using Welch’s t-tests. Group means and medians were compared using analysis of variance (ANOVA) followed by post-test for linear trend. Nonparametric tests were performed for non-normally distributed data using Kruskal-Wallis test or Mann-Whitney test. Spearman correlations were performed between histological features of NAFLD and individual bile acid. Plasma bile acid level are reported in tabular presentation classified as suggested in reference 39. The odds ratios of bile acids proportion were determined using univariate and multi-adjusted logistic regression. In addition, odds ratio derived from generalized estimation equations (PROC GENMOD) were performed to account for intrapair correlation with twinship in the Twin and Family cohort. All statistical analyses were performed using SAS 9.4 (SAS Institute, Cary, NC), SPSS (IBM, Chicago, IL) or GraphPad Prism 7(La Jolla, CA). A two-tailed P value ≤0.05 was considered statistically significant.
RESULTS
Baseline characteristics of the study population
A total of 312 participants from 2 complementary cohorts encompassing the entire spectrum of NAFLD were studied. Among them, 156 participants from the Twin and Family cohort who underwent fasting serum bile acid assessment, clinical evaluation and advanced magnetic resonance imaging assessment were included in the study. The mean (± standard deviation) age was 46.3 years (±19.8) and body mass index (BMI) was 26.6 kg/m2 (±6.0), and the prevalence of NAFLD as defined by MRI-PDFF≥5% was 23% (36/156). The study also included 156 participants with biopsy-proven NAFLD who underwent fasting serum bile acid assessment, clinical evaluation and liver biopsy. The mean (±standard deviation) age was 49.8 years (±14.3) and body mass index was 32.0 kg/m2 (±6.0). Among them, 20 (13.0%) participants had NAFL, 18 (11.7%) borderline NASH and 116 (75.3%) definite NASH. The distribution of stage of fibrosis was F0: 42.3%, F1: 32.7%, F2: 10.3%, F3: 8.3%, and F4: 6.4%. Detailed demographic, biochemical, and imaging data of subjects of the Twin and Family cohort biopsy-proven NAFLD cohort are provided in Table 1 and Table 2.
Table 1.
Baseline Characteristics between Non-NAFLD and NAFLD Individuals in the Twin and Family Cohort
| Characteristics | NAFLD MRI-PDFF ≥ 5% (n=36*) |
Non-NAFLD MRI-PDFF < 5% (n=120#) |
P |
|---|---|---|---|
| Age years | 55.2 (15.7) | 43.6 (20.2) | 0.001 |
| Female, n (%) | 20 (55.6) | 94 (78.3) | 0.007 |
| Race | 0.477 | ||
| White, n (%) | 25 (69.4) | 90 (75.0) | |
| Hispanic, n (%) | 7 (19.4) | 19 (15.8) | |
| Type 2 Diabetes, n (%) | 10 (27.8) | 2 (1.7) | <0.001 |
| Obesity, n (%) | 21 (60.0) | 14 (40.0) | <0.001 |
| BMI (kg/m2) | 31.8 (5.9) | 25.0 (5.2) | <0.0001 |
| SBP (mm Hg) | 137.4 (22.6) | 119.5 (19.3) | <0.001 |
| DBP (mmHg) | 81.0 (12.4) | 75.2 (12.0) | 0.13 |
| Waist circumference (cm) | 102.4 (13.2) | 86.9 (11.2) | <0.0001 |
| Hip Circumference (cm) | 108.8 (13.5) | 98.7 (10.34) | <0.0001 |
| Glucose (mg/dL) | 102.5 (27.5) | 88.4 (9.6) | 0.005 |
| Insulin (U/L) | 25.5 (42.7) | 7.67 (4.2) | 0.019 |
| HbA1c | 6.1 (0.7) | 5.7 (0.4) | 0.001 |
| HOMA-IR | 6.6 (11.4) | 1.7 (1.0) | 0.016 |
| AST (U/L) | 28.4 (15.8) | 22.4 (6.6) | 0.035 |
| ALT (U/L | 31.5 (19.6) | 20.1 (11.9) | 0.002 |
| Alkaline phosphatase (U/L) | 72.4 (25.2) | 68.5 (22.1) | 0.372 |
| Total bilirubin (mg/dL) | 0.43 (0.20) | 0.46 (0.23) | 0.423 |
| Direct bilirubin (mg/dL) | 0.12 (0.04) | 0.12 (0.04) | 0.540 |
| Albumin (g/dL) | 4.5 (0.3) | 4.6 (0.3) | 0.170 |
| GGT (U/L) | 44.7 (53.0) | 19.3 (10.8) | 0.007 |
| Total cholesterol (mg/dL) | 189.2 (39.8) | 189.5 (40.6) | 0.970 |
| HDL-cholesterol (mg/dL) | 49.6 (11.5) | 67.2 (19.3) | <0.0001 |
| LDL-cholesterol (mg/dL) | 111.1 (35.1) | 105.9 (35.1) | 0.441 |
| Triglycerides (mg/dL) | 151.1 (70.3) | 82.2 (48.2) | <0.0001 |
| White blood cell count (x 103/uL) | 6.8 (1.5) | 5.8 (1.6) | 0.002 |
| Hemoglobin (g/dL) | 14.6 (3.8) | 13.6 (1.1) | 0.116 |
| Hematocrit (%) | 41.2 (4.2) | 40.3 (3.1) | 0.232 |
| Platelet count (x103/uL) | 249.8 (57.8) | 257.1 (49.1) | 0.454 |
| INR | 1.1 (0.3) | 1.1 (0.2) | 0.924 |
| Ferritin (ng/mL) | 121.1 (136.5) | 82.4 (67.8) | 0.113 |
| MRI-PDFF (%) | 12.7 (6.3) | 2.3 (0.9) | <0.0001 |
Mean values are provided with the standard deviation in parenthesis, unless otherwise noted as n (%). Differences between individuals with and without NAFLD were evaluated with t tests or the Wilcoxon-Mann-Whitney test for continuous variables and the chi squared or Fisher exact test for categorical variables. Bold indicates significant P-values <0.05.
22 Twins; 14 other relatives (parent, offspring, sibling)
78 Twins; 42 other relatives (parent, offspring, sibling).
Abbreviations: NAFLD: Nonalcoholic Fatty Liver Disease BMI: body mass index, SBP: systolic blood pressure, DBP: diastolic blood pressure, HbA1c: glycated hemoglobin, AST: Aspartate Aminotransferase, ALT: Alanine Aminotransferase, HOMA-IR, homeostatic model assessment-insulin resistance; AST, asparatate aminotransferase; ALT, alanine aminotransferase; GGT, gamma-glutamyl transpeptidase; INR, international normalized ratio, HDL : high density lipoprotein, LDL, low density lipoprotein, MRI-PDFF, magnetic resonance imaging-protein density fat fraction.
Table 2.
Baseline characteristics of biopsy-proven NAFLD Cohort
| Characteristics | All (n=156) |
|---|---|
| Demographics | |
| Age, years | 49.8 ± 14.3 |
| Male, n (%) | 65 (41.7) |
| White, n (%) | 71 (45.5) |
| Hispanic or Latino, n (%) | 49 (32.7) |
| BMI, kg/m2 | 32.0 ± 6.0 |
| Clinical | |
| Type 2 Diabetes, n (%) | 41 (26.3) |
| Biological data | |
| AST (U/L) | 42.2 (34.0) |
| ALT (U/L) | 59.0 (57.0) |
| Alkaline phosphatase (U/L) | 77.5 (28.3) |
| GGT (Ui/L) | 55.5 (51.0) |
| Total Bilirubin (mg/dL) | 1.7 (15.3) |
| Direct Bilirubin (mg/dL) | 0.14 (0.15) |
| Albumin (g/dL) | 4.46 (0.44) |
| Glucose (mg/dl) | 106.2 (33.1) |
| Hemoglobin A1c | 6.0 (0.9) |
| HOMA-IR | 8.5 (17.3) |
| Insulin (U/ml) | 34.2 (74.9) |
| Triglycerides (mg/dL) | 159.0 (83.5) |
| Total cholesterol (mg/dL) | 182.8 (44.3) |
| HDL-cholesterol (mg/dL) | 48.7 (15.3) |
| LDL-cholesterol (mg/dL) | 105.3 (34.6) |
| Platelet count (103/µL) | 244.5 (782.8) |
| Prothrombin time | |
| INR | 1.01 (0.08) |
| Ferritin (ng/mL) | 190.4 (171.9) |
| Histology | |
| Fibrosis n (%) | |
| 0 | 66 (42.3) |
| 1 | 51(32.7) |
| 2 | 16 (10.3) |
| 3 | 13 (8.3) |
| 4 | 10 (6.4) |
| Steatosis n (%) | |
| 0 | 3 (1.9) |
| 1 | 51(32.7) |
| 2 | 58 (37.2) |
| 3 | 44 (28.2) |
| Lobular inflammation n (%) | |
| 0 | 3 (1.9) |
| 1 | 76 (49.0) |
| 2 | 70 (45.2) |
| 3 | 6 (3.9) |
| Ballooning n (%) | |
| 0 | 38 (24.4) |
| 1 | 87 (55.8) |
| 2 | 30 (19.2) |
| 3 | 1 (0.6) |
| NASH, n (%) | |
| NAFL, no NASH | 20 (13.0) |
| Borderline NASH | 18 (11.7) |
| Definite NASH | 116 (75.3) |
| NAS Median (IQR) | 4 (2) |
Mean values are provided with the standard deviation in parenthesis, unless otherwise noted as n (%) or Median and Interquartile range (IQR). Abbreviations: BMI: body mass index, AST: Aspartate Aminotransferase, ALT: Alanine Aminotransferase, GGT: gamma-glutamyl transpeptidase, HOMA-IR: homeostatic model assessment-insulin resistance, INR: international normalized ratio, HDL: High Density Lipoprotein, LDL: Low Density Lipoprotein, MRI-PDFF: magnetic resonance imaging-protein density fat fraction, NASH: Nonalcoholic Steatohepatitis, NAFL: Nonalcoholic Fatty Liver.
GGT: Gamma-Glutamyl Transferase, HbA1c: glycated hemoglobin, HDL: High Density Lipoprotein, LDL: Low Density Lipoprotein, INR: International Normalized Ratio, HOMA: Homeostasis Model Assessment, NAS: NAFLD Activity Score.
Alteration in serum bile acids in relation to the presence of nonalcoholic fatty liver disease
The fasting serum bile acid profile in NAFLD (MRI-PDFF≥5%) versus non-NAFLD controls (MRI-PDFF <5%) participants was assessed in the Twin and Family cohort. There was no significant difference in total fasting serum bile acids in NAFLD participants compared to non-NAFLD controls p=0.56 (Figure 1A). The distribution of the proportion of bile acids categories in NAFLD and non-NAFLD is shown in Supplemental Figure 1. Fasting serum bile acid in NAFLD participants and non-NAFLD controls are provided in Supplemental Table 1. A significant increase of the median proportion of both cholate conjugates, 6.0% versus 9.8%, p=0.009 (Figure 1B), and chenodeoxycholate conjugates, 6.5% versus 9.0%, p=0.019 (Figure 1C), was observed in NAFLD participants compared to non-NAFLD controls. Conversely, the median proportion of an uncommon primary bile acid, glycohyocholate, was significantly lower in NAFLD participants compared to non-NAFLD controls: 1.2% versus 3.6%, p<0.001, (Figure 1D). We performed sensitivity analyses comparing NAFLD participant with non-NAFLD participant matched for BMI and the findings remained unchanged Supplemental Table 1. After adjustment for age, sex and Hispanic ethnicity, the presence of type 2 diabetes and obesity, the increased proportion of glycohyocholate remained significantly associated with decrease risk of NAFLD: OR of 0.76 (95%CI: 0.573–0.999), p=0.0496 in generalized estimation equations accounting for intrapair correlation with twinship.
Figure 1. Fasting serum bile acids profile is altered in NAFLD.

Fasting serum bile acid profile in the Twin and Family cohort in NAFLD (MRI-PDFF≥5%) and non-NAFLD (MRI-PDFF<5%) participants are represented as (A) Scatter dot plot of log scaled intensity of total bile acids in NAFLD versus non-NAFLD participant. (B) The mean and standard error of mean (SEM) of the proportion of cholate (CA), chenodeoxycholate (CDCA) conjugates and glycohyocholate (GHCA) is presented in NAFLD versus non-NAFLD participants.
Alteration in bile acid profile in relation to liver fibrosis
The fasting serum bile acid profile across liver fibrosis stages, NASH category and histological features was assessed in the biopsy-proven NAFLD cohort. The distribution of the proportion of bile acid categories across liver fibrosis and NASH category is shown in Supplemental Figure 1. Fasting serum bile acids across stages of fibrosis in the biopsy-proven NAFLD Cohort are provided in Supplemental Table 3. A stepwise increase of the mean total fasting serum bile acid was observed along with increase in fibrosis stage p for trend < 0.001 (Figure 2A). This result remained clinically and statistically significant even after exclusion of the participant with cirrhosis (stage 4), p for trend = 0.003. Likewise, the mean proportion of primary conjugated bile acid increased along with the increase of fibrosis stage p for trend < 0.001 (Supplemental Figure 2). The median proportion of total unconjugated bile acid significantly decreased gradually along with increase in fibrosis stages p=0.006 Figure 2C. Likewise, a significant decrease in the proportion of unconjugated form of cholate and chenodeoxycholate was observed when the fibrosis stage increases, p<0.001 and p<0.002 Figure 2C.
Figure 2. Fasting serum bile acids profile is significantly associated with histological features of NAFLD.

Fasting serum bile acid profile in the biopsy-proven NAFLD cohort is presented across liver fibrosis stages: (A) scatter dot plot of log scaled intensity of total bile acids; (B) across categories of NASH. (C) Heatmap of median proportions of individual bile acids as function of the total bile acids across liver fibrosis stages and NASH categories with smaller proportion indicated in blue and higher proportion indicated in purple. Green box in the side bar along the right side indicates proportion of bile acid that meet statistical significance across liver fibrosis stages (p-value < 0.05) or NASH categories using Kruskal-Wallis test. (D) Heatmap of the spearman correlations between individual bile acid and histological features * p value < 0.05, ** p value <0.01.
The fasting serum bile acid profile in NAFL versus NASH in the biopsy-proven NAFLD cohort
Fasting serum bile acid across NASH categories in the biopsy-proven NAFLD Cohort are detailed in Supplemental Table 4. There was no significant difference in mean total bile acids across NASH categories p=0.679 Figure 2B. However, the median proportion of total unconjugated bile acid significantly progressively decreased in participant with NAFL, borderline NASH and NASH p=0.044 Figure 2C. In addition, the proportion of cholate conjugates significantly increased across NASH categories, p=0.030 Figure 2C. In addition, the total fasting serum bile acid and the proportion of both conjugated deoxycholate and cholate were positively correlated with the degree of hepatocellular ballooning, whereas the proportion of total unconjugated bile acid was negatively correlated with the degree of lobular inflammation and hepatocellular ballooning Figure 2D, Supplemental Table 5.
Sensitivity analyses in the biopsy-proven NAFLD cohort
We conducted sensitivity analysis to further assess the association between the bile acid profile and liver fibrosis stage in multivariable adjusted models using logistic regression. Increasing total serum bile acid and the proportion of primary conjugated bile acid were associated with a significant increase risk of significant fibrosis (stage ≥2) in a multivariable adjusted model for age, sex, ethnicity, presence of obesity and type 2 diabetes : OR: 1.01 (1.00–1.03), p=0.015 and OR:1.02 (1.02–1.09), p=0.003, respectively Supplemental Table 6. Conversely, increasing proportion of total unconjugated bile acid was associated with a decreased risk of significant fibrosis (stage ≥2) in a multivariable adjusted model for age, sex, ethnicity, presence of obesity and type 2 diabetes : OR: 0.97 (0.95–1.00), p=0.030. Supplemental Table 6.
DISCUSSION
Main findings
We have leveraged from two well-characterized, prospectively recruited cohorts, encompassing the entire spectrum from twins with or without non-alcoholic fatty liver disease to patients with various stage of fibrosis in biopsy-confirmed nonalcoholic fatty liver disease. We report new data showing that significant alteration of serum bile acid occurs across the entire spectrum of nonalcoholic fatty liver disease as summarized in Figure 3. The main findings of this study include that total serum bile acid did not differ significantly between NAFL versus NASH but were significantly perturbed progressively as liver fibrosis increases.
Figure 3. Alteration of serum bile acid across the entire spectrum of NAFLD.
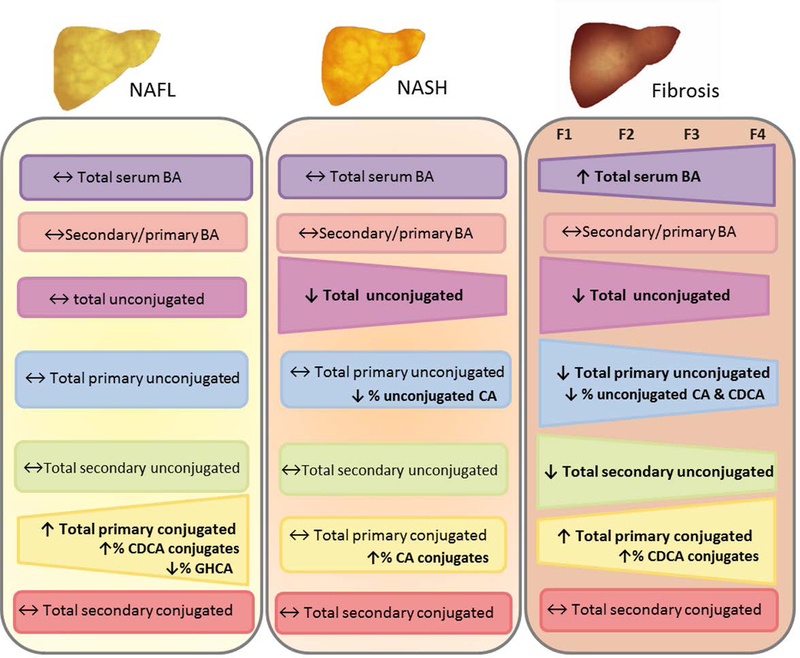
Abbreviations: CA: cholate, CDCA: chenodeoxycholate, GHCA : glycohyocholate
These data confirm the association between alterations in circulating bile acids metabolism and nonalcoholic fatty liver disease which are associated with the severity of the disease and now links it to fibrosis stage. Although these data do not elucidate the causal relationship between bile acid alteration and nonalcoholic fatty liver disease or stages of fibrosis, they do provide the foundation to generate hypotheses and studies to better understand the role of bile acids in the pathogenesis and progression of nonalcoholic fatty liver disease. Furthermore, bile acid profiling could be potential non-invasive biomarker of nonalcoholic fatty liver disease severity and especially significant fibrosis which is the most important predictor of mortality and liver-related events in long-term longitudinal studies 40.
In context of published literature
This study report significant increase in total serum bile acids associated with the severity of nonalcoholic fatty liver disease as previously described by other independent investigators 18,20,22. Moreover, the total fasting serum bile acid was not significantly different in NAFLD compared to non-NAFLD controls in the Twin and Family cohort. Similar results were observed by Bechman et al. in obese subjects with non-NAFLD, NAFL or NASH undergoing bariatric surgery 19. In agreement, a recent study by Puri et al. did not observe significant alteration in total serum bile acids in participant with NAFL compared to healthy controls. However, we report early alterations in bile acids composition in nonalcoholic fatty liver disease including an increase in chenodeoxycholate conjugates and decrease in an uncommon primary bile acids, glycohyocholate. We were able to assess these early alterations because the Twin and Family cohort was characterized by advanced magnetic resonance imaging for the presence or absence of NAFLD. Therefore, there was no overlap between cases versus controls, and this study had a significantly larger sample size (N=156).
Alteration in bile acid metabolism have been previously associated with metabolic disorder especially insulin resistance and presence of type 2 diabetes 6,16,17. These metabolic parameters are strongly associated with nonalcoholic fatty liver disease 6. Hence, studying alteration of bile acid metabolism in nonalcoholic fatty liver disease independently from these confounding metabolic parameters remains challenging. Legry et al. have recently shown that the serum bile acids profile was unchanged in obese patients with NASH compared to healthy controls when patients were matched for the body mass index and insulin resistance index. Interestingly, in our study, only the proportion of glycohyocholate remained significantly associated with the presence of nonalcoholic fatty liver disease after multivariable adjustment including age, sex, Hispanic ethnicity, presence of type 2 diabetes and obesity. These data suggest that, early specific alteration in circulating bile acids composition occurs in NAFLD and might trigger the progression of the disease even though alteration related to additional metabolic parameters, such as insulin resistance, also contribute to the pathogenesis of the disease. Further longitudinal studies are needed to determine if and how bile acids alteration play a causal role in the development and progression of nonalcoholic fatty liver disease 41.
In the biopsy-proven NAFLD cohort, no significant alterations in total bile acid in participant with NASH versus NAFL were observed. Likewise, the recent study by Puri et al. including only 62 participants with biopsy-proven NAFLD did not show significant differences in total circulating bile acids in NAFL versus NASH. However Puri et al. have reported a significant increase in total circulating bile acids in NASH versus healthy controls 22. Interestingly, a majority of patients with NASH patients had significant fibrosis (stage ≥2) in that study. In addition, most of the other previous studies comparing NASH versus healthy controls did not provide detailed histological data especially regarding liver fibrosis stage. Therefore, it can be speculated that most of the patients with NASH included in these studies may have had significant liver fibrosis and did not have the power to detect the bile acid alterations by fibrosis stage. Hence, it is plausible that previous alteration in circulating bile acids reported in patients NASH were mainly driven by the presence of significant liver fibrosis. In addition, Aranha et al. have reported an increase of deoxycholate , chenodeoxycholate and cholate in liver tissue of patients with NASH compared to controls with a significant correlation between hepatic chenodeoxycholate and fibrosis 42.
Contrary to previously published studies, we provide a comprehensive assessment of fasting-state serum bile acid profile across all stages of fibrosis in a larger cohort including 156 participants with biopsy proven NAFLD. Therefore, we were able to identify significant alteration in bile acids profile associated with higher liver fibrosis stages. While alteration of serum bile acids have been long established in presence of cirrhosis 43, significant dose-dependent alteration of fasting-state serum bile acids profile associated with increased individual stage of fibrosis (stage ≥2) has not been reported yet. Indeed, even after multivariable adjustment for age, sex, Hispanic ethnicity, presence of type 2 diabetes and obesity, the proportion of primary conjugated bile acids and total unconjugated bile acid remained significant predictor of dichotomized stage of fibrosis ≥ 2, ≥3 and ≥4.
Our study provides no insight into the factors responsible for the observed changes or the drivers of bile acid metabolism related to the presence and severity of nonalcoholic fatty liver disease. Possibilities include alterations in synthesis rate, hepatic or intestinal transport, and effect of the microbiome. Unconjugated bile acids arise from intestinal absorption, but defective conjugation remains a possibility.
The increased in the proportion of circulating primary conjugated bile acid when the fibrosis stage increases could result of an increased synthesis of primary bile acids. Indeed, increased expression of enzymes involved in bile acid synthesis have been reported in the liver of patients with NASH23,44 as well as an increase of circulating marker of bile acid synthesis (7-apha-hydroxy-4-cholesten-3-one) in patients with NASH45. The increase in serum primary conjugated bile acids associated with liver fibrosis could result from a decreased conversion to secondary bile acids in the intestine, potentially due to microbiome changes. Indeed, compositional changes in gut microbiota have been linked to NAFLD, NASH and NASH-related liver fibrosis 34,46–49. In addition, a higher primary to secondary ratio have been reported in the fecal bile acids of patients with NASH compared to healthy controls 45 whereas a decreased conversion of primary to secondary fecal bile acids has been reported in patients with cirrhosis due to a decrease abundance of key microbiome taxa50. Interestingly, we report a significant correlation between the proportion of deoxycholate and the degree of hepatocellular ballooning. This gut-microbiome derived metabolite is known to induce DNA damage through reactive oxygen species production 51 and is involve in the development of hepatocellular carcinoma in mice model 52. Hence, these data suggest that increase in deoxycholate may contribute to liver injury and inflammation leading to the development of hepatocellular carcinoma due to NASH.
Emerging data suggest that reduced FXR signalling is associated with the severity of NAFLD 22,23. Indeed, Puri et al. have shown that plasma fibroblast growth factor (FGF) 19 level tended to decrease with higher fibrosis stage and that the hepatic mRNA expression of FXR target tended to decrease 22. In line with these data, we report a significant decrease of the proportion of the primary unconjugated bile acids, especially chenodeoxycholate, the most potent activator of FXR, when fibrosis stage increases. Interestingly, the bile acids composition and metabolism assessment in the liver of subjects with NASH performed by Lake et al. suggest that the hepatic bile acid composition shift to more hydrophilic component in NASH which are less potent FXR ligands 44. Likewise, a comprehensive study performed by Jiao et al. have shown that circulating bile acid profile, hepatic gene expression pattern and gut microbiome composition in NASH are in favour of an increased proportion of FXR antagonist bile acids which could at least partially explain a reduced FXR signalling in NASH 23. Finally, the anti-fibrotic effect of the semi-synthetic FXR agonist, Obeticholic acid (OCA) also suggest that decrease FXR signalling could contribute to the progression of the disease severity 15,53.
Strengths and limitations
There are several notable strengths in this study including the profiling of circulating bile acids using LC/MS/MS in participant of two independent and complimentary well-characterized prospective cohorts encompassing the entire spectrum of NAFLD. However, we acknowledge following limitations, the cross sectional study design provides only a point in time of the fasting serum bile acids profile across the different stage of NAFLD. Thus, potential causal role of bile acids alteration in the genesis and progression of NAFLD could not have been investigated. Despite the large sample size of the biopsy-proven cohort, we acknowledge that the number of participants with advanced fibrosis is limited (N=15) corresponding to the expected prevalence of advanced fibrosis in a single center cohort of patient with NAFLD. Therefore, multicenter with larger sample size and longitudinal, studies are needed to examine the association between changes in serum bile acids and advanced fibrosis or long-term outcomes in patients with NAFLD. Although the exclusion criteria for alcohol consumption was different between the two cohorts, the thresholds used were less than necessary to suggest an excessive alcohol consumption based upon the current guidelines for the diagnosis of NAFLD 2.
Implication for future study
In this study, we report significant alteration of serum bile acids profile across the entire spectrum of NAFLD. These data confirm a strong association between bile acid metabolism and stage of fibrosis in NAFLD. Further studies are needed to better understand the complex interplay between changes in bile acids and long-term outcomes associated with NAFLD. These studies would help to determine whether these alterations indicate a causal role of bile acids in the progression of NAFLD or if they are only epiphenomena associated with disease severity in NAFLD.
Supplementary Material
ACKNOWLEGMENT
The authors would like to thank Dr Julia Kozlitina for the critical revision of the manuscript and thoughtful comments on the manuscript
Grant support: The study was conducted at the Clinical and Translational Research Institute, University of California at San Diego. RL is supported in part by the American Gastroenterological Association (AGA) Foundation – Sucampo – ASP Designated Research Award in Geriatric Gastroenterology and by a T. Franklin Williams Scholarship Award; Funding provided by: Atlantic Philanthropies, Inc, the John A. Hartford Foundation, OM, the Association of Specialty Professors, and the American Gastroenterological Association and grant K23-DK090303. RL serve PIs on the grant R01-DK106419. The content is solely the responsibility of the authors and does not necessarily represent the official views of the NIH.
CC is supported by grants from the Société Francophone du Diabète (SFD), the Philippe Foundation
Abbreviations
- BA
Bile acids
- BMI
body mass index
- MRI-PDFF
magnetic resonance imaging-proton density fat fraction
- NAFLD
nonalcoholic fatty liver disease
- NASH
nonalcoholic steatohepatitis
- UCSD
University of California at San Diego
- CA
cholate
- GCA
glycocholate
- TCA
taurocholate
- CDCA
chenodeoxycholate
- GCDA
glycochenodeoxycholate
- TCDA
taurochenodeoxycholate
- DCA
deoxycholate
- GDCA
glycodeoxycholate
- TDCA
taurodeoxycholate
- GHCA
glycohyocholate
- FXR
farnesoid X receptor
Footnotes
Conflict of interests: the authors report no conflict of interests.
Guarantor(s) of the article: Rohit Loomba
REFERENCES
- 1.Younossi ZM, Koenig AB, Abdelatif D, Fazel Y, Henry L, Wymer M. Global epidemiology of nonalcoholic fatty liver disease-Meta-analytic assessment of prevalence, incidence, and outcomes. Hepatology 2016;64(1):73–84. [DOI] [PubMed] [Google Scholar]
- 2.Chalasani N, Younossi Z, Lavine JE, et al. The diagnosis and management of nonalcoholic fatty liver disease: Practice guidance from the American Association for the Study of Liver Diseases. Hepatology 2018;67(1):328–357. [DOI] [PubMed] [Google Scholar]
- 3.Loomba R, Sanyal AJ. The global NAFLD epidemic. Nat Rev Gastroenterol Hepatol 2013;10(11):686–690. [DOI] [PubMed] [Google Scholar]
- 4.Rinella ME. Nonalcoholic fatty liver disease: a systematic review. JAMA 2015;313(22):2263–2273. [DOI] [PubMed] [Google Scholar]
- 5.Singh S, Allen AM, Wang Z, Prokop LJ, Murad MH, Loomba R. Fibrosis progression in nonalcoholic fatty liver vs nonalcoholic steatohepatitis: a systematic review and meta-analysis of paired-biopsy studies. Clin Gastroenterol Hepatol 2015;13(4):643–654 e641–649; quiz e639–640. [DOI] [PMC free article] [PubMed] [Google Scholar]
- 6.Chavez-Talavera O, Tailleux A, Lefebvre P, Staels B. Bile Acid Control of Metabolism and Inflammation in Obesity, Type 2 Diabetes, Dyslipidemia, and Nonalcoholic Fatty Liver Disease. Gastroenterology 2017;152(7):1679–1694 e1673. [DOI] [PubMed] [Google Scholar]
- 7.Allen K, Jaeschke H, Copple BL. Bile acids induce inflammatory genes in hepatocytes: a novel mechanism of inflammation during obstructive cholestasis. Am J Pathol 2011;178(1):175–186. [DOI] [PMC free article] [PubMed] [Google Scholar]
- 8.Tan KP, Yang M, Ito S. Activation of nuclear factor (erythroid-2 like) factor 2 by toxic bile acids provokes adaptive defense responses to enhance cell survival at the emergence of oxidative stress. Mol Pharmacol 2007;72(5):1380–1390. [DOI] [PubMed] [Google Scholar]
- 9.Parks DJ, Blanchard SG, Bledsoe RK, et al. Bile acids: natural ligands for an orphan nuclear receptor. Science 1999;284(5418):1365–1368. [DOI] [PubMed] [Google Scholar]
- 10.Makishima M, Okamoto AY, Repa JJ, et al. Identification of a nuclear receptor for bile acids. Science 1999;284(5418):1362–1365. [DOI] [PubMed] [Google Scholar]
- 11.Wang H, Chen J, Hollister K, Sowers LC, Forman BM. Endogenous bile acids are ligands for the nuclear receptor FXR/BAR. Mol Cell 1999;3(5):543–553. [DOI] [PubMed] [Google Scholar]
- 12.Kuipers F, Bloks VW, Groen AK. Beyond intestinal soap--bile acids in metabolic control. Nat Rev Endocrinol 2014;10(8):488–498. [DOI] [PubMed] [Google Scholar]
- 13.Copple BL, Li T. Pharmacology of bile acid receptors: Evolution of bile acids from simple detergents to complex signaling molecules. Pharmacol Res 2016;104:9–21. [DOI] [PMC free article] [PubMed] [Google Scholar]
- 14.Arab JP, Karpen SJ, Dawson PA, Arrese M, Trauner M. Bile acids and nonalcoholic fatty liver disease: Molecular insights and therapeutic perspectives. Hepatology 2017;65(1):350–362. [DOI] [PMC free article] [PubMed] [Google Scholar]
- 15.Pellicciari R, Fiorucci S, Camaioni E, et al. 6alpha-ethyl-chenodeoxycholic acid (6-ECDCA), a potent and selective FXR agonist endowed with anticholestatic activity. J Med Chem 2002;45(17):3569–3572. [DOI] [PubMed] [Google Scholar]
- 16.Sun W, Zhang D, Wang Z, et al. Insulin Resistance is Associated With Total Bile Acid Level in Type 2 Diabetic and Nondiabetic Population: A Cross-Sectional Study. Medicine (Baltimore) 2016;95(10):e2778. [DOI] [PMC free article] [PubMed] [Google Scholar]
- 17.Haeusler RA, Astiarraga B, Camastra S, Accili D, Ferrannini E. Human insulin resistance is associated with increased plasma levels of 12alpha-hydroxylated bile acids. Diabetes 2013;62(12):4184–4191. [DOI] [PMC free article] [PubMed] [Google Scholar]
- 18.Ferslew BC, Xie G, Johnston CK, et al. Altered Bile Acid Metabolome in Patients with Nonalcoholic Steatohepatitis. Dig Dis Sci 2015;60(11):3318–3328. [DOI] [PMC free article] [PubMed] [Google Scholar]
- 19.Bechmann LP, Kocabayoglu P, Sowa JP, et al. Free fatty acids repress small heterodimer partner (SHP) activation and adiponectin counteracts bile acid-induced liver injury in superobese patients with nonalcoholic steatohepatitis. Hepatology 2013;57(4):1394–1406. [DOI] [PubMed] [Google Scholar]
- 20.Dasarathy S, Yang Y, McCullough AJ, Marczewski S, Bennett C, Kalhan SC. Elevated hepatic fatty acid oxidation, high plasma fibroblast growth factor 21, and fasting bile acids in nonalcoholic steatohepatitis. Eur J Gastroenterol Hepatol 2011;23(5):382–388. [DOI] [PMC free article] [PubMed] [Google Scholar]
- 21.Kalhan SC, Guo L, Edmison J, et al. Plasma metabolomic profile in nonalcoholic fatty liver disease. Metabolism 2011;60(3):404–413. [DOI] [PMC free article] [PubMed] [Google Scholar]
- 22.Puri P, Daita K, Joyce A, et al. The presence and severity of nonalcoholic steatohepatitis is associated with specific changes in circulating bile acids. Hepatology 2017. [DOI] [PMC free article] [PubMed]
- 23.Jiao N, Baker SS, Chapa-Rodriguez A, et al. Suppressed hepatic bile acid signalling despite elevated production of primary and secondary bile acids in NAFLD. Gut 2017. [DOI] [PubMed]
- 24.Le TA, Chen J, Changchien C, et al. Effect of colesevelam on liver fat quantified by magnetic resonance in nonalcoholic steatohepatitis: a randomized controlled trial. Hepatology 2012;56(3):922–932. [DOI] [PMC free article] [PubMed] [Google Scholar]
- 25.Patel NS, Peterson MR, Brenner DA, Heba E, Sirlin C, Loomba R. Association between novel MRI-estimated pancreatic fat and liver histology-determined steatosis and fibrosis in non-alcoholic fatty liver disease. Aliment Pharmacol Ther 2013;37(6):630–639. [DOI] [PMC free article] [PubMed] [Google Scholar]
- 26.Zarrinpar A, Gupta S, Maurya MR, Subramaniam S, Loomba R. Serum microRNAs explain discordance of non-alcoholic fatty liver disease in monozygotic and dizygotic twins: a prospective study. Gut 2016;65(9):1546–1554. [DOI] [PMC free article] [PubMed] [Google Scholar]
- 27.Loomba R, Schork N, Chen CH, et al. Heritability of Hepatic Fibrosis and Steatosis Based on a Prospective Twin Study. Gastroenterology 2015;149(7):1784–1793. [DOI] [PMC free article] [PubMed] [Google Scholar]
- 28.Cui J, Chen CH, Lo MT, et al. Shared genetic effects between hepatic steatosis and fibrosis: A prospective twin study. Hepatology 2016;64(5):1547–1558. [DOI] [PMC free article] [PubMed] [Google Scholar]
- 29.Caussy C, Soni M, Cui J, et al. Nonalcoholic fatty liver disease with cirrhosis increases familial risk for advanced fibrosis. J Clin Invest 2017;127(7):2697–2704. [DOI] [PMC free article] [PubMed] [Google Scholar]
- 30.Caussy C, Alquiraish MH, Nguyen P, et al. Optimal threshold of controlled attenuation parameter with MRI-PDFF as the gold standard for the detection of hepatic steatosis. Hepatology 2017. [DOI] [PMC free article] [PubMed]
- 31.Cui J, Philo L, Nguyen P, et al. Sitagliptin vs. placebo for non-alcoholic fatty liver disease: A randomized controlled trial. J Hepatol 2016;65(2):369–376. [DOI] [PMC free article] [PubMed] [Google Scholar]
- 32.Caussy C, Hsu C, Lo MT, et al. Novel link between gut-microbiome derived metabolite and shared gene-effects with hepatic steatosis and fibrosis in NAFLD. Hepatology 2018. [DOI] [PMC free article] [PubMed]
- 33.Park CC, Nguyen P, Hernandez C, et al. Magnetic Resonance Elastography vs Transient Elastography in Detection of Fibrosis and Noninvasive Measurement of Steatosis in Patients With Biopsy-Proven Nonalcoholic Fatty Liver Disease. Gastroenterology 2017;152(3):598–607 e592. [DOI] [PMC free article] [PubMed] [Google Scholar]
- 34.Loomba R, Seguritan V, Li W, et al. Gut Microbiome-Based Metagenomic Signature for Non-invasive Detection of Advanced Fibrosis in Human Nonalcoholic Fatty Liver Disease. Cell Metab 2017;25(5):1054–1062 e1055. [DOI] [PMC free article] [PubMed] [Google Scholar]
- 35.Kleiner DE, Brunt EM, Van Natta M, et al. Design and validation of a histological scoring system for nonalcoholic fatty liver disease. Hepatology 2005;41(6):1313–1321. [DOI] [PubMed] [Google Scholar]
- 36.Permutt Z, Le TA, Peterson MR, et al. Correlation between liver histology and novel magnetic resonance imaging in adult patients with non-alcoholic fatty liver disease - MRI accurately quantifies hepatic steatosis in NAFLD. Aliment Pharmacol Ther 2012;36(1):22–29. [DOI] [PMC free article] [PubMed] [Google Scholar]
- 37.Evans AM, DeHaven CD, Barrett T, Mitchell M, Milgram E. Integrated, nontargeted ultrahigh performance liquid chromatography/electrospray ionization tandem mass spectrometry platform for the identification and relative quantification of the small-molecule complement of biological systems. Analytical chemistry 2009;81(16):6656–6667. [DOI] [PubMed] [Google Scholar]
- 38.Dehaven CD, Evans AM, Dai H, Lawton KA. Organization of GC/MS and LC/MS metabolomics data into chemical libraries. Journal of cheminformatics 2010;2(1):9. [DOI] [PMC free article] [PubMed] [Google Scholar]
- 39.Hofmann AF, Marschall HU. Plasma Bile Acid Concentrations in Humans: Suggestions for Presentation in Tabular Form. Hepatology 2018. [DOI] [PubMed]
- 40.Angulo P, Kleiner DE, Dam-Larsen S, et al. Liver Fibrosis, but No Other Histologic Features, Is Associated With Long-term Outcomes of Patients With Nonalcoholic Fatty Liver Disease. Gastroenterology 2015;149(2):389–397 e310. [DOI] [PMC free article] [PubMed] [Google Scholar]
- 41.Jahn D, Geier A. Bile acids in nonalcoholic steatohepatitis: Pathophysiological driving force or innocent bystanders? Hepatology 2017. [DOI] [PubMed]
- 42.Aranha MM, Cortez-Pinto H, Costa A, et al. Bile acid levels are increased in the liver of patients with steatohepatitis. Eur J Gastroenterol Hepatol 2008;20(6):519–525. [DOI] [PubMed] [Google Scholar]
- 43.Vlahcevic ZR, Buhac I, Farrar JT, Bell CC Jr., Swell L Bile acid metabolism in patients with cirrhosis. I. Kinetic aspects of cholic acid metabolism. Gastroenterology 1971;60(4):491–498. [PubMed] [Google Scholar]
- 44.Lake AD, Novak P, Shipkova P, et al. Decreased hepatotoxic bile acid composition and altered synthesis in progressive human nonalcoholic fatty liver disease. Toxicol Appl Pharmacol 2013;268(2):132–140. [DOI] [PMC free article] [PubMed] [Google Scholar]
- 45.Mouzaki M, Wang AY, Bandsma R, et al. Bile Acids and Dysbiosis in Non-Alcoholic Fatty Liver Disease. PLoS One 2016;11(5):e0151829. [DOI] [PMC free article] [PubMed] [Google Scholar]
- 46.Betrapally NS, Gillevet PM, Bajaj JS. Changes in the Intestinal Microbiome and Alcoholic and Nonalcoholic Liver Diseases: Causes or Effects? Gastroenterology 2016;150(8):1745–1755 e1743. [DOI] [PMC free article] [PubMed] [Google Scholar]
- 47.Henao-Mejia J, Elinav E, Jin C, et al. Inflammasome-mediated dysbiosis regulates progression of NAFLD and obesity. Nature 2012;482(7384):179–185. [DOI] [PMC free article] [PubMed] [Google Scholar]
- 48.Zhu L, Baker SS, Gill C, et al. Characterization of gut microbiomes in nonalcoholic steatohepatitis (NASH) patients: a connection between endogenous alcohol and NASH. Hepatology 2013;57(2):601–609. [DOI] [PubMed] [Google Scholar]
- 49.Boursier J, Mueller O, Barret M, et al. The severity of nonalcoholic fatty liver disease is associated with gut dysbiosis and shift in the metabolic function of the gut microbiota. Hepatology 2016;63(3):764–775. [DOI] [PMC free article] [PubMed] [Google Scholar]
- 50.Kakiyama G, Pandak WM, Gillevet PM, et al. Modulation of the fecal bile acid profile by gut microbiota in cirrhosis. J Hepatol 2013;58(5):949–955. [DOI] [PMC free article] [PubMed] [Google Scholar]
- 51.Ridlon JM, Alves JM, Hylemon PB, Bajaj JS. Cirrhosis, bile acids and gut microbiota: unraveling a complex relationship. Gut Microbes 2013;4(5):382–387. [DOI] [PMC free article] [PubMed] [Google Scholar]
- 52.Yoshimoto S, Loo TM, Atarashi K, et al. Obesity-induced gut microbial metabolite promotes liver cancer through senescence secretome. Nature 2013;499(7456):97–101. [DOI] [PubMed] [Google Scholar]
- 53.Loomba R, Sanyal AJ, Kowdley KV, et al. Factors Associated with Histologic Response in Adult Patients with Nonalcoholic Steatohepatitis. Gastroenterology 2018. [DOI] [PMC free article] [PubMed]
Associated Data
This section collects any data citations, data availability statements, or supplementary materials included in this article.